. 2018 Sep 28;9(1):3982.
doi: 10.1038/s41467-018-05639-x.

Systems biology approach reveals a link between mTORC1 and G2/M DNA damage checkpoint recovery

Affiliations

Systems biology approach reveals a link between mTORC1 and G2/M DNA damage checkpoint recovery

Hui-Ju Hsieh et al. Nat Commun. .

Abstract

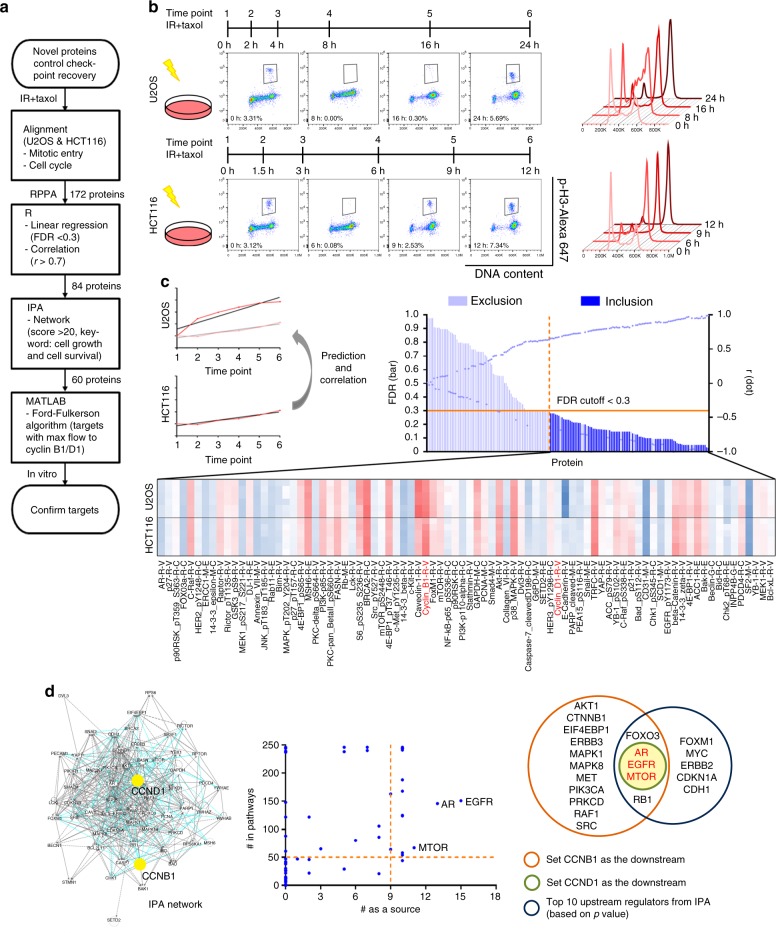
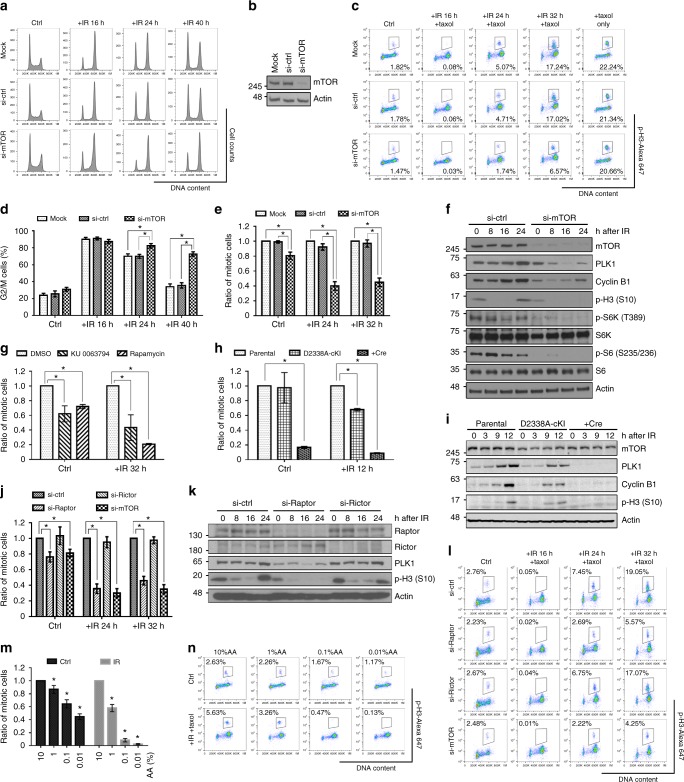
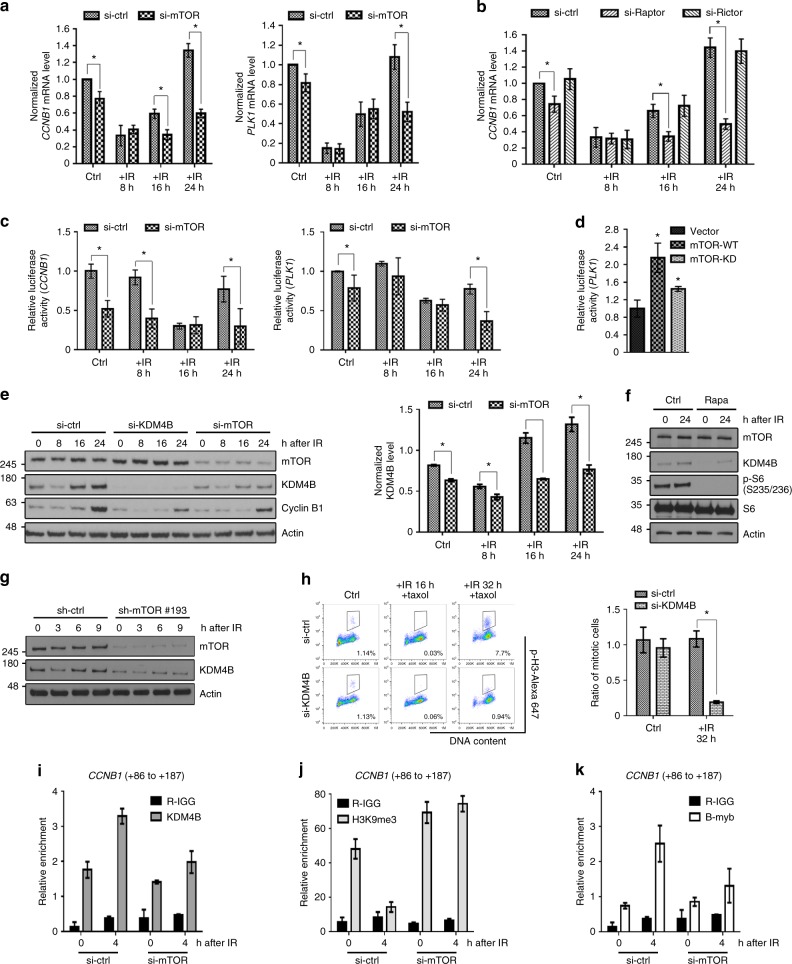
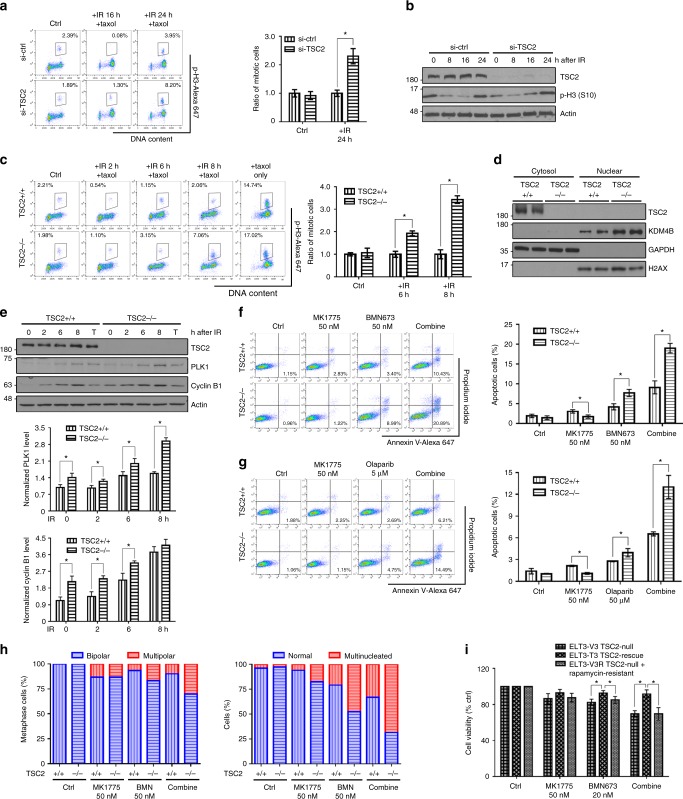
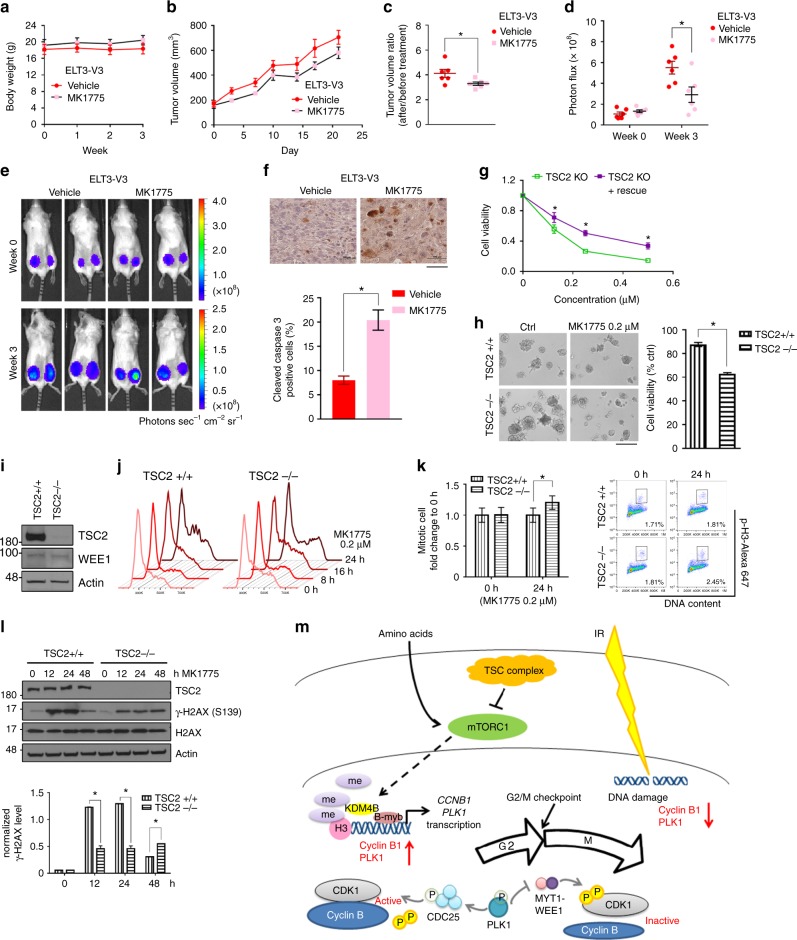
Checkpoint recovery, the process that checkpoint-arrested cells with normal DNA repair capacity resume cell cycle progression, is essential for genome stability. However, the signaling network of the process has not been clearly defined. Here, we combine functional proteomics, mathematical modeling, and molecular biology to identify mTORC1, the nutrient signaling integrator, as the determinant for G2/M checkpoint recovery. Inhibition of the mTORC1 pathway delays mitotic entry after DNA damage through KDM4B-mediated regulation of CCNB1 and PLK1 transcription. Cells with hyper-mTORC1 activity caused by TSC2 depletion exhibit accelerated G2/M checkpoint recovery. Those Tsc2-null cells are sensitive to WEE1 inhibition in vitro and in vivo by driving unscheduled mitotic entry and inducing mitotic catastrophe. These results reveal that mTORC1 functions as a mediator between nutrition availability sensing and cell fate determination after DNA damage, suggesting that checkpoint inhibitors may be used to treat mTORC1-hyperactivated tumors such as those associated with tuberous sclerosis complex.


Conflict of interest statement

G.B.M. is on the S.A.B. of AstraZeneca, has licensed H.R.D. assay to Myriad Genetics, and has research support from Abbie, AstraZeneca, and Tesoro. The remaining authors declare no competing interests.

Figures

Fig. 1
Fig. 1
mTOR is a candidate for the key molecule regulating G2/M checkpoint recovery. a The flow chart demonstrates the process by which we identified candidates involved in DNA damage recovery from RPPA results. b RPPA was performed in U2OS cells and HCT116 cells. Cells were irradiated with 7 Gy of IR and then were trapped in the mitotic phase using 2 μM paclitaxel for a period of time. Six time points were chosen on the basis of cell cycle patterns and mitotic entry analysis. The percentage of mitotic cells, defined as p-H3-positive cells, is shown in each representative graph. c We used the linear regression slope of each protein in HCT116 cells to predict the same protein expression in U2OS cells and calculate correlations between the two cell lines. Regression equations with a false discovery rate of <0.3 were considered to show a significant linear relationship, and among those proteins, we selected those with a correlation r-value of >0.7 for IPA network analysis. The names in red were two proteins we used as the downstream targets for calculation. d We generated the network in IPA. The scatter plot represents the calculation results based on the Ford-Fulkerson algorithm. The potential upstream targets (words in red) came from the comparison between our calculation results and IPA upstream regulator analysis. FDR false discovery rate, taxol paclitaxel
Fig. 2
Fig. 2
mTORC1 regulates G2/M checkpoint recovery. a, d U2OS cells were collected at different time points after IR (7 Gy) for cell cycle analysis, and the percentages of G2/M cells are presented in d. b The depletion of mTOR in ae was detected by western blotting. c, en Cells were treated with IR (7 Gy) and 2 μM paclitaxel following different siRNA transfection in c, e, f, jl, different mTOR inhibitor treatments (20 nM rapamycin or 1 μM KU0063794 for 24 h before IR) in g, either Ad5-CMV-empty or Ad5-CMV-Cre virus particle infection in h and i, or different concentrations of amino acids (AA; normal medium with 100% AA, 28 h before IR) in m and n. Cells were then stained with propidium iodide and p-H3 for mitotic entry analysis . The numbers in representative flow cytometry plots indicate percentages of mitotic cells, which were defined as p-H3-positive cells with 4N DNA contents. Protein samples at different time points were collected for western blotting . Actin was an internal control. Mock: cells incubated with only the transfection reagent; si-ctrl, si-Raptor, si-Rictor, or si-mTOR: cells transfected with non-target control siRNA, raptor, rictor, or mTOR siRNA, respectively; ctrl: control; error bars: mean ± SEM in d, e, g, j and mean ± SD in h, m; n = 3 independent experiments; *p < 0.05, two-tailed, unpaired Student's t-tests
Fig. 3
Fig. 3
KDM4B links mTORC1 to positive transcriptional control of CCNB1 and PLK1. a, b U2OS cells transfected with siRNAs were collected at different time points after IR (7 Gy) and 2 μM paclitaxel treatment. CCNB1 and PLK1 mRNA levels were measured by quantitative reverse transcriptase-PCR and normalized to actin. c The dual-luciferase reporter assay was conducted in U2OS cells transfected with siRNA. The value of firefly luciferase driven by the CCNB1 or PLK1 promoter was normalized to the Renilla-luciferase value. d We used the dual-luciferase reporter assay in U2OS cells expressing the control vector, wild-type mTOR (mTOR-WT), or kinase-dead mTOR (mTOR-KD) constructs. e U2OS cells transfected with siRNAs were collected at different time points after IR and paclitaxel treatment for western blotting. The bar graph shows the KDM4B protein expression level normalized to actin in each group. f U2OS cells treated with or without 20 nM rapamycin were exposed to IR and paclitaxel. g We depleted mTOR by an individual shRNA (sh-mTOR #193) in HCT116 cells and treated cells with IR (7 Gy) plus 2 μM paclitaxel. h U2OS cells transfected with control or KDM4B siRNAs were exposed to IR (7 Gy) plus 2 μM paclitaxel and were stained with propidium iodide and p-H3 for mitotic entry analysis. The numbers in the representative flow cytometry plots indicate the percentages of p-H3-positive stained cells. ik U2OS cells treated with IR (7 Gy) were collected for ChIP analysis using anti-KDM4B, anti-H3K9me3, or anti-BMYB antibody. The immunoprecipitated DNA fragments were amplified with the primer to the CCNB1 transcription regulation region. si-ctrl, si-Raptor, si-Rictor, si-KDM4B, and si-mTOR: cells transfected with non-target control siRNA, raptor, rictor, KDM4B, and mTOR siRNA, respectively; ctrl, control; rapa, rapamycin; taxol, paclitaxel; R-IGG: normal rabbit IgG; error bars: mean ± SD; n = 3 independent experiments; *p < 0.05, two-tailed, unpaired Student's t-tests
Fig. 4
Fig. 4
High mTORC1 activity facilitates recovery from G2/M checkpoint and promotes sensitivity to WEE1 and PARP inhibition. a, b We transfected either non-target control siRNA (si-ctrl) or TSC2 siRNA pool (si-TSC2) into U2OS cells and treated the cells with IR (7 Gy) plus 2 μM paclitaxel. The mitotic percentage (p-H3-positive cells) is shown in the plots. p-H3 protein expression was also detected. c, e MEFs were irradiated immediately followed by paclitaxel treatment. Cells treated with paclitaxel alone (the “+ taxol only” and the “T” groups) were collected after 8 h of treatment. For mitotic entry analysis, the numbers in the plots indicate the percentages of p-H3-positive cells. d MEFs treated with IR plus paclitaxel for 2 h were separated into nuclear and non-nuclear fractions by the Dounce homogenizer. f, g MEFs were incubated with 50 nM MK1775 or/and one PARP inhibitor, 50 nM BMN673 or 5 μM olaparib, for 48 h and were stained with annexin V and propidium iodide. Apoptotic cells were defined as annexin V-positive cells. The percentages of apoptotic cells are shown in representative plots. h MEFs were treated with 50 nM MK1775 or/and 50 nM BMN673 for 36 h and were stained with α-tubulin and DAPI. The numbers of centrosomes and nuclei per cell were calculated. i We treated ELT3 cells with 50 nM MK1775 or/and 20 nM BMN673 for 4 days. Cell viability was measured by MTT assay. TSC2+/+: Tsc2+/+, Tsc2 wild-type; TSC2−/−: Tsc2−/−, Tsc2 null; ELT3-V3: Tsc2-null Eker rat uterine leiomyoma cells with the control vector; ELT3-T3: Tsc2-null ELT3 cells reexpressing Tsc2; ETL3-V3R: rapamycin-resistant ELT3-V3 cells; ctrl: control; error bars: mean ± SEM in a, c and mean ± SD in eg, i; n = 3 independent experiments; *p < 0.05, two-tailed, unpaired Student's t-tests
Fig. 5
Fig. 5
TSC2 is a potential therapeutic target for WEE1 inhibition. af ELT3-V3-luciferase cells were injected into mice. Five weeks later, mice were treated with the vehicle or 60 mg kg−1 MK1775 three times a week. a Mice body weights were monitored weekly for potential drug toxicity. b, c Tumor volumes using the formula (length × width2)/2, and d, e bioluminescence levels were monitored regularly. f Tissue sections were stained with cleaved-caspase 3 and hematoxylin and the graph represents the percentage of cleaved-caspase 3-positive cells in each group. (The scale bar is 100 µm.) g MEFs were treated with different concentrations of MK1775 in 96-well plates for 4 days, and cell viability was measured by MTT assay. MK1775 sensitivity was presented as the ratio to the untreated group in each cell line. h MEFs were embedded in Matrigel (day 0) and treated with 0.2 μM MK1775 from day 3. The medium with or without MK1775 was changed every 3 days. The representative photos were taken on day 10, and the graph shows the ratio of treated to untreated colonies in each cell line. (The scale bar is 200 µm.) i WEE1 protein expression levels were checked in MEFs. j, l MEFs treated with 0.2 μM MK1775 were collected at different time points for cell cycle analysis and western blotting. The graph in l indicates expression of γ-H2AX normalized to actin in each group. k MEFs treated with 0.2 μM MK1775 for 24 h were collected for mitotic entry analysis. Percentages of mitotic cells are shown in representative plots. m The schematic summarizes how mTOR controls G2/M checkpoint recovery. The nutrient sensor mTORC1 facilitates G2/M DNA damage checkpoint recovery through an increase in KDM4B-mediated regulation of CCNB1 and PLK1 transcription. TSC2+/+: Tsc2+/+, Tsc2 wild type; TSC2−/− and TSC2 KO: Tsc2−/−, Tsc2 null; TSC2 KO+ rescue: Tsc2-null cells with reconstitutive Tsc2; ELT3-V3: Tsc2-null Eker rat uterine leiomyoma cells with the control vector; ELT3-T3: Tsc2-null ELT3 cells reexpressing Tsc2; error bars: mean ± SEM in ad, f and mean ± SD in g, h, k, l; n = 3 independent experiments or n = 6 in the animal model; *p < 0.05, two-tailed, unpaired Student's t-tests

Similar articles

Cited by

References

    1. Zhou BB, Elledge SJ. The DNA damage response: putting checkpoints in perspective. Nature. 2000;408:433–439. doi: 10.1038/35044005. - DOI - PubMed
    1. Ciccia A, Elledge SJ. The DNA damage response: making it safe to play with knives. Mol. Cell. 2010;40:179–204. doi: 10.1016/j.molcel.2010.09.019. - DOI - PMC - PubMed
    1. Harrison JC, Haber JE. Surviving the breakup: the DNA damage checkpoint. Annu. Rev. Genet. 2006;40:209–235. doi: 10.1146/annurev.genet.40.051206.105231. - DOI - PubMed
    1. Creighton CJ, Huang S. Reverse phase protein arrays in signaling pathways: a data integration perspective. Drug Des. Dev. Ther. 2015;9:3519–3527. - PMC - PubMed
    1. Huang YJ, Frazier ML, Zhang N, Liu Q, Wei C. Reverse-phase protein array analysis to identify biomarker proteins in human pancreatic cancer. Dig. Dis. Sci. 2014;59:968–975. doi: 10.1007/s10620-013-2938-9. - DOI - PMC - PubMed

Publication types

Substances