Review
. 2018 Nov;19(11):687-700.
doi: 10.1038/s41583-018-0067-3.

Imaging the evolution and pathophysiology of Alzheimer disease

Affiliations
Review

Imaging the evolution and pathophysiology of Alzheimer disease

William Jagust. Nat Rev Neurosci. 2018 Nov.

Abstract

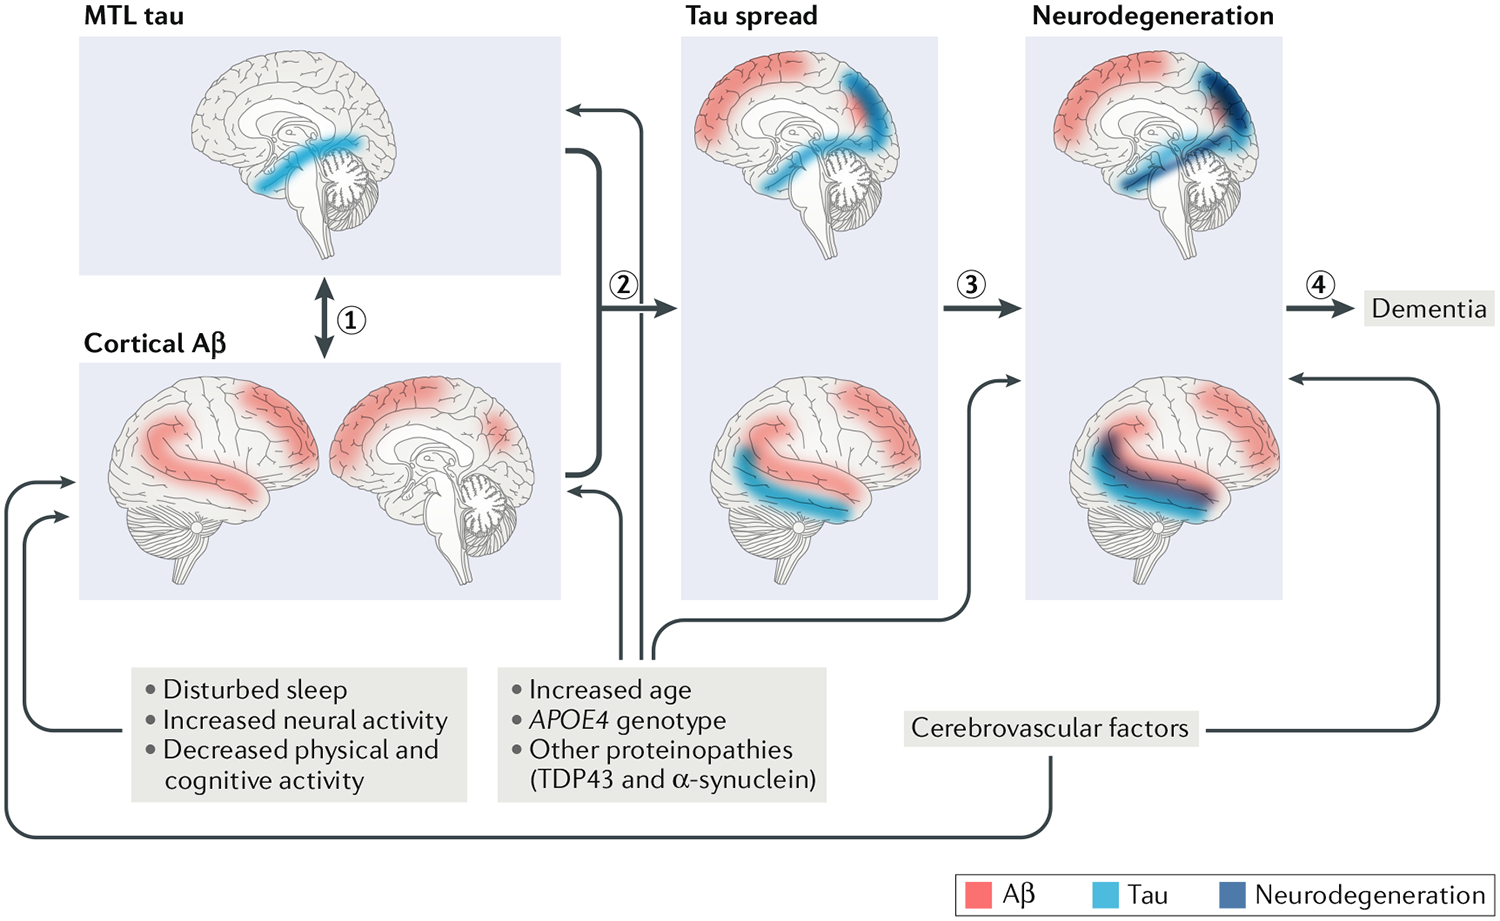
Technologies for imaging the pathophysiology of Alzheimer disease (AD) now permit studies of the relationships between the two major proteins deposited in this disease - amyloid-β (Aβ) and tau - and their effects on measures of neurodegeneration and cognition in humans. Deposition of Aβ in the medial parietal cortex appears to be the first stage in the development of AD, although tau aggregates in the medial temporal lobe (MTL) precede Aβ deposition in cognitively healthy older people. Whether aggregation of tau in the MTL is the first stage in AD or a fairly benign phenomenon that may be transformed and spread in the presence of Aβ is a major unresolved question. Despite a strong link between Aβ and tau, the relationship between Aβ and neurodegeneration is weak; rather, it is tau that is associated with brain atrophy and hypometabolism, which, in turn, are related to cognition. Although there is support for an interaction between Aβ and tau resulting in neurodegeneration that leads to dementia, the unknown nature of this interaction, the strikingly different patterns of brain Aβ and tau deposition and the appearance of neurodegeneration in the absence of Aβ and tau are challenges to this model that ultimately must be explained.


Conflict of interest statement

Competing interests

The author serves as a consultant to BioClinica, Novartis and Genentech.

Figures

Fig. 1 |
Fig. 1 |. Patterns of brain amyloid-β deposition.
a | Brain map of amyloid-β (Aβ) accumulation, showing marked increases in Aβ (yellow denotes highest levels), as measured with the positron emission tomography (PET) tracer 18F-florbetapir in 191 amyloid-positive individuals without dementia compared with 218 amyloid-negative individuals. The brain regions susceptible to Aβ accumulation comprise large areas of the medial and lateral association cortex. b | Superimposition of the distribution of Aβ (in blue), as detected by 11C-Pittsburgh compound B- (PIB), onto the spatial location of the default mode network (DMN; in yellow) in the brains of cognitively healthy older people. The red brain regions reflect the spatial overlap between the DMN and Aβ accumulation. c | Brain map of Aβ accumulation in a group of 59 individuals without dementia who were defined as ‘early accumulators’ on the basis of evidence of abnormal cerebrospinal fluid levels of Aβ but normal 18F-florbetapir PET scans. The statistical maps show the areas of earliest accumulation of Aβ (yellow reflects areas of highest Aβ accumulation). Parts a and c are adapted from reF., Springer Nature Limited, CC By 4.0. Part b is adapted with permission from reF., Mormino, E. C. et al. Relationships between β-amyloid and functional connectivity in different components of the default mode network in aging. Cereb. Cortex (2011) 21(10), 2399–2407, by permission of Oxford University Press.
Fig. 2 |
Fig. 2 |. Patterns of brain atrophy and glucose hypometabolism in Alzheimer disease.
The maps were constructed by contrasting 18F-fluorodeoxyglucose-positron emission topography (FDG-PET) and MRI measures of cortical thickness for 50 individuals with Alzheimer disease (AD) and 39 cognitively healthy individuals from the Alzheimer’s Disease Neuroimaging Initiative. a | The map shows glucose hypometabolism in AD in the bilateral temporal and inferior parietal cortex, parts of the frontal cortex and the precuneus. b | Cortical thinning in AD occurs in comparable but somewhat smaller brain regions. Yellow regions indicate the areas of greatest hypometabolism or atrophy. Figure is adapted with permission from reF., republished with permission of Society for Neuroscience, from Alzheimer’s disease neurodegenerative biomarkers are associated with decreased cognitive function but not β-amyloid in cognitively normal older individuals, Wirth, M. et al., 33 (2013), permission conveyed through Copyright Clearance Center, Inc.
Fig. 3 |
Fig. 3 |. Tau deposition in ageing and Alzheimer disease.
Using the positron emission topography (PET) radiotracer 18F-AV1451 (flortaucipir), a group of 216 individuals, including young and old cognitively healthy individuals and those with mild cognitive impairment and Alzheimer disease (AD), were staged with an adaptation of the Braak and Braak criteria. Individuals were assigned to Braak stages I/II, III/IV or V/VI using PET imaging data as previously described. a | The images show the contrast in tracer retention between those categorized as Braak stages I/II and those as stage 0, indicating that tau aggregation (yellow and red) begins in the medial temporal lobes. b | A contrast between stage III/IV and stage I/II indicates that subsequent progression of tau pathology is associated with tau aggregation in the inferolateral temporal and medial parietal lobes. c | A contrast between stage V/VI and III/IV indicates that the late stages of AD are characterized by widespread tau deposition (red). d | A map of all voxels in the brain over a threshold of 1.4 standard uptake value ratio (SUVR) units reveals the global distribution of tau in healthy individuals and those with advanced AD. L , left; R , right. Figure is adapted with permission from reF., Elsevier.
Fig. 4 |
Fig. 4 |. Relationships between canonical resting-state networks and amyloid-β deposition.
Brain maps show the topography of resting-state networks, defined using an independent component analysis with dual regression in a group of 92 cognitively healthy older individuals also imaged for brain amyloid-β (Aβ) with 11C-Pittsburgh compound B (PIB). Blue regions highlight where global brain Aβ deposition (part a) is associated with changes in resting network activity (either increases or decreases) or where local, or regional (part b), Aβ deposition is associated with network activity alterations. These regions are prominent in the default mode network (DMN) but are not isolated to this network: they occur in areas where networks converge that are also associated with high between-network and within-network connectivity. The affected regions are also similar to those affected by atrophy and hypometabolism (Fig. 2). The colours indicate the location of the networks. DAN, dorsal attention network; FPCN, frontoparietal control network; SN, salience network. Figure is reproduced with permission from reF., Elman, J. A. et al. Effects of beta-amyloid on resting state functional connectivity within and between networks reflect known patterns of regional vulnerability. Cereb. Cortex (2016) 26(2), 695–707 , by permission of Oxford University Press.
Fig. 5 |
Fig. 5 |. Proposed relationships between pathological protein accumulation, neurodegeneration and drivers of the Alzheimer disease process.
The initial stages of Alzheimer disease (AD) development reflect relationships between cortical amyloid-β (Aβ; red) and tau (blue) in the medial temporal lobe (MTL) (1). This process appears to begin with Aβ deposition in the cortex but could have a bidirectional nature as accumulation of MTL tau, which may or may not reflect AD, usually precedes cortical Aβ in cognitively healthy older people. The relationship between these two proteins is associated with spread of tau out of the MTL into the medial parietal, lateral parietal and temporal cortices (2). This tau spread is associated with neurodegeneration (dark blue) in a similar topography to tau deposition (3), which in turn is related to cognitive decline and, eventually , dementia (4). Drivers of Aβ include various processes and factors. Disturbed or diminished sleep, increased neural activity , reduced physical and cognitive activity , cerebrovascular disease, old age, the apolipoprotein E gene ε4 allele (APOE4) and other proteinopathies have been linked to Aβ deposition. Some of these associations have not been described for tau pathology , but this could reflect the relative novelty of in vivo tau imaging. Old age, APOE4 and other proteinopathies appear to be associated with tau deposition in the MTL. Neurodegeneration is also associated with these factors and with cerebrovascular disease. Increased age, APOE4, other proteinopathies and cerebrovascular disease may also affect neurodegeneration independent of their effects on tau or Aβ. TDP43, TAR DNA-binding protein 43.

References

    1. Small SA, Schobel SA, Buxton RB, Witter MP & Barnes CA A pathophysiological framework of hippocampal dysfunction in ageing and disease. Nat. Rev. Neurosci 12, 585–601 (2011). - PMC - PubMed
    1. Nelson PT et al. Correlation of Alzheimer disease neuropathologic changes with cognitive status: a review of the literature. J. Neuropathol. Exp. Neurol 71, 362–381 (2012). - PMC - PubMed
    1. Ittner LM & Gotz J Amyloid-β and tau — a toxic pas de deux in Alzheimer’s disease. Nat. Rev. Neurosci 12, 65–72 (2011). - PubMed
    1. Hyman BT et al. National Institute on Aging-Alzheimer’s Association guidelines for the neuropathologic assessment of Alzheimer’s disease. Alzheimers Dement. 8, 1–13 (2012). - PMC - PubMed
    1. Price JL & Morris JC Tangles and plaques in nondemented aging and “preclinical” Alzheimer’s disease. Ann. Neurol 45, 358–368 (1999). - PubMed

Publication types