

Comprehensive intravascular imaging of atherosclerotic plaque in vivo using optical coherence tomography and fluorescence lifetime imaging
- PMID: 30267024
- PMCID: PMC6162321
- DOI: 10.1038/s41598-018-32951-9
Comprehensive intravascular imaging of atherosclerotic plaque in vivo using optical coherence tomography and fluorescence lifetime imaging
Abstract
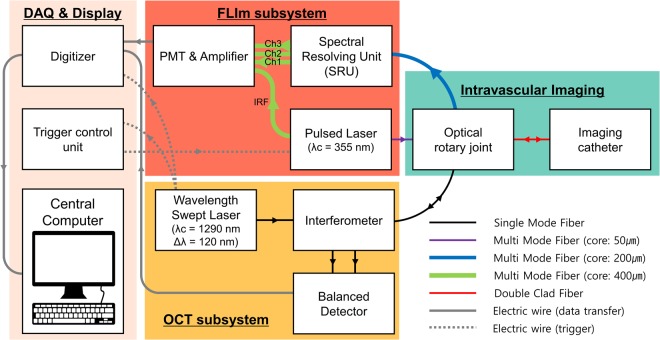
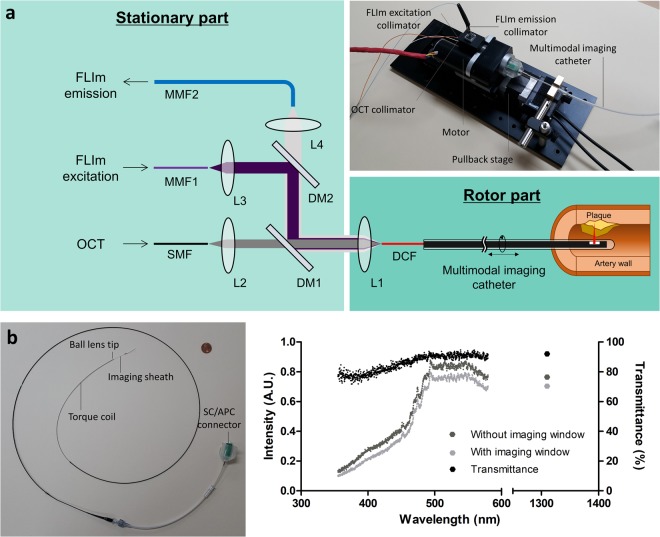
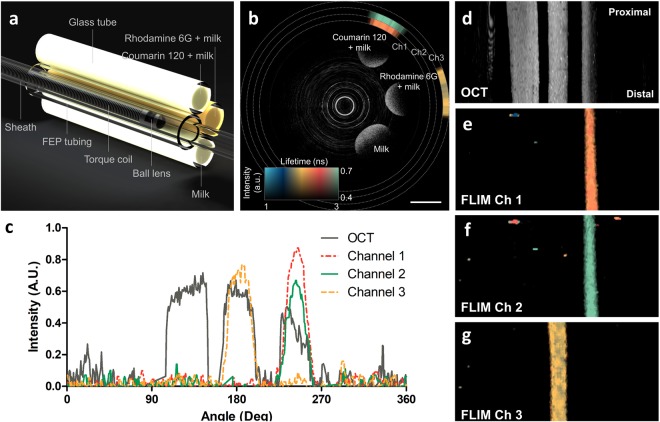
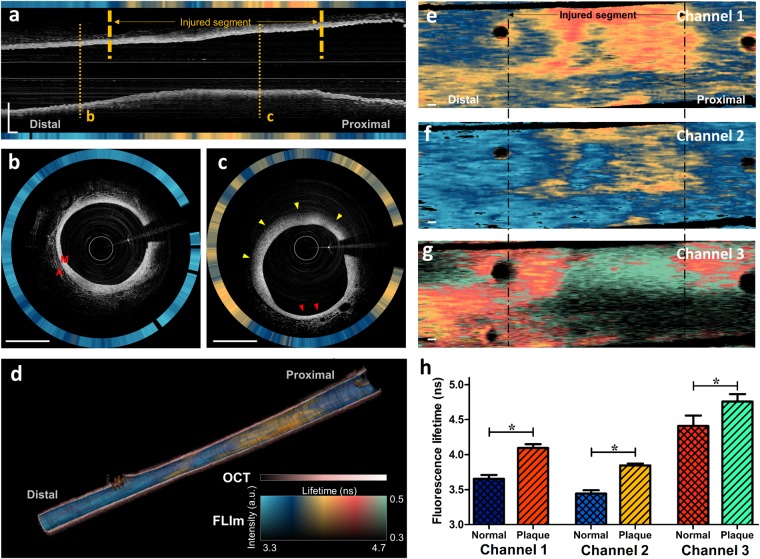
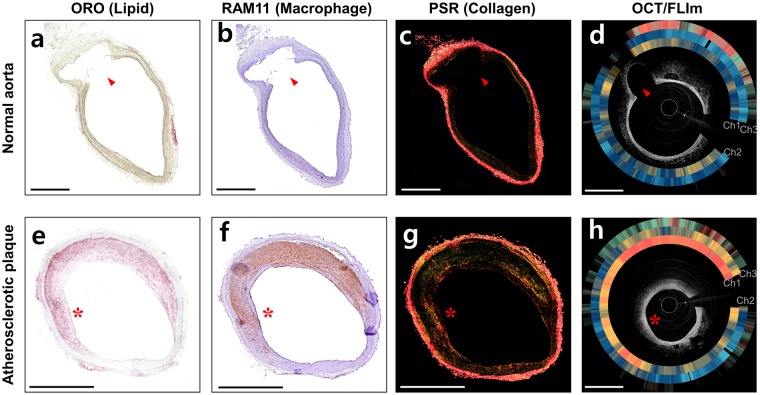
Comprehensive imaging of both the structural and biochemical characteristics of atherosclerotic plaque is essential for the diagnosis and study of coronary artery disease because both a plaque's morphology and its biochemical composition affect the level of risk it poses. Optical coherence tomography (OCT) and fluorescence lifetime imaging (FLIm) are promising optical imaging methods for characterizing coronary artery plaques morphologically and biochemically, respectively. In this study, we present a hybrid intravascular imaging device, including a custom-built OCT/FLIm system, a hybrid optical rotary joint, and an imaging catheter, to visualize the structure and biochemical composition of the plaque in an atherosclerotic rabbit artery in vivo. Especially, the autofluorescence lifetime of the endogenous tissue molecules can be used to characterize the biochemical composition; thus no exogenous contrast agent is required. Also, the physical properties of the imaging catheter and the imaging procedures are similar to those already used clinically, facilitating rapid translation into clinical use. This new intravascular imaging catheter can open up new opportunities for clinicians and researchers to investigate and diagnose coronary artery disease by simultaneously providing tissue microstructure and biochemical composition data in vivo without the use of exogenous contrast agent.
Conflict of interest statement
The authors declare no competing interests.
Figures
Similar articles
-
In Vivo Translation of the CIRPI System: Revealing Molecular Pathology of Rabbit Aortic Atherosclerotic Plaques.J Nucl Med. 2019 Sep;60(9):1308-1316. doi: 10.2967/jnumed.118.222471. Epub 2019 Feb 8. J Nucl Med. 2019. PMID: 30737298 Free PMC article.
-
Simultaneous morphological and biochemical endogenous optical imaging of atherosclerosis.Eur Heart J Cardiovasc Imaging. 2015 Aug;16(8):910-8. doi: 10.1093/ehjci/jev018. Epub 2015 Feb 26. Eur Heart J Cardiovasc Imaging. 2015. PMID: 25722204 Free PMC article.
-
Dual-modality fluorescence lifetime imaging-optical coherence tomography intravascular catheter system with freeform catheter optics.J Biomed Opt. 2022 Jul;27(7):076005. doi: 10.1117/1.JBO.27.7.076005. J Biomed Opt. 2022. PMID: 35864574 Free PMC article.
-
Hybrid intravascular imaging: recent advances, technical considerations, and current applications in the study of plaque pathophysiology.Eur Heart J. 2017 Feb 7;38(6):400-412. doi: 10.1093/eurheartj/ehw097. Eur Heart J. 2017. PMID: 27118197 Free PMC article. Review.
-
A Survey on Coronary Atherosclerotic Plaque Tissue Characterization in Intravascular Optical Coherence Tomography.Curr Atheroscler Rep. 2018 May 21;20(7):33. doi: 10.1007/s11883-018-0736-8. Curr Atheroscler Rep. 2018. PMID: 29781047 Review.
Cited by
-
Vulnerable plaques and patients: state-of-the-art.Eur Heart J. 2020 Aug 14;41(31):2997-3004. doi: 10.1093/eurheartj/ehaa227. Eur Heart J. 2020. PMID: 32402086 Free PMC article.
-
SEL1L3 as a link molecular between renal cell carcinoma and atherosclerosis based on bioinformatics analysis and experimental verification.Aging (Albany NY). 2023 Nov 21;15(22):13150-13162. doi: 10.18632/aging.205227. Epub 2023 Nov 21. Aging (Albany NY). 2023. PMID: 37993256 Free PMC article.
-
Intracoronary Structural-Molecular Imaging for Multitargeted Characterization of High-Risk Plaque: First-in-Human OCT-FLIm.JAMA Cardiol. 2025 Jul 1;10(7):708-717. doi: 10.1001/jamacardio.2025.0928. JAMA Cardiol. 2025. PMID: 40332864 Free PMC article.
-
Dual modality intravascular catheter system combining pulse-sampling fluorescence lifetime imaging and polarization-sensitive optical coherence tomography.Biomed Opt Express. 2024 Mar 5;15(4):2114-2132. doi: 10.1364/BOE.516515. eCollection 2024 Apr 1. Biomed Opt Express. 2024. PMID: 38633060 Free PMC article.
-
Mesoscopic fluorescence lifetime imaging: Fundamental principles, clinical applications and future directions.J Biophotonics. 2021 Jun;14(6):e202000472. doi: 10.1002/jbio.202000472. Epub 2021 Mar 29. J Biophotonics. 2021. PMID: 33710785 Free PMC article. Review.
References
-
- Prati F, et al. Expert review document on methodology, terminology, and clinical applications of optical coherence tomography: physical principles, methodology of image acquisition, and clinical application for assessment of coronary arteries and atherosclerosis. Eur Heart J. 2010;31:401–415. doi: 10.1093/eurheartj/ehp433. - DOI - PubMed
Publication types
MeSH terms
LinkOut - more resources
Full Text Sources
Other Literature Sources
Medical
