Hdac1 Regulates Differentiation of Bipotent Liver Progenitor Cells During Regeneration via Sox9b and Cdk8
- PMID: 30267710
- PMCID: PMC6309465
- DOI: 10.1053/j.gastro.2018.09.039
Hdac1 Regulates Differentiation of Bipotent Liver Progenitor Cells During Regeneration via Sox9b and Cdk8
Abstract
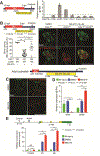
Background & aims: Upon liver injury in which hepatocyte proliferation is compromised, liver progenitor cells (LPCs), derived from biliary epithelial cells (BECs), differentiate into hepatocytes. Little is known about the mechanisms of LPC differentiation. We used zebrafish and mouse models of liver injury to study the mechanisms.
Methods: We used transgenic zebrafish, Tg(fabp10a:CFP-NTR), to study the effects of compounds that alter epigenetic factors on BEC-mediated liver regeneration. We analyzed zebrafish with disruptions of the histone deacetylase 1 gene (hdac1) or exposed to MS-275 (an inhibitor of Hdac1, Hdac2, and Hdac3). We also analyzed zebrafish with mutations in sox9b, fbxw7, kdm1a, and notch3. Zebrafish larvae were collected and analyzed by whole-mount immunostaining and in situ hybridization; their liver tissues were collected for quantitative reverse transcription polymerase chain reaction. We studied mice in which hepatocyte-specific deletion of β-catenin (Ctnnb1flox/flox mice injected with Adeno-associated virus serotype 8 [AAV8]-TBG-Cre) induces differentiation of LPCs into hepatocytes after a choline-deficient, ethionine-supplemented (CDE) diet. Liver tissues were collected and analyzed by immunohistochemistry and immunoblots. We performed immunohistochemical analyses of liver tissues from patients with compensated or decompensated cirrhosis or acute on chronic liver failure (n = 15).
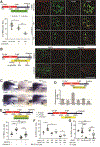
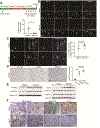
Results: Loss of Hdac1 activity in zebrafish blocked differentiation of LPCs into hepatocytes by increasing levels of sox9b mRNA and reduced differentiation of LPCs into BECs by increasing levels of cdk8 mRNA, which encodes a negative regulator gene of Notch signaling. We identified Notch3 as the receptor that regulates differentiation of LPCs into BECs. Loss of activity of Kdm1a, a lysine demethylase that forms repressive complexes with Hdac1, produced the same defects in differentiation of LPCs into hepatocytes and BECs as observed in zebrafish with loss of Hdac1 activity. Administration of MS-275 to mice with hepatocyte-specific loss of β-catenin impaired differentiation of LPCs into hepatocytes after the CDE diet. HDAC1 was expressed in reactive ducts and hepatocyte buds of liver tissues from patients with cirrhosis.
Conclusions: Hdac1 regulates differentiation of LPCs into hepatocytes via Sox9b and differentiation of LPCs into BECs via Cdk8, Fbxw7, and Notch3 in zebrafish with severe hepatocyte loss. HDAC1 activity was also required for differentiation of LPCs into hepatocytes in mice with liver injury after the CDE diet. These pathways might be manipulated to induce LPC differentiation for treatment of patients with advanced liver diseases.
Keywords: CDE Diet; Development; Hepatic; Signal Transduction.
Copyright © 2019 AGA Institute. Published by Elsevier Inc. All rights reserved.
Conflict of interest statement
Figures


Similar articles
-
Hepatocyte-Specific β-Catenin Deletion During Severe Liver Injury Provokes Cholangiocytes to Differentiate Into Hepatocytes.Hepatology. 2019 Feb;69(2):742-759. doi: 10.1002/hep.30270. Epub 2019 Jan 4. Hepatology. 2019. PMID: 30215850 Free PMC article.
-
Notch Inhibition Promotes Differentiation of Liver Progenitor Cells into Hepatocytes via sox9b Repression in Zebrafish.Stem Cells Int. 2019 Mar 12;2019:8451282. doi: 10.1155/2019/8451282. eCollection 2019. Stem Cells Int. 2019. PMID: 30992706 Free PMC article.
-
Attenuating the Epidermal Growth Factor Receptor-Extracellular Signal-Regulated Kinase-Sex-Determining Region Y-Box 9 Axis Promotes Liver Progenitor Cell-Mediated Liver Regeneration in Zebrafish.Hepatology. 2021 Apr;73(4):1494-1508. doi: 10.1002/hep.31437. Hepatology. 2021. PMID: 32602149 Free PMC article.
-
Liver progenitor cells-mediated liver regeneration in liver cirrhosis.Hepatol Int. 2016 May;10(3):440-7. doi: 10.1007/s12072-015-9693-2. Epub 2016 Jan 7. Hepatol Int. 2016. PMID: 26742763 Review.
-
Liver progenitor cell-driven liver regeneration.Exp Mol Med. 2020 Aug;52(8):1230-1238. doi: 10.1038/s12276-020-0483-0. Epub 2020 Aug 14. Exp Mol Med. 2020. PMID: 32796957 Free PMC article. Review.
Cited by
-
Exposure to valproic acid (VPA) reproduces hdac1 loss of function phenotypes in zebrafish.MicroPubl Biol. 2023 Sep 26;2023:10.17912/micropub.biology.000908. doi: 10.17912/micropub.biology.000908. eCollection 2023. MicroPubl Biol. 2023. PMID: 37829572 Free PMC article.
-
The FBXW7-NOTCH interactome: A ubiquitin proteasomal system-induced crosstalk modulating oncogenic transformation in human tissues.Cancer Rep (Hoboken). 2021 Aug;4(4):e1369. doi: 10.1002/cnr2.1369. Epub 2021 Apr 6. Cancer Rep (Hoboken). 2021. PMID: 33822486 Free PMC article. Review.
-
Epigenetic Regulation of Organ Regeneration in Zebrafish.J Cardiovasc Dev Dis. 2018 Dec 14;5(4):57. doi: 10.3390/jcdd5040057. J Cardiovasc Dev Dis. 2018. PMID: 30558240 Free PMC article. Review.
-
Liver Progenitors and Adult Cell Plasticity in Hepatic Injury and Repair: Knowns and Unknowns.Annu Rev Pathol. 2020 Jan 24;15:23-50. doi: 10.1146/annurev-pathmechdis-012419-032824. Epub 2019 Aug 9. Annu Rev Pathol. 2020. PMID: 31399003 Free PMC article. Review.
-
MiR-126 Regulates Properties of SOX9+ Liver Progenitor Cells during Liver Repair by Targeting Hoxb6.Stem Cell Reports. 2020 Sep 8;15(3):706-720. doi: 10.1016/j.stemcr.2020.07.005. Epub 2020 Aug 6. Stem Cell Reports. 2020. PMID: 32763157 Free PMC article.
References
-
- Miyajima A, Tanaka M, Itoh T. Stem/Progenitor Cells in Liver Development, Homeostasis, Regeneration, and Reprogramming. Cell Stem Cell 2014;14:561–574. - PubMed
-
- Lukacs-Kornek V, Lammert F. The progenitor cell dilemma: Cellular and functional heterogeneity in assistance or escalation of liver injury. J Hepatol 2017. - PubMed
Publication types
MeSH terms
Substances
Grants and funding
LinkOut - more resources
Full Text Sources
Other Literature Sources
Medical
Molecular Biology Databases
Miscellaneous

