. 2019 Jan 1:184:801-812.
doi: 10.1016/j.neuroimage.2018.09.073. Epub 2018 Sep 26.

Automated quality control for within and between studies diffusion MRI data using a non-parametric framework for movement and distortion correction

Affiliations

Automated quality control for within and between studies diffusion MRI data using a non-parametric framework for movement and distortion correction

Matteo Bastiani et al. Neuroimage. .

Abstract

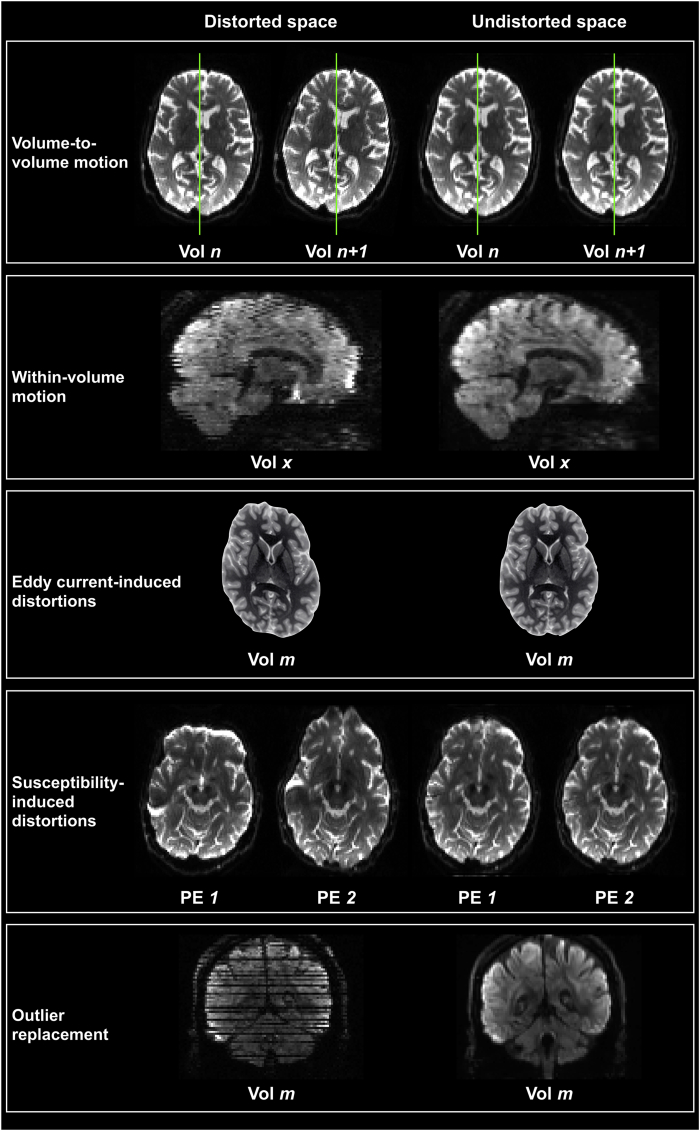
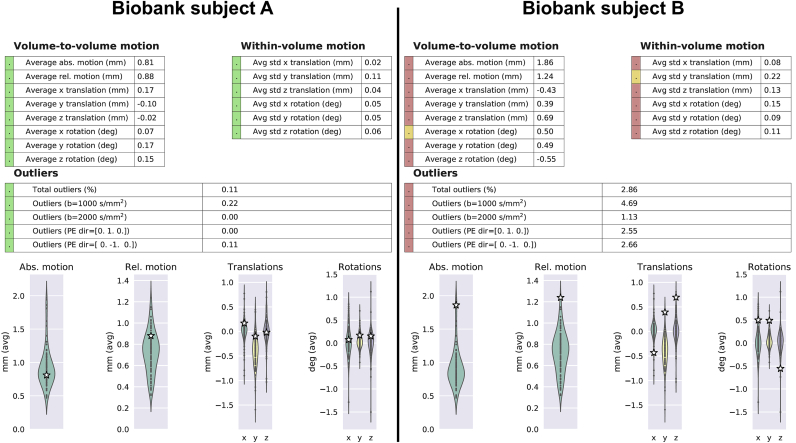
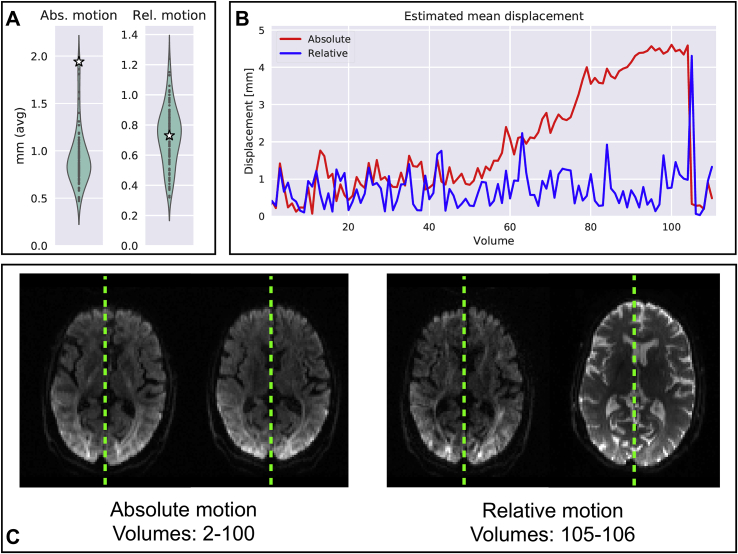
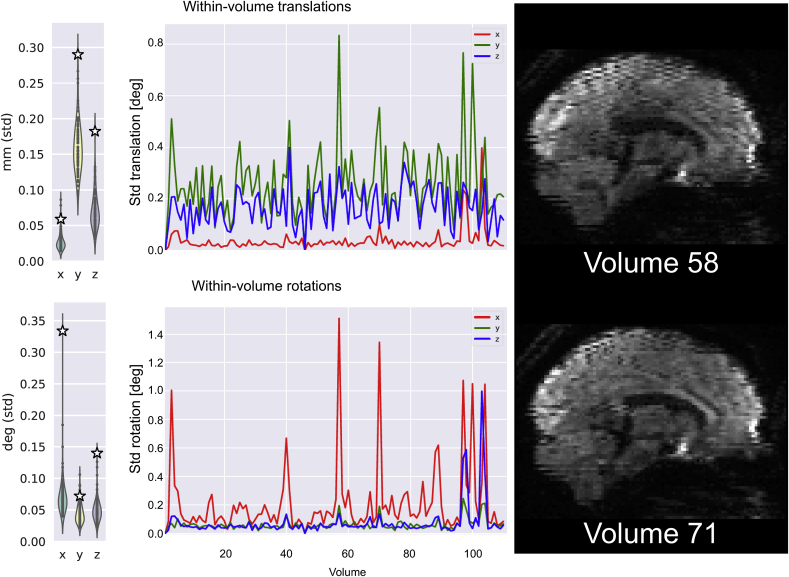
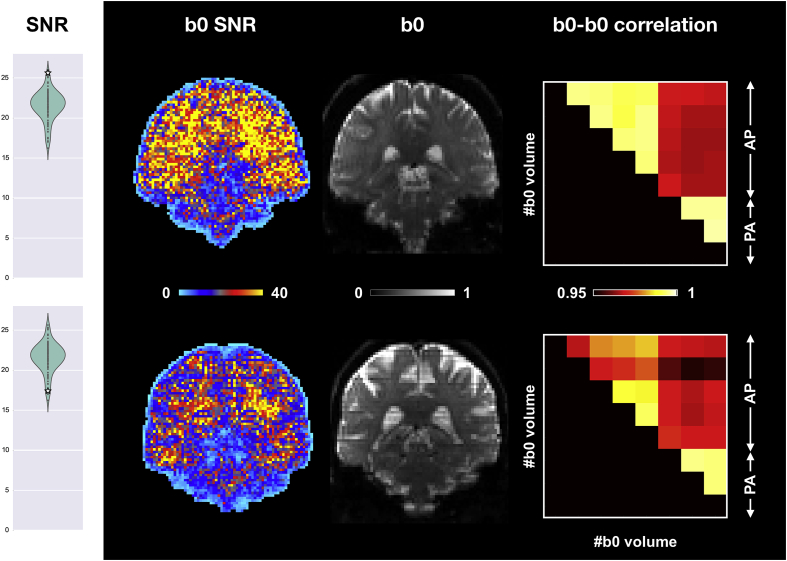
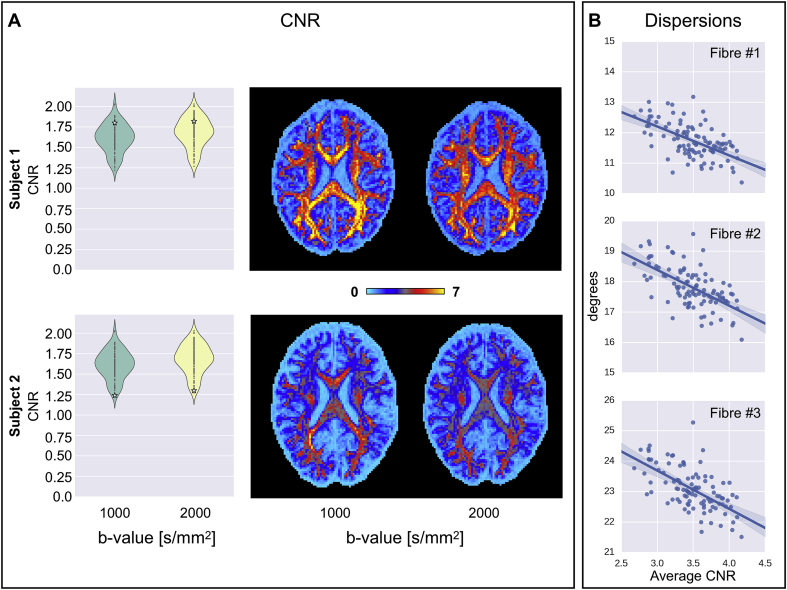
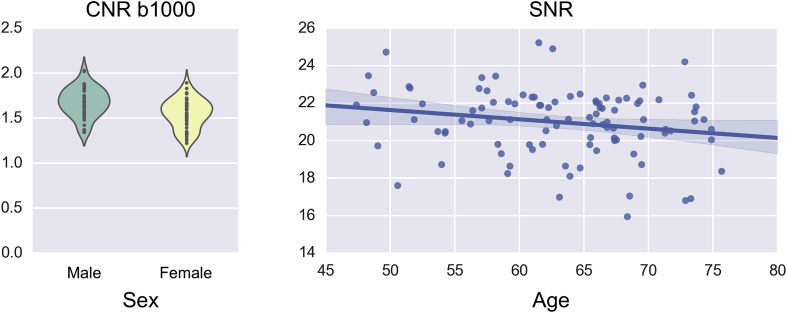
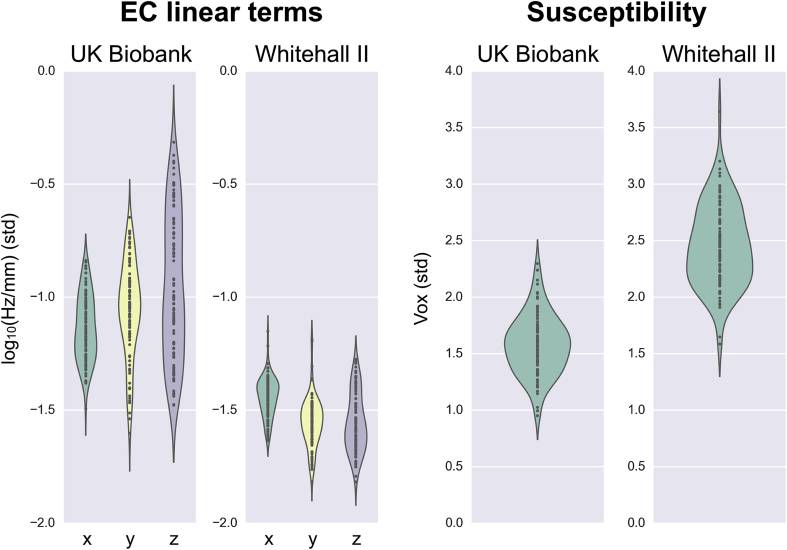
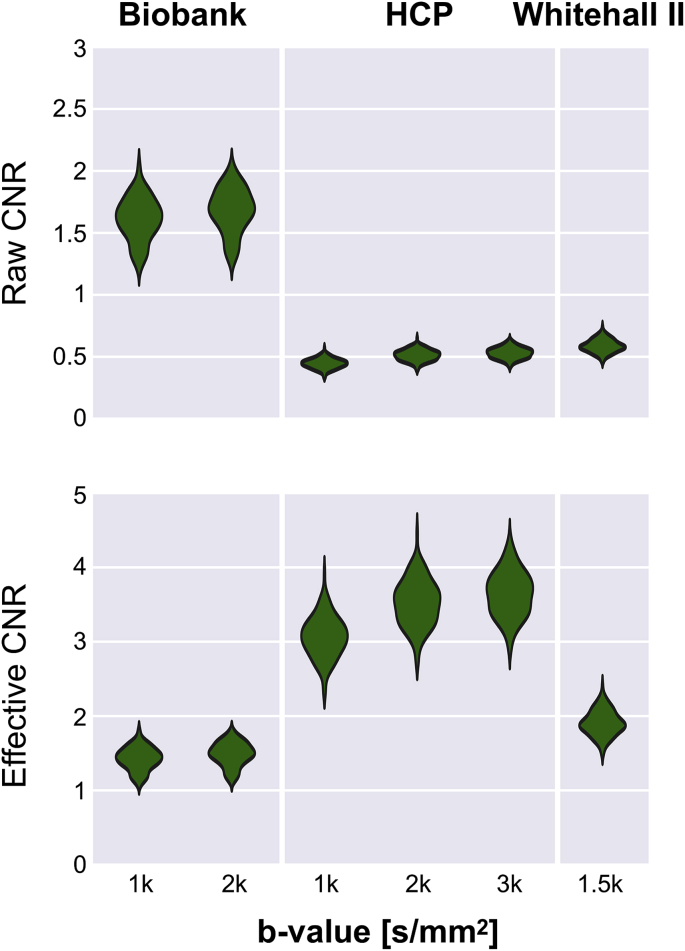
Diffusion MRI data can be affected by hardware and subject-related artefacts that can adversely affect downstream analyses. Therefore, automated quality control (QC) is of great importance, especially in large population studies where visual QC is not practical. In this work, we introduce an automated diffusion MRI QC framework for single subject and group studies. The QC is based on a comprehensive, non-parametric approach for movement and distortion correction: FSL EDDY, which allows us to extract a rich set of QC metrics that are both sensitive and specific to different types of artefacts. Two different tools are presented: QUAD (QUality Assessment for DMRI), for single subject QC and SQUAD (Study-wise QUality Assessment for DMRI), which is designed to enable group QC and facilitate cross-studies harmonisation efforts.

Keywords: Diffusion MRI; Eddy current; Movement; Quality control; Susceptibility.


Figures

Fig. 1
Fig. 1
Overview of the EDDY framework for distortions and motion correction. Raw data in distorted space are brought to artefact-free undistorted space. Motion parameters are estimated and used to correct both between and within volumes displacement. Both eddy currents and susceptibility-induced off resonance fields are used to correct for geometric distortions. Using a Gaussian process to describe the 4D data, outlier slices (i.e., slices affected by severe signal dropout) are detected and replaced with their predictions. To illustrate the effects of eddy currents-induced distortions, T2 weighted images have been manually skewed.
Fig. 2
Fig. 2
Example summary tables from two single subject reports generated using QUAD. Top row: individual QC metrics are flagged as outliers by SQUAD based on their within-study distributions. The traffic light colouring scheme indicates that QC metric is less than a standard deviation away from the mean (green), between one and two standard deviations (yellow) or more than two standard deviations away (red). Bottom row: example distributions (across subjects) of the between volumes motion parameters are shown using violin plots. The individual subject corresponding to this report is marked with a white star.
Fig. 3
Fig. 3
Single UK Biobank subject with high degree of estimated between-volumes motion. A) In the updated single subject report, the estimated mean displacements (absolute and relative) are plotted against the study-wise distributions. B) From the displacement time-courses visualised in the single subject report, the volumes where the subject has moved the most can easily be extracted and compared. C) Example axial slices prior to correction (not present in the single subject report) from four volumes are provided in the bottom row, where the displacements due to severe absolute and relative motion are visible. Green lines are put as reference to the brain's midline.
Fig. 4
Fig. 4
Single subject with high degree of estimated within-volume motion. This subject's mean standard deviation of the estimated motion parameters (3 translations and 3 rotations) are plotted against their study-wise distributions in the updated single subject report. From the parameters' time-courses shown in the single subject report, two example volumes where the subject has moved the most can easily be extracted and inspected. The two sagittal views prior to correction (not present in the single subject report) show that consecutive slices are misaligned in the distorted, i.e., uncorrected original dataset.
Fig. 5
Fig. 5
Assessing frequency and distribution of signal dropout outliers. In the single subject report, volume-wise percentage of detected outlier slices is plotted on top of a heatmap showing the number of standard deviations away from the mean slice difference. Axial and sagittal views (not present in the single subject report) show an example volume (no. 78) before (top row) and after (bottom row) outlier detection and replacement.
Fig. 6
Fig. 6
Comparison of two UK Biobank subjects based on their b0 SNR. Average SNR values (white stars overlaid on violin plots) and maps show clear differences between the two subjects. A further between-volumes correlation analysis reveals residual issues after pre-processing of the second subject (bottom row). Coronal sections of the second b0 volume show spin-history effects for the second subject. Coronal sections and correlation matrices are not shown in the QC reports. For the correlation matrices, AP (Anterior->Posterior) and PA (Posterior->Anterior) refer to the two phase encoding directions used for data acquisition.
Fig. 7
Fig. 7
A) Comparison of two UK Biobank subjects based on their diffusion CNR. Average CNR values (white stars overlaid on violin plots) and axial slices show clear differences between the two subjects. B) A further regression analysis highlights the dependency of estimated white matter fibre dispersion on CNR for 100 UK Biobank subjects. Average white matter CNR accounts for both the b1000 and b2000 shell CNR. Fibre dispersion is reported in degrees. Each point on the scatterplots represents a single UK Biobank subject.
Fig. 8
Fig. 8
Differences in quality indices using categorical and continuous variables. Left panel shows differences in the distributions of the average CNR for the b1000 shell between females and males. Right panel shows the average SNR plotted against age. Both panels use the 100 analysed UK Biobank subjects.
Fig. 9
Fig. 9
Comparison between amounts of induced distortions by eddy currents and differences in susceptibility in the UK Biobank and Whitehall II imaging studies. Different scanning sites and protocols yields differences in the amount of distortions. All violin plots are added into the group report generated by SQUAD. Axes were rescaled in this figure.
Fig. 10
Fig. 10
Raw and effective b-shell average CNR distributions for all the three studies. CNR values were averaged within a binary brain mask for each subject. Violin plots show the smoothed histograms from 100 subjects for each study. After rescaling to account for number of acquired volumes for each b-shell and voxel size, effective CNR leads to more comparable results across the different studies.

References

    1. Alfaro-Almagro F., Jenkinson M., Bangerter N.K., Andersson J.L.R., Griffanti L., Douaud G., Sotiropoulos S.N., Jbabdi S., Hernandez-Fernandez M., Vallee E., Vidaurre D., Webster M., McCarthy P., Rorden C., Daducci A., Alexander D.C., Zhang H., Dragonu I., Matthews P.M., Miller K.L., Smith S.M. Image processing and Quality Control for the first 10,000 brain imaging datasets from UK Biobank. Neuroimage. 2017;166:400–424. - PMC - PubMed
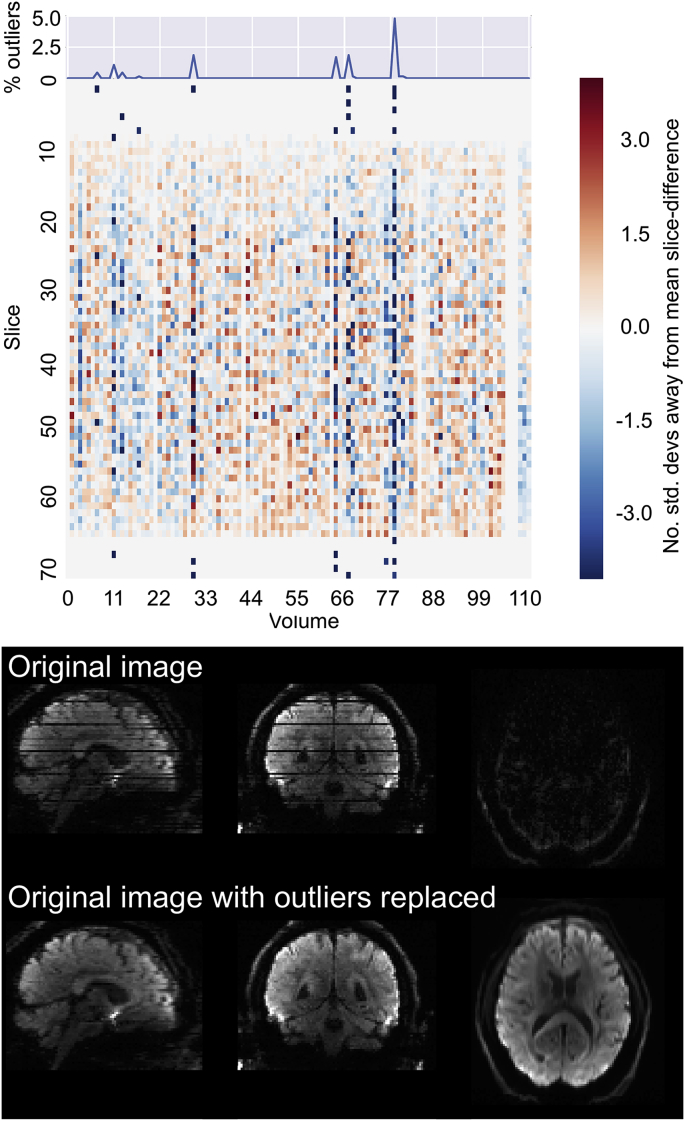
    1. Andersson J.L., Graham M.S., Zsoldos E., Sotiropoulos S.N. Incorporating outlier detection and replacement into a non-parametric framework for movement and distortion correction of diffusion MR images. Neuroimage. 2016;141:556–572. - PubMed
    1. Andersson J.L., Skare S., Ashburner J. How to correct susceptibility distortions in spin-echo echo-planar images: application to diffusion tensor imaging. Neuroimage. 2003;20:870–888. - PubMed
    1. Andersson J.L., Sotiropoulos S.N. Non-parametric representation and prediction of single- and multi-shell diffusion-weighted MRI data using Gaussian processes. Neuroimage. 2015;122:166–176. - PMC - PubMed
    1. Andersson J.L., Sotiropoulos S.N. An integrated approach to correction for off-resonance effects and subject movement in diffusion MR imaging. Neuroimage. 2016;125:1063–1078. - PMC - PubMed

Publication types

LinkOut - more resources