

Spatial variation of modelled total, dry and wet nitrogen deposition to forests at global scale
- PMID: 30267923
- PMCID: PMC7050289
- DOI: 10.1016/j.envpol.2018.09.084
Spatial variation of modelled total, dry and wet nitrogen deposition to forests at global scale
Abstract
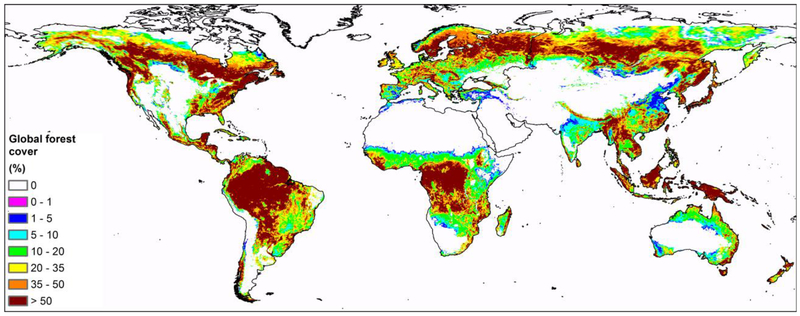
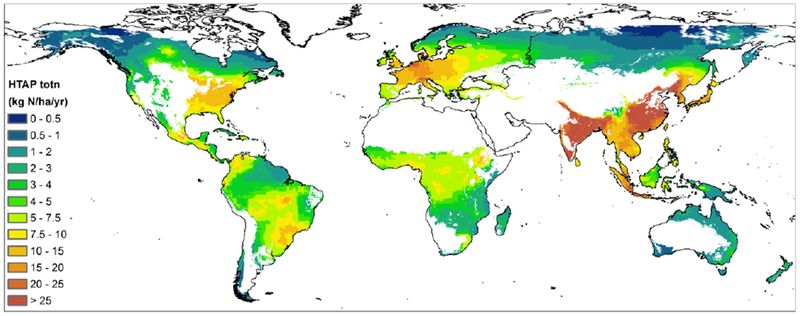
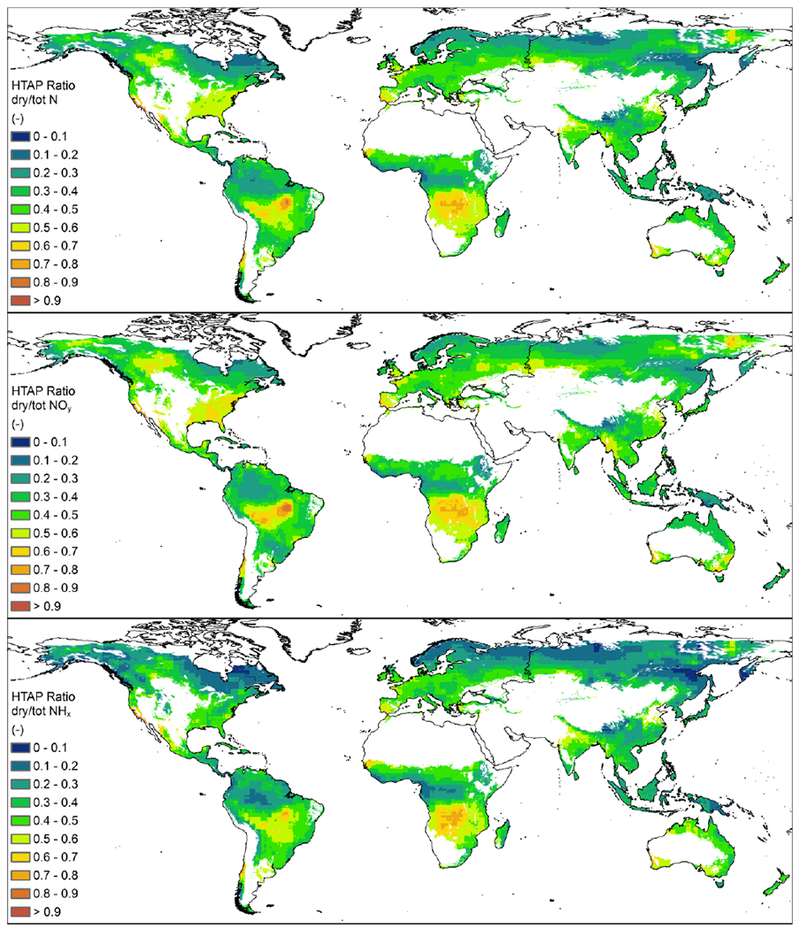
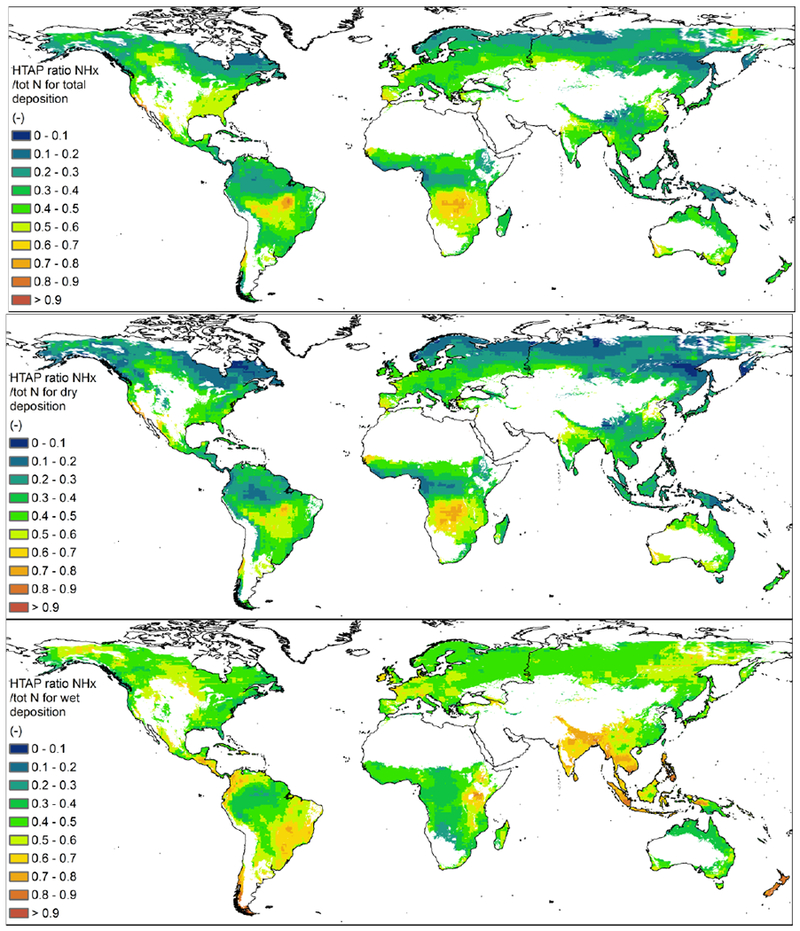
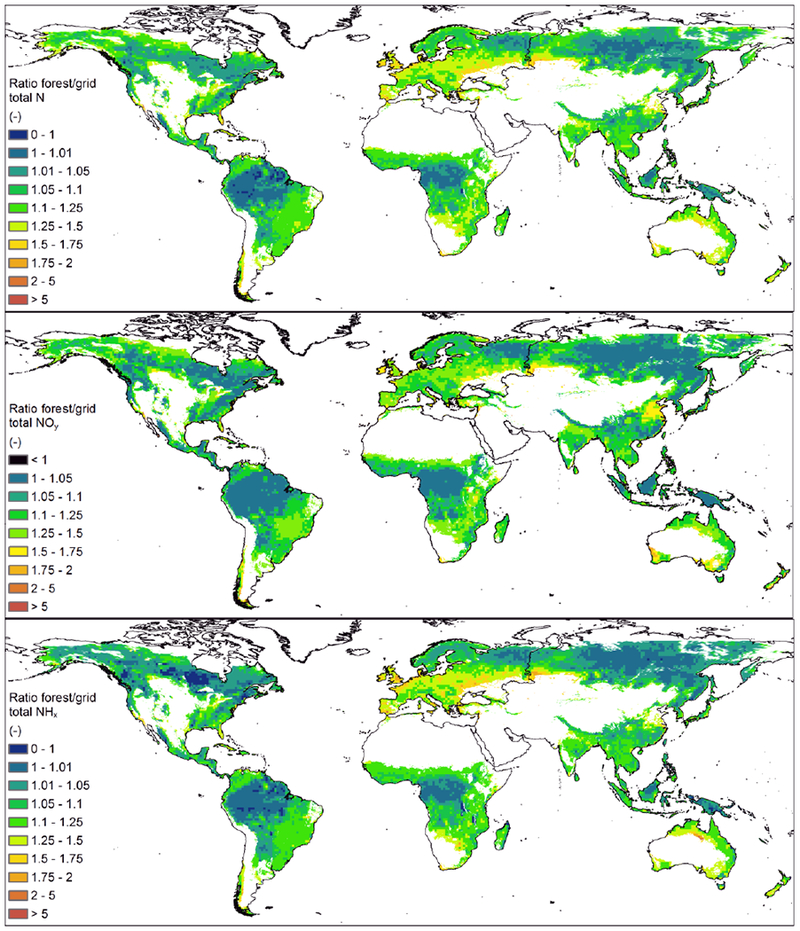
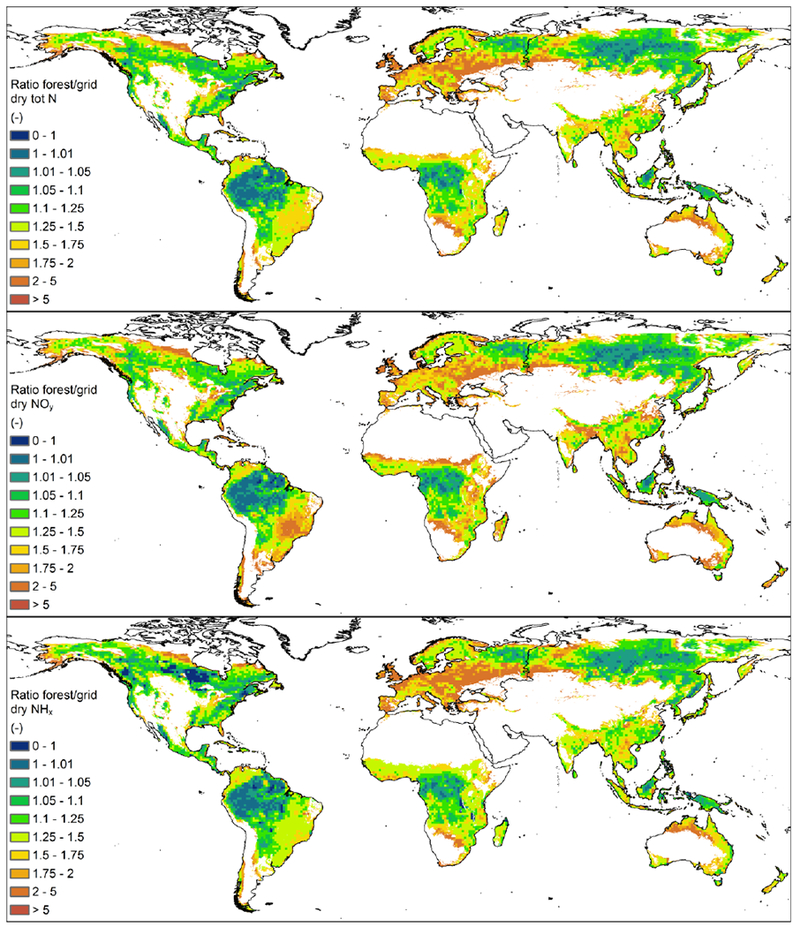
Forests are an important biome that covers about one third of the global land surface and provides important ecosystem services. Since atmospheric deposition of nitrogen (N) can have both beneficial and deleterious effects, it is important to quantify the amount of N deposition to forest ecosystems. Measurements of N deposition to the numerous forest biomes across the globe are scarce, so chemical transport models are often used to provide estimates of atmospheric N inputs to these ecosystems. We provide an overview of approaches used to calculate N deposition in commonly used chemical transport models. The Task Force on Hemispheric Transport of Air Pollution (HTAP2) study intercompared N deposition values from a number of global chemical transport models. Using a multi-model mean calculated from the HTAP2 deposition values, we map N deposition to global forests to examine spatial variations in total, dry and wet deposition. Highest total N deposition occurs in eastern and southern China, Japan, Eastern U.S. and Europe while the highest dry deposition occurs in tropical forests. The European Monitoring and Evaluation Program (EMEP) model predicts grid-average deposition, but also produces deposition by land use type allowing us to compare deposition specifically to forests with the grid-average value. We found that, for this study, differences between the grid-average and forest specific could be as much as a factor of two and up to more than a factor of five in extreme cases. This suggests that consideration should be given to using forest-specific deposition for input to ecosystem assessments such as critical loads determinations.
Keywords: Dry deposition; Forest biomes; Modelling approach; Nitrogen deposition; Wet deposition.
Published by Elsevier Ltd.
Figures
References
-
- Aber J, McDowell W, Nadelhoffer K, Magill A, Berntson G, Kamakea M, McNulty S, Currie W, Rustad L, Fernandez I, 1998. Nitrogen saturation in temperate forest ecosystems: Hypotheses revisited. BioScience 48, 921–934.
-
- Appel KW, Napelenok SL, Foley KM, Pye HOT, Hogrefe C, Luecken DJ, Bash JO, Roselle SJ, Pleim JE, Foroutan H, Hutzell WT, Pouliot GA, Sarwar G, Fahey KM, Gantt B, Gilliam RC, Heath NK, Kang D, Mathur R, Schwede DB, Spero TL, Wong DC, Young JO, 2017. Description and evaluation of the Community Multiscale Air Quality (CMAQ) modeling system version 5.1. Geosci. Model Dev. 10, 1703–1732. - PMC - PubMed
-
- Bash JO, Cooter EJ, Dennis RL, Walker JT, Pleim JE, 2013. Evaluation of a regional air-quality model with bidirectional NH3 exchange coupled to an agroecosystem model Biogeosciences 10, 1635–1645
-
- Bey I, Jacob DJ, Yantosca RM, Logan JA, Field B, Fiore AM, Li Q, Liu H, Mickley LJ, Schultz M, 2001. Global modeling of tropospheric chemistry with assimilated meteorology: Model description and evaluation, J. Geophys. Res 106, 23,073–23,096.
-
- Bowman WD, Cleveland CC, Halada L, Hresko J, Baron J, 2008. Negative impact of nitrogen deposition on soil buffering capacity. Nat. Geosci 1, 767–770.
MeSH terms
Substances
Grants and funding
LinkOut - more resources
Full Text Sources
Other Literature Sources
Medical
