

Agreement test of transcutaneous bilirubin and bilistick with serum bilirubin in preterm infants receiving phototherapy
- PMID: 30268107
- PMCID: PMC6162930
- DOI: 10.1186/s12887-018-1290-9
Agreement test of transcutaneous bilirubin and bilistick with serum bilirubin in preterm infants receiving phototherapy
Abstract
Background: This study compares the minimally invasive Bilistick and a noninvasive method with standard Total Serum Bilirubin (TSB) measurement in preterm newborns receiving phototherapy. We assess the agreement of Transcutaneous Bilirubinometer (TcB) and Bilistick bilirubin measurements with standard TSB measurement in preterm infants receiving phototherapy.
Methods: Bilirubin was measured by using TcB and Bilistick in 94 preterm infants in RSCM Jakarta Neonatal Ward from October 2016 to March 2017, with gestational ages of < 35 weeks, before phototherapy and after 24 and 48 h of phototherapy.
Results: There was significant correlation before, at 24 and 48 h of phototherapy between TSB and either TcB (r = 0.874; r = 0.889; r = 0.878 respectively; p < 0.0001), or Bilistick (r = 0.868; r = 0.877; r = 0.918 respectively; p < 0.0001). The mean difference and limits of agreement before, at 24 and 48 h of phototherapy between TcB and TSB were 0.81 ± 1.51 mg/dL (- 2.14 to 3.77 mg/dL); 0.43 ± 1.57 mg/dL (- 2.66 to 3.51 mg/dL); 0.41 ± 1.58 mg/dL (- 2.69 to 3.50 mg/dL), respectively. For Bilistick they were - 1.50 ± 1.47 mg/dL (- 4.38 to 1.38 mg/dL); - 1.43 ± 1.47 mg/dL (- 4.32 to 1.46 mg/dL); - 1,15 ± 1.31 mg/dL (- 3,72 to 1,42 mg/dL), respectively.
Conclusions: Both methods are reliable for measuring TSB before, during, and after phototherapy in preterm infants. TcB tends to overestimate while Bilistick underestimates TSB.
Keywords: Bilistick; Indonesia; Phototherapy; Preterm infants; Transcutaneous bilirubin.
Conflict of interest statement
Ethics approval and consent to participate
All authors hereby declare that all experiments have been examined and approved by the Ethics Committee of the Faculty of Medicine, Universitas Indonesia (No 783/UN2.F1/ETIK/2016) and have therefore been performed in accordance with the ethical standards laid down in the 1964 Declaration of Helsinki. A written informed consent was provided by the parents of the children involved in the study.
Consent for publication
Not applicable.
Competing interests
The authors declare that they have no competing interests.
Publisher’s Note
Springer Nature remains neutral with regard to jurisdictional claims in published maps and institutional affiliations.
Figures
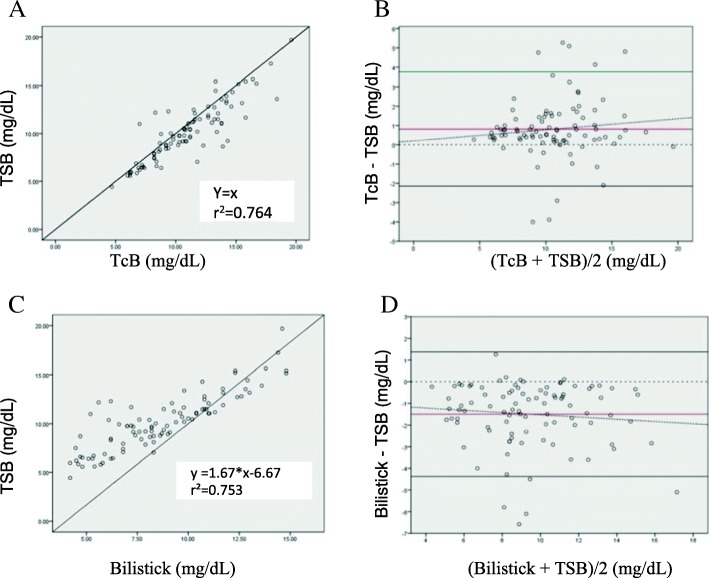
 ) = average difference (
 ) = agreement limit (
 ) = tendency of average difference (
 ) = 0 point, standard to observe distance with red line
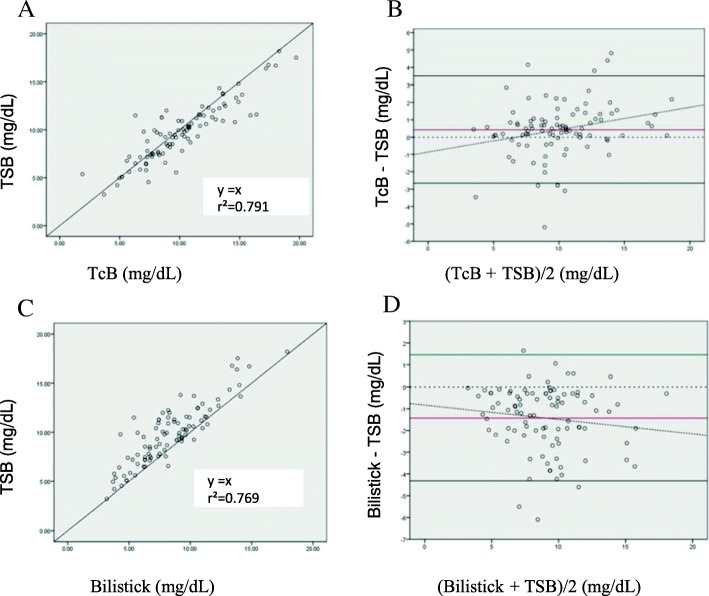
 ) = average difference (
 ) = agreement limit (
 ) = tendency of average difference (
 ) = 0 point, standard to observe distance with red line
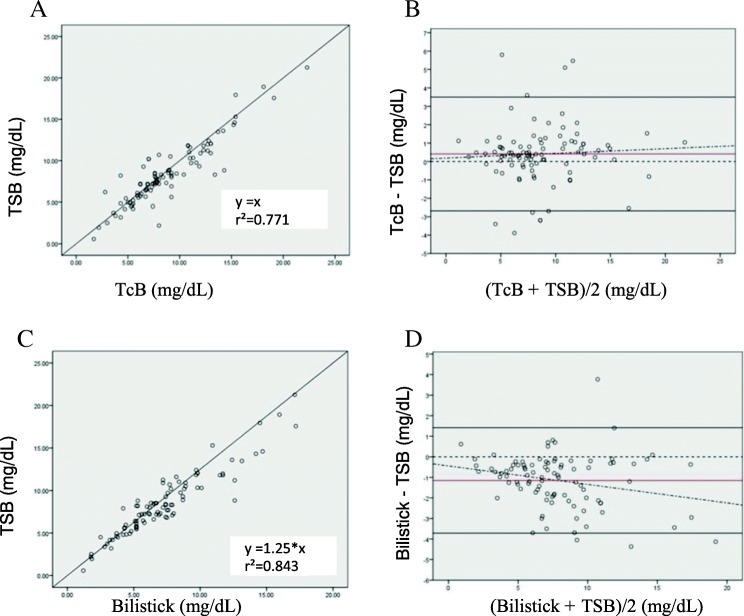
 ) = average difference (
 ) = agreement limit (
 ) = tendency of average difference (
 ) = 0 point, standard to observe distance with red line
References
-
- Kliegman RM, Behrman RE, Jenson HB, Stanton BM. Nelson textbook of pediatrics e-book: Elsevier. Health Sciences; 2007.
-
- Martin RJ, Fanaroff AA, Walsh MC. Fanaroff and Martin’s neonatal-perinatal medicine E-book: diseases of the fetus and infant. 2010.
-
- Slim G, Naous A, Naja Z, Naja AS, Rajab M. Effect of Instituting a Hospital Pre-discharge Bilirubin Screening on Subsequent Significant Hyperbilirubinemia in Term and Near Term Newborn. 2015.
MeSH terms
Substances
LinkOut - more resources
Full Text Sources
Medical
