
A Pan-Cancer Analysis Reveals High-Frequency Genetic Alterations in Mediators of Signaling by the TGF-β Superfamily

Anil Korkut et al. Cell Syst. .

Abstract

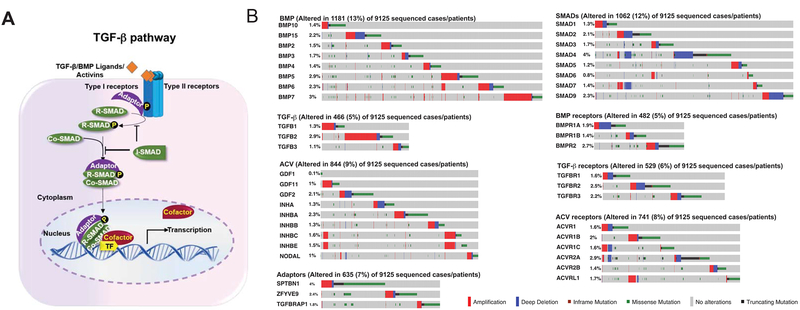
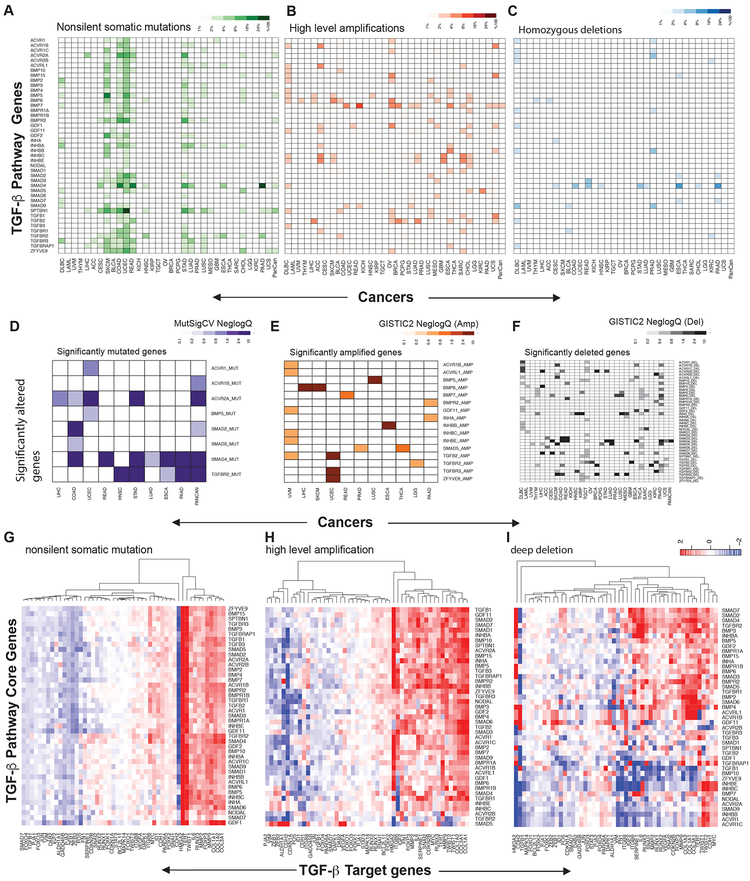
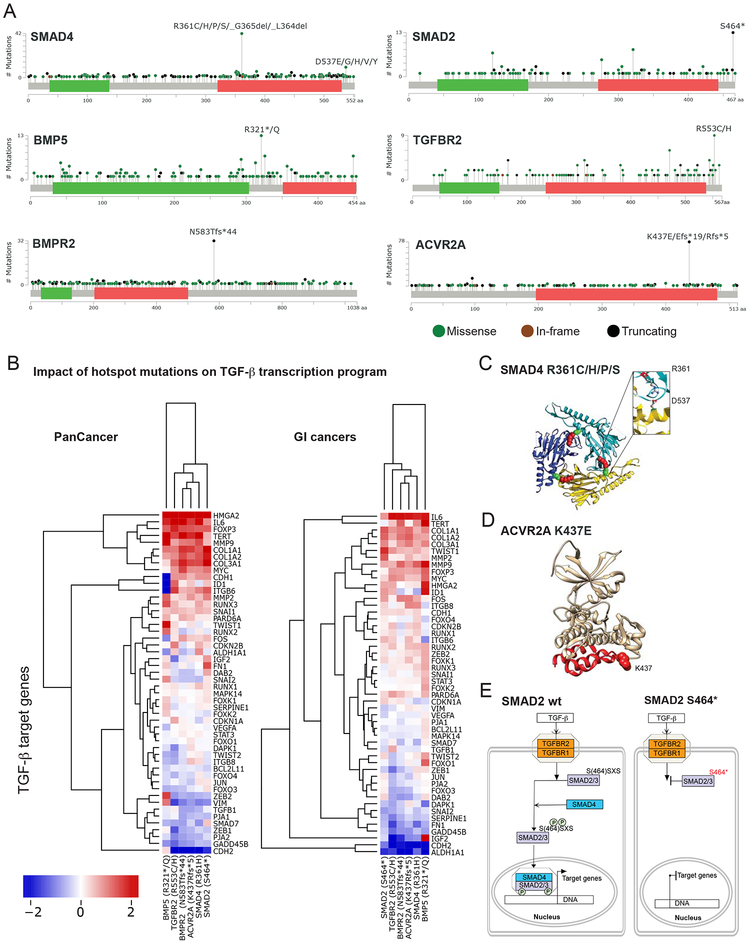
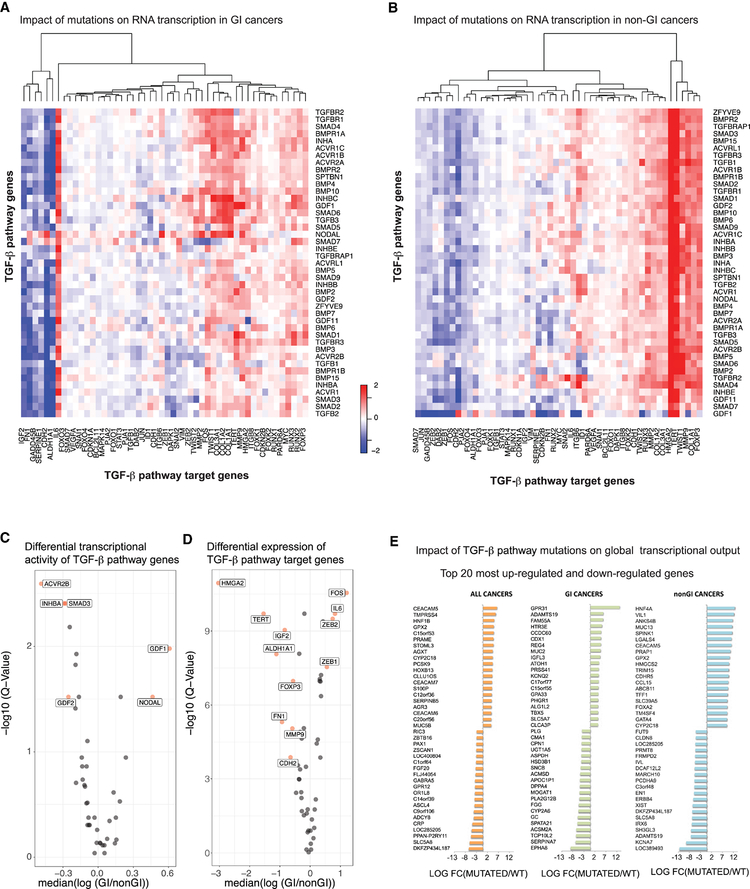
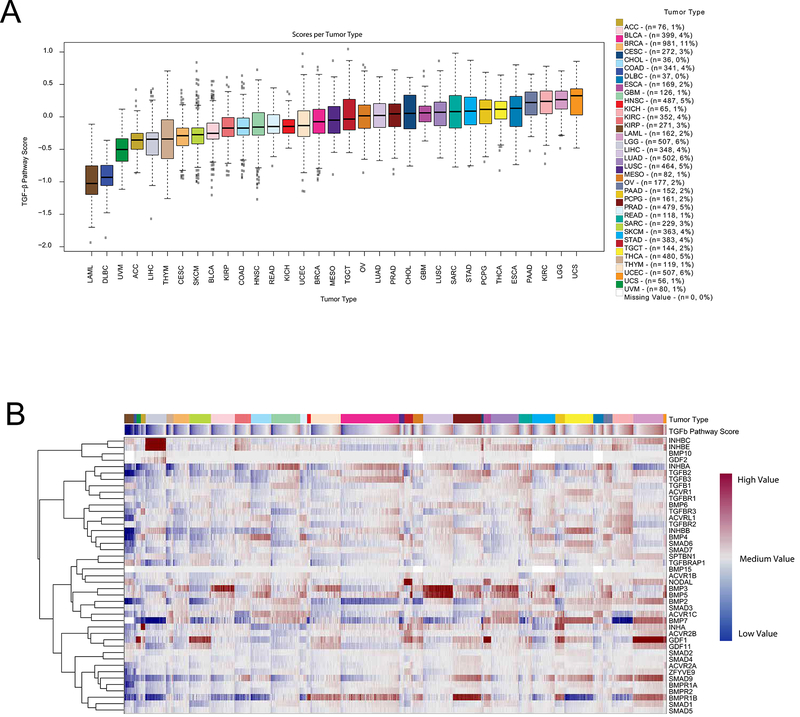
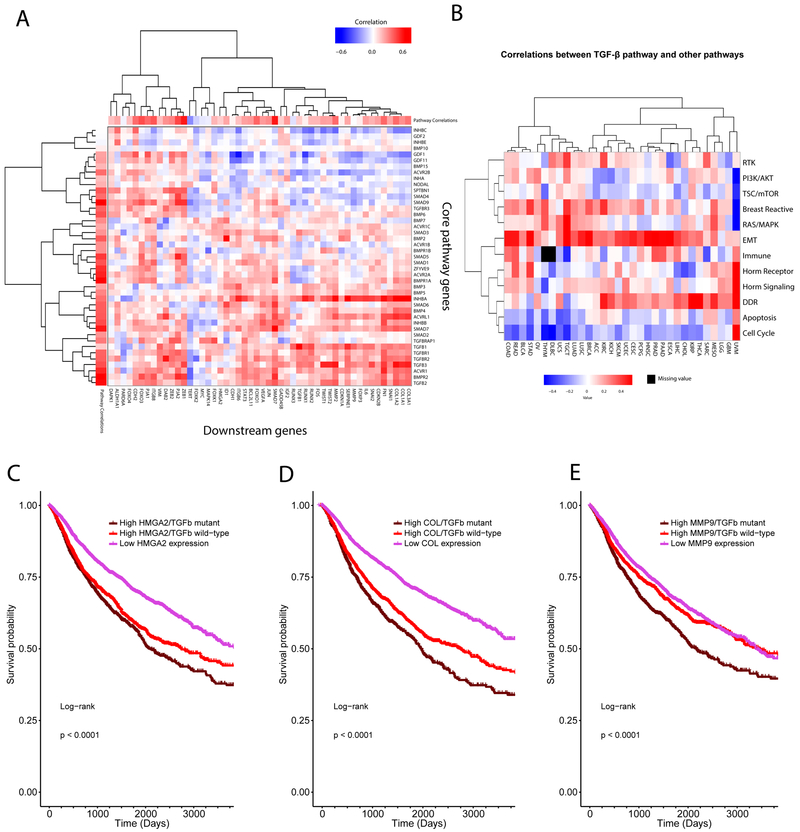
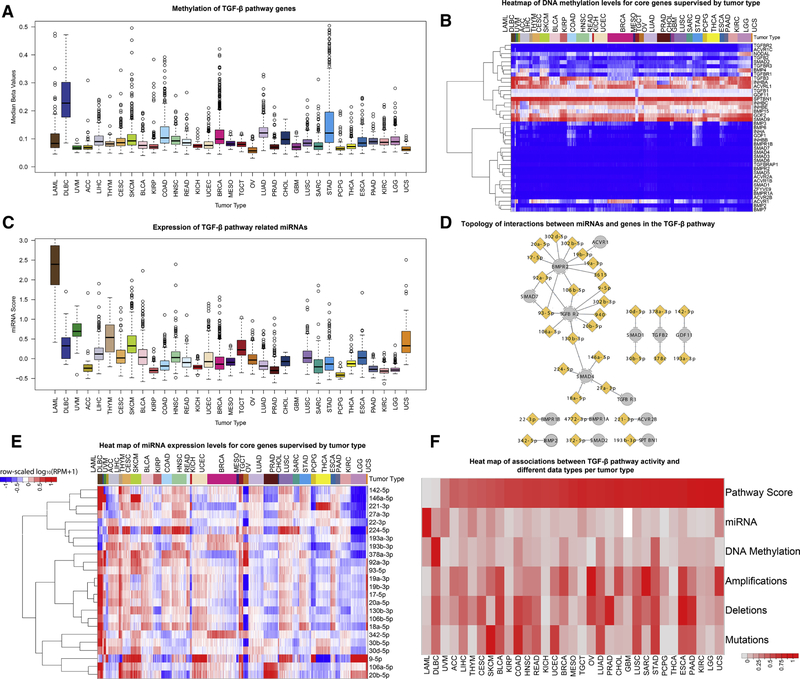
We present an integromic analysis of gene alterations that modulate transforming growth factor β (TGF-β)-Smad-mediated signaling in 9,125 tumor samples across 33 cancer types in The Cancer Genome Atlas (TCGA). Focusing on genes that encode mediators and regulators of TGF-β signaling, we found at least one genomic alteration (mutation, homozygous deletion, or amplification) in 39% of samples, with highest frequencies in gastrointestinal cancers. We identified mutation hotspots in genes that encode TGF-β ligands (BMP5), receptors (TGFBR2, AVCR2A, and BMPR2), and Smads (SMAD2 and SMAD4). Alterations in the TGF-β superfamily correlated positively with expression of metastasis-associated genes and with decreased survival. Correlation analyses showed the contributions of mutation, amplification, deletion, DNA methylation, and miRNA expression to transcriptional activity of TGF-β signaling in each cancer type. This study provides a broad molecular perspective relevant for future functional and therapeutic studies of the diverse cancer pathways mediated by the TGF-β superfamily.

Keywords: DNA methylation; Pan-Cancer; TCGA; TGF-β; TGF-β pathway; The Cancer Genome Atlas; cancer; microRNA; mutation hotspot; transcription.


Conflict of interest statement

Declaration of Interests

Michael Seiler, Peter G. Smith, Ping Zhu, Silvia Buonamici, and Lihua Yu are employees of H3 Biomedicine. Parts of this work are the subject of a patent application: WO2017040526 titled “Splice variants associated with neomorphic sf3b1 mutants.” Shouyoung Peng, Anant A. Agrawal, James Palacino, and Teng Teng are employees of H3 Biomedicine. Andrew D. Cherniack, Ashton C. Berger, and Galen F. Gao receive research support from Bayer Pharmaceuticals. Gordon B. Mills serves on the External Scientific Review Board of Astrazeneca. Anil Sood is on the Scientific Advisory Board for Kiyatec and is a shareholder in BioPath. Jonathan S. Serody receives funding from Merck. Kyle R. Covington is an employee of Castle Biosciences. Preethi H. Gunaratne is founder, CSO, and shareholder of NextmiRNA Therapeutics. Christina Yau is a part-time employee/consultant at NantOmics. Franz X. Schaub is an employee and shareholder of SEngine Precision Medicine. Carla Grandori is an employee, founder, and shareholder of SEngine Precision Medicine. Robert N. Eisenman is a member of the Scientific Advisory Boards and shareholder of Shenogen Pharma and Kronos Bio. Daniel J. Weisenberger is a consultant for Zymo Research Corporation. Joshua M. Stuart is the founder of Five3 Genomics and shareholder of NantOmics. Marc T. Goodman receives research support from Merck. Andrew J. Gentles is a consultant for Cibermed. Charles M. Perou is an equity stock holder, consultant, and Board of Directors member of BioClassifier and GeneCentric Diagnostics and is also listed as an inventor on patent applications on the Breast PAM50 and Lung Cancer Subtyping assays. Matthew Meyerson receives research support from Bayer Pharmaceuticals; is an equity holder in, consultant for, and Scientific Advisory Board chair for OrigiMed; and is an inventor of a patent for EGFR mutation diagnosis in lung cancer, licensed to LabCorp. Eduard Porta-Pardo is an inventor of a patent for domainXplorer. Han Liang is a shareholder and scientific advisor of Precision Scientific and Eagle Nebula. Da Yang is an inventor on a pending patent application describing the use of antisense oligonucleotides against specific lncRNA sequence as diagnostic and therapeutic tools. Yonghong Xiao was an employee and shareholder of TESARO. Bin Feng is an employee and shareholder of TESARO. Carter Van Waes received research funding for the study of IAP inhibitor ASTX660 through a Cooperative Agreement between NIDCD, NIH, and Astex Pharmaceuticals. Raunaq Malhotra is an employee and shareholder of Seven Bridges. Peter W. Laird serves on the Scientific Advisory Board for AnchorDx. Joel Tepper is a consultant at EMD Serono. Kenneth Wang serves on the Advisory Board for Boston Scientific, Microtech, and Olympus. Andrea Califano is a founder, shareholder, and advisory board member of DarwinHealth. and a shareholder and advisory board member of Tempus. Toni K. Choueiri serves as needed on advisory boards for Bristol-Myers Squibb, Merck, and Roche. Lawrence Kwong receives research support from Array BioPharma. Sharon E. Plon is a member of the Scientific Advisory Board for Baylor Genetics Laboratory. Beth Y. Karlan serves on the Advisory Board of Invitae.

Figures

Figure 1.
Figure 1.
A. The canonical TGF-β pathway. TGF-β superfamily member ligands bind to type II receptors, leading to recruitment and activation of type I receptors through phosphorylation. Subsequently, the activated receptors phosphorylate intracellular Receptor-SMADs (R-SMAD), such as SMAD2 and SMAD3, which bind to the receptor through adaptor molecules. The RSMAD/co-SMAD (SMAD2/3-SMAD4) complex is transported into the nucleus to induce transcriptional programs regulated by the TGF-β superfamily. B. Landscape of genomic aberrations in the TGF-β superfamily genes in cancer. The frequency of alterations in TGF-β superfamily ligands, receptors and receptor-associated proteins, intracellular SMADs, and adaptor molecules are presented. Only samples with genomic alterations in the indicated genes are shown in each oncoprint. Alteration rates per gene and gene family are displayed in the left and top labels, respectively. See also STAR Methods, Figure S1 and Tables S1 and S2.
Figure 2.
Figure 2.. PanCancer genomic analysis of the 43 TGF-β superfamily pathway genes in 33 cancer types.
A-C. Distribution of genomic alterations over cancer types. (A) Non-silent somatic mutations, (B) copy number amplifications, (C) homozygous deletion frequencies. SKCM, UCEC, STAD, and COAD show high overall mutation rates. D-F. Statistical significance of alterations in the TGF-β superfamily pathway genes. Genes that were significantly mutated or targets of copy-number alteration based on MutSigCV results (D) and GISTIC2 (E-F) analyses. Only the genes altered significantly in at least one cancer type are included. G-I. Transcriptional output associated with alterations in the TGF-β superfamily pathway genes. Differential mRNA expression of key genes downstream of the TGF-β superfamily pathways including mutations (G), amplifications (H), and deep deletions (I). See also Figure S2 and Tables S2-S4.
Figure 3.
Figure 3.. Mutational hotspots in the TGF-β superfamily pathways.
A. Recurrent hotspot sites. Hotspots with > 9 incidents are shown. B. Transcriptional output of pathway hotspot mutations in GI and PanCancer cohorts. Differential mRNA expression of 50 TGF-β pathway target genes quantified in relation to 6 hotspot mutations in the PanCancer cohort (left) and GI cancers (right). C. SMAD4 R361C/H/P/S. R361 is located on the SMAD4 homotrimer interaction interface, as shown on the SMAD4 structure (PDB ID: 1DD1). D. ACVR2A K437E. K437 is marked on the structure of the ACVR2A C-terminal kinase domain (PDB ID: 4ASX). E. SMAD2. Position and putative effect of the C-terminal truncation mutation S464* are shown. See also Figure S3.
Figure 4.
Figure 4.. Comparison of TGF-β superfamily pathway activity and gene aberrations.
A. The TGF-β superfamily pathway gene expression signature in GI cancers. Heat map indicating the effects of non-silent somatic mutations in the 43 TGF-β pathway genes on expression of downstream target genes for 1,511 samples of 5 GI cancer types. Color reflects the log ratio of median expression in samples that carry the alteration vs. samples that are wild-type (y-axis). B. The TGF-β superfamily pathway gene expression signature in non-GI cancers. Same analysis as (A) for 7,614 samples of 27 non-GI cancer types. C. Comparison of disrupted TGF-β superfamily pathway activity in GI and other cancers. Volcano plots for 43 TGF-β pathway genes in GI vs. other cancers. Fold changes (x-axis) were calculated from the median log ratio of mRNA expression across 50 downstream target genes (normalized to median levels in samples wild type for the 43 TGF-β pathway genes) associated with mutations in GI vs. other cancers. Red Q-values (y-axis) identify genes with statistically significant changes in GI vs. other cancers. Q-values were calculated by Wilcoxon Signed-Rank test for each pathway gene, followed by Benjamini–Hochberg (BH) FDR adjustment. D. Differential expression of TGF-β superfamily pathway target genes in GI and other cancers. The same as C but for TGF-β pathway target genes. E. Comparison of global transcriptional output. The ratio of TGF-β target gene expression in samples with and without gene alterations. Genes listed include the highest absolute mRNA expression changes (top 20 increases and top 20 decreases) in the presence of alterations of the 43 TGF-β superfamily gene. See also Figure S4.
Figure 5.
Figure 5.. mRNA analysis of TGF-β superfamily pathway genes.
A. TGF-β superfamily pathway activity across PanCancer tumor types. Box plot showing the distribution of sample-specific pathway scores across each cancer type. Scores were computed using mRNA transcript levels of genes in the superfamily. The median, interquartile range, and outliers are indicated. B. Supervised clustering of mRNA expression. mRNA expression values for the 43 genes, clustered from left to right by tumor type, then by TGF-β superfamily pathway score. See also STAR Methods.
Figure 6.
Figure 6.. Correlation of TGF-β superfamily genes with other cancer-related pathways and genes.
A. Clustered heat map of pairwise correlations between TGF-β pathway gene expression and that of 50 downstream target genes. Unsupervised hierarchical clustering was conducted with 1-Pearson’s correlation distance metric and Ward’s linkage. The covariate bar on each axis shows median expression values. B. Clustered heat map of correlations between TGF-β pathway activity score and 12 other cancer-associated pathways. Oncogenic pathway activity scores (y-axis) were computed from protein data, except for EMT (mRNA) and immune scores (DNA methylation). C. Impact of TGF-β pathway-associated HMGA2 mRNA expression on patient survival. 10-year survival of patients with TGF-β pathway mutations (TGF-β mutant) and high HMGA2 expression (High HMGA2), no mutations in the TGF-β pathway genes (TGF-β wild-type) and high HMGA2 expression, and low HMGA2 expression (regardless of mutation status of 43 genes) was compared in a Kaplan Meier analysis. Statistical significance was assessed by log-rank test (see STAR Methods and figure S6 for selection of high and low expression level thresholds) D. Impact of collagen-encoding gene (COL1A1, COL1A2, COL3A1) mRNA expression on patient survival. The same analysis as in (C) was performed for aggregated mRNA expression of three collagen genes that showed increased expression in cancers with TGF-β pathway gene mutations. E. Impact of MMP9 mRNA expression on patient survival. The same analysis as in (C) was performed for the impact of MMP9 expression on patient survival by comparing high MMP9/TGF-β pathway mutations, high MMP9/wild-type TGF-β pathway, and low MMP9. See also Figures S5 and S6 and Table S6.
Figure 7.
Figure 7.. Epigenetic control of the TGF-β superfamily pathways.
A. Methylation levels. Boxes quantify the degree of methylation across the 43 TGF-β genes in a given tumor type. The methylation score is calculated from the median for each gene in a given sample. Scores are grouped by tumor type. B. Supervised cluster analysis of methylation patterns. Methylation patterns were clustered as in Figure 6A. Methylation levels were quantified as M-values by first mapping methylation array probes to individual genes. A median beta value for each gene was then calculated as the median beta value across all samples for a given cancer type. C. microRNA levels. Box plot showing the mean miRNA expression levels for the 32 miRNAs that regulate the indicated genes in the TGF-β superfamily pathways. D. microRNA regulation. Inferred miR-mRNA targeting for 15 TGF-β superfamily pathway genes by the 32 miRNAs. E. Abundance of miRNAs predicted to target the TGF-β superfamily pathway genes. The heat map illustrates miRNA abundance for 8,930 tumor samples from 32 of the 33 TCGA tumors (GBM excluded, no miRNA data in TCGA). F. Contribution of data type to TGF-β superfamily pathways score. Tumor types (columns) ordered from lowest (left) to highest (right) TGF-β superfamily pathway score. Mean miRNA expression levels normalized between 0 and 1 yielded the highest overall correlation with pathway score (R = −0.68). Mean DNA methylation beta values normalized between 0 and 1 had the next highest correlation (R = −0.46). Amplifications (R = 0.24), deletions (R = 0.09), and mutations (R = −0.05) represent proportions of samples with the given type of aberration in at least one of the 43 TGF-β genes. See also Figure S7 and Tables S5-S7

References

    1. Akbani R, Ng PK, Werner HM, Shahmoradgoli M, Zhang F, Ju Z, Liu W, Yang JY, Yoshihara K, Li J, et al. (2014). A pan-cancer proteomic perspective on The Cancer Genome Atlas. Nat Commun 5, 3887. - PMC - PubMed
    1. Akhurst RJ (2017). Targeting TGF-beta Signaling for Therapeutic Gain Cold Spring Harb Perspect Biol 9. - PMC - PubMed
    1. Cancer Genome Atlas, N. (2012). Comprehensive molecular characterization of human colon and rectal cancer. Nature 487, 330–337. - PMC - PubMed
    1. Cancer Genome Atlas, N. (2015). Genomic Classification of Cutaneous Melanoma. Cell 161, 1681–1696. - PMC - PubMed
    1. Cancer Genome Atlas Research, N. (2011). Integrated genomic analyses of ovarian carcinoma. Nature 474, 609–615. - PMC - PubMed

Publication types

MeSH terms

Substances