. 2018 Oct 26:8:29-39.
doi: 10.1016/j.isci.2018.08.015. Epub 2018 Aug 21.

Single-Cell Tracking of Breast Cancer Cells Enables Prediction of Sphere Formation from Early Cell Divisions

Affiliations

Single-Cell Tracking of Breast Cancer Cells Enables Prediction of Sphere Formation from Early Cell Divisions

Patrick C Bailey et al. iScience. .

Abstract

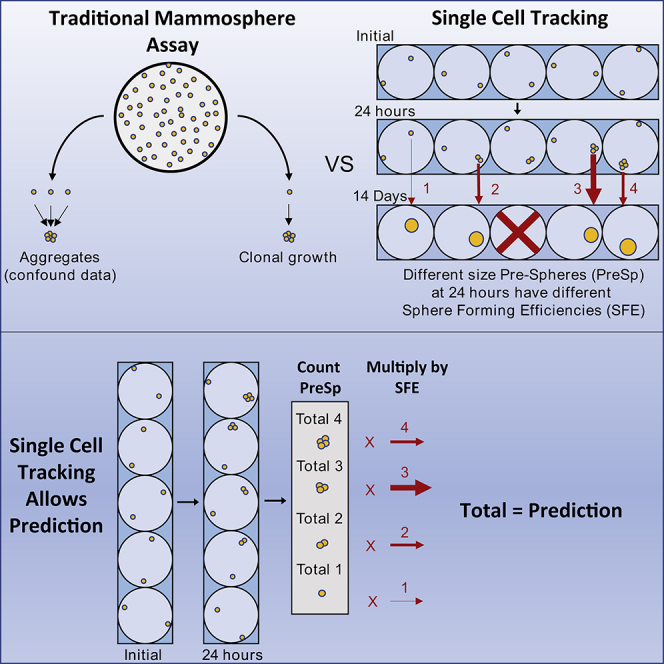
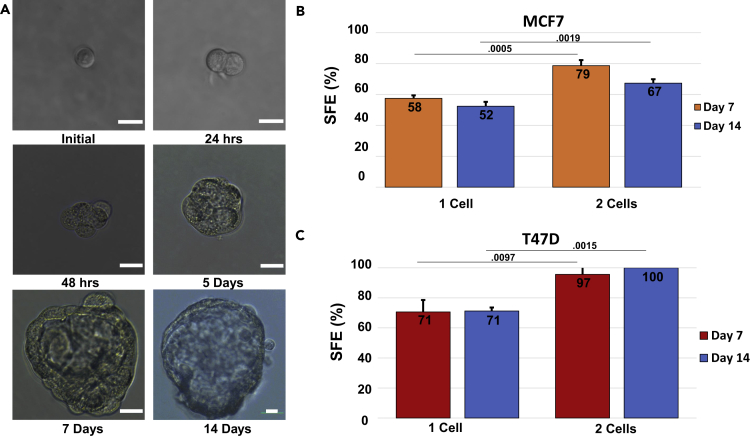
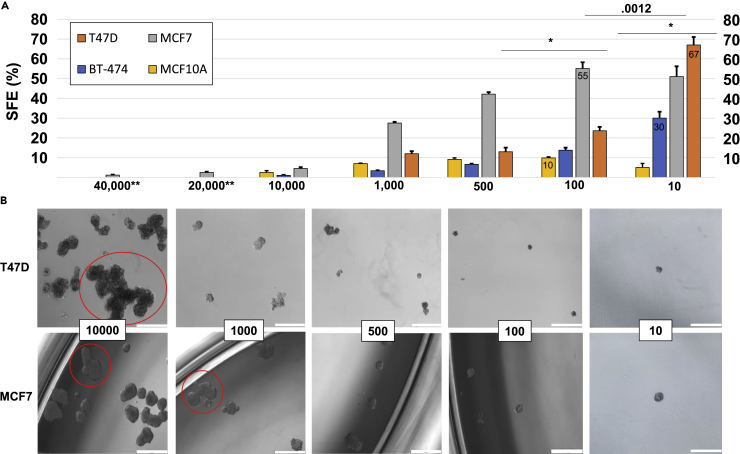
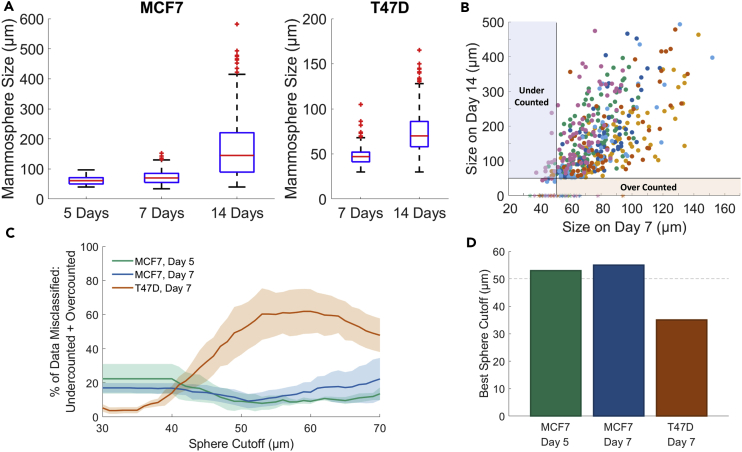
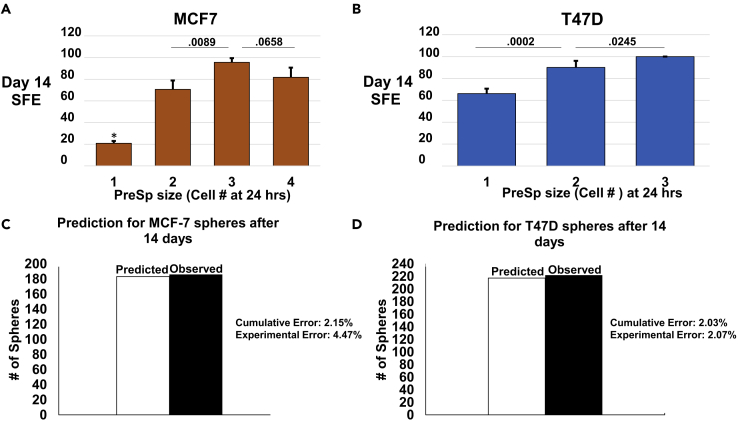
The mammosphere assay has become widely employed to quantify stem-like cells in a population. However, the problem is there is no standard protocol employed by the field. Cell seeding densities of 1,000 to 100,000 cells/mL have been reported. These high densities lead to cellular aggregation. To address this, we have individually tracked 1,127 single MCF-7 and 696 single T47D human breast tumor cells by eye over the course of 14 days. This tracking has given us detailed information for the commonly used endpoints of 5, 7, and 14 days that is unclouded by cellular aggregation. This includes mean sphere sizes, sphere-forming efficiencies, and a well-defined minimum size for both lines. Importantly, we have correlated early cell division with eventual sphere formation. At 24 hr post seeding, we can predict the total spheres on day 14 with 98% accuracy in both lines. This approach removes cell aggregation and potentially shortens a 5- to 14-day assay to a 24 hours.

Keywords: Biology Experimental Methods; Cancer.


Figures

None
Graphical abstract
Figure 1
Figure 1
Initially Plated Single Cells and Two-Cell Clusters Have Significantly Different Sphere-Forming Efficiency (SFE) (A) A single MCF-7 cell tracked and imaged for 14 days. Scale bars, 20 μm. (B) Single-cell and two-cell cluster SFEs of the MCF-7 cell line. Orange bars indicate the SFEs of 1 and 2 cells at day 7. Blue bars indicate day 14. SFEs are calculated as (total spheres/total cells tracked)*100. MCF-7 spheres were considered growths over 50 μm. Statistics formulated using Student's two-tailed t test (N = 3). p Values displayed over bars. (C) Same as (B) for the T47D cell line. Growths over 35 μm at day 7 and 40 μm at day 14 were counted as spheres.
Figure 2
Figure 2
High Seeding Densities Are Confounded by Aggregation (A and B) (A) A density dilution assay was performed on MCF-7, BT-474, T47D, and MCF10A cells in 24-well low-attach plates. The cell seeding density (cells/mL) is displayed on the x axis, and the SFE is displayed on the y axis. Efficiencies were calculated as (spheres/seeded cells)*100. Spheres were counted on day 7. Statistics calculated using two-tailed Student's t test (N = 3 for T47D, BT-474, and MCF10A. N = 6 for MCF-7). p Values displayed above bars. *p < .0001. ** Indicates only performed with MCF-7 cells. (B) Representative images of MCF-7and T47D spheres. Red circles indicate examples of obvious aggregations excluded from counts. Scale bar, 500 μm.
Figure 3
Figure 3
Size Information of Spheres (A) Average mammosphere size of MCF-7 and T47D cell lines. Red bar indicates mean size, and blue box indicates the 25th–75th quartiles. Whiskers represent the range of sizes, whereas red dots are outliers (for MCF-7: day 5, N = 3; days 7 and 14, N = 6. For T47D: N = 6 for days 7 and 14). Note that the y axis scale is different for T47D than MCF-7. (B) Explanatory figure using size after 7 days compared with size on day 14 (N = 6, MCF7). Solid lines represent a sphere cutoff value of 50 μm. If this value is chosen the lavender box illustrates those individual clonal growths (termed Pre-spheres or PreSP) that were under 50 μm but grew to be spheres and were thus undercounted. The beige box illustrates those that were over 50 μm on day 7 but either died or shrunk by day 14 and were therefore overcounted. (C and D) (C) Data from scatter charts were utilized to calculate the percent of misclassified spheres ([undercounted + overcounted]/total spheres). This was calculated for a range of cutoff values and plotted as a graph. Solid line is the weighted average, and the error is ±weighted SD. (D) The cutoff value with the smallest percent of misclassified data was calculated for each day using the graph in (C). For MCF-7 the results were 53 and 55 μm for days 5 and 7, respectively. For T47D the value was 35 μm.
Figure 4
Figure 4
Sphere Formation can be Predicted with 98% Accuracy in 24 Hours For a Figure360 author presentation of Figure 4, see https://doi.org/10.1016/j.isci.2018.08.015. (A and B) Single cells were seeded and tracked. At 24 hr PreSp were counted and categorized by the number of cells in each. Each count was correlated with eventual sphere formation on days 7 and 14 (for example, there were a total of 153 single-cell MCF-7 PreSp at 24 hr. Of these, 32 eventually formed spheres on day 14, yielding an SFE of 21%). SFE for each size of PreSp is displayed on the y axis. Error bars are weighted SD. (A) Objects over 50 μm were considered spheres for the MCF-7 cell line. (B) Growths over 35 μm on day 7 and 40 μm on day 14 were considered spheres for the T47D cell line. p Values were calculated by Student's two-tailed t test and are displayed above the bars on the graph (N = 3). * Indicates significantly different from all other PreSp sizes with p <.0001. (C and D) Single cells were again tracked over 14 days in the same manner as in (A) and (B). At 24 hr PreSp sizes were counted. SFEs from (A) were then used in a predictive capacity on these counts to determine how many spheres would form at 14 days. [For example, in one experiment there were 82 two-cell MCF-7 PreSp at 24 hr. The SFE from (A) would predict 62.76 spheres on day 14. The actual spheres formed on day 14 were then compared with these predictions.] The y axis shows the total spheres from three experiments. The white bar is the total prediction calculated using SFEs from previous experiments. The black bar is the total spheres actually observed. Difference between prediction and observation (cumulative error) at 14 days was 2.15% for MCF-7 cells (C) and 2.03% for T47Ds (D). Average error for MCF-7s was 4.47 (±.5) (C) and 2.07 (± 1.71) for T47Ds (D).
Figure 5
Figure 5
CD44HI/CD24- Populations Do Not Play A Large Role in the Sphere-Forming Efficiency of MCF-7 or T47D Cells (A) A representative image of MCF-7 cells sorted by flow cytometry. Q1 represents the CD44+/CD24- population, whereas Q4 contains the CD44-/CD24+ population. Box gates indicate populations sorted by FACS for further analysis. Quadrants were gated using an iso control. (B and C) (B) The percent of parent population for each quadrant of MCF-7 cells. (N = 3) (C) MCF-7 cells were FACS sorted for CD44hi/CD24- and CD44-/CD24+ populations, and mammosphere assays were performed at a density of 10 cells/mL for each population. The graph shows the day 7 SFE for each population on the y axis. Statistics performed with Student's two-tailed t test. p Value displayed above the bar. (D) A representative image of T47D cells sorted by flow cytometry. Q1 represents the CD44+/CD24- population, whereas Q4 contains the CD44-/CD24+ population. (E) The percent of parent population for each quadrant of T47D cells. (N = 3).

Similar articles

Cited by

References

    1. Akrap N., Andersson D., Bom E., Gregersson P., Stahlberg A., Landberg G. Identification of distinct breast cancer stem cell populations based on single-cell analyses of functionally enriched stem and progenitor pools. Stem Cell Rep. 2016;6:121–136. - PMC - PubMed
    1. Al-Hajj M., Wicha M.S., Benito-Hernandez A., Morrison S.J., Clarke M.F. Prospective identification of tumorigenic breast cancer cells. Proc. Natl. Acad. Sci. USA. 2003;100:3983–3988. - PMC - PubMed
    1. Alimperti S., Lei P., Wen Y., Tian J., Campbell A.M., Andreadis S.T. Serum-free spheroid suspension culture maintains mesenchymal stem cell proliferation and differentiation potential. Biotechnol. Prog. 2014;30:974–983. - PMC - PubMed
    1. Chang H.W., Wang H.C., Chen C.Y., Hung T.W., Hou M.F., Yuan S.S., Huang C.J., Tseng C.N. 5-azacytidine induces anoikis, inhibits mammosphere formation and reduces metalloproteinase 9 activity in MCF-7 human breast cancer cells. Molecules. 2014;19:3149–3159. - PMC - PubMed
    1. Choi H.S., Kim D.A., Chung H., Park I.H., Kim B.H., Oh E.S., Kang D.H. Screening of breast cancer stem cell inhibitors using a protein kinase inhibitor library. Cancer Cell Int. 2017;17:25. - PMC - PubMed

LinkOut - more resources