

Microtubule Dynamics, Kinesin-1 Sliding, and Dynein Action Drive Growth of Cell Processes
- PMID: 30268540
- PMCID: PMC6260207
- DOI: 10.1016/j.bpj.2018.08.046
Microtubule Dynamics, Kinesin-1 Sliding, and Dynein Action Drive Growth of Cell Processes
Abstract
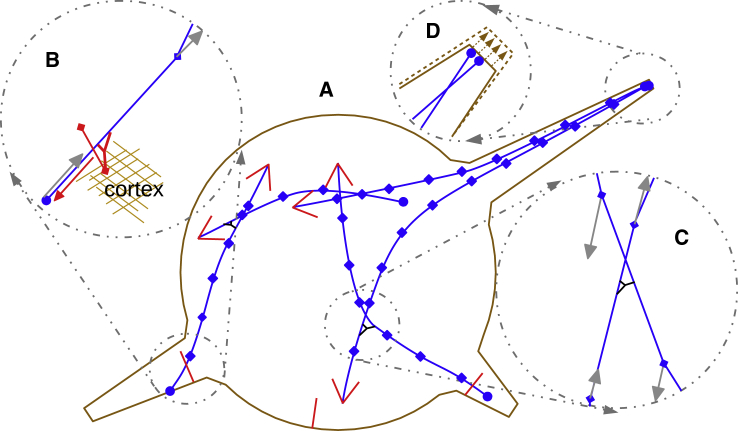
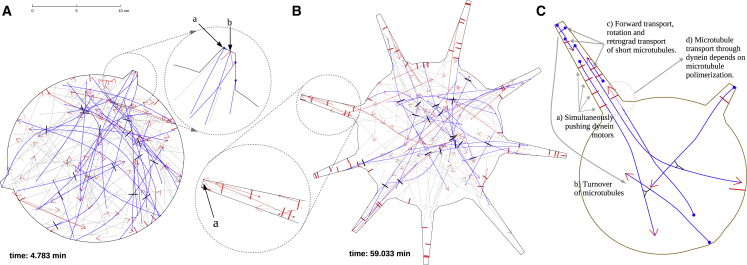
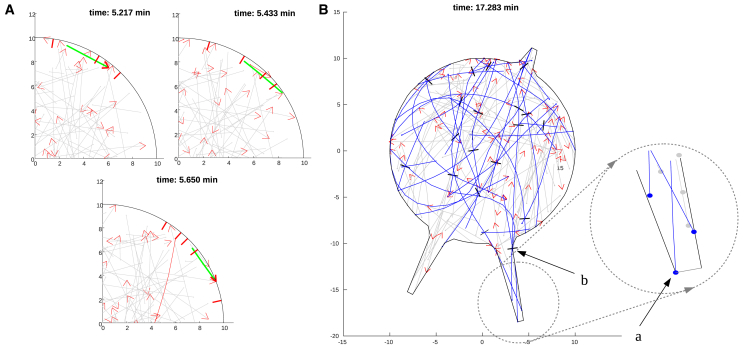
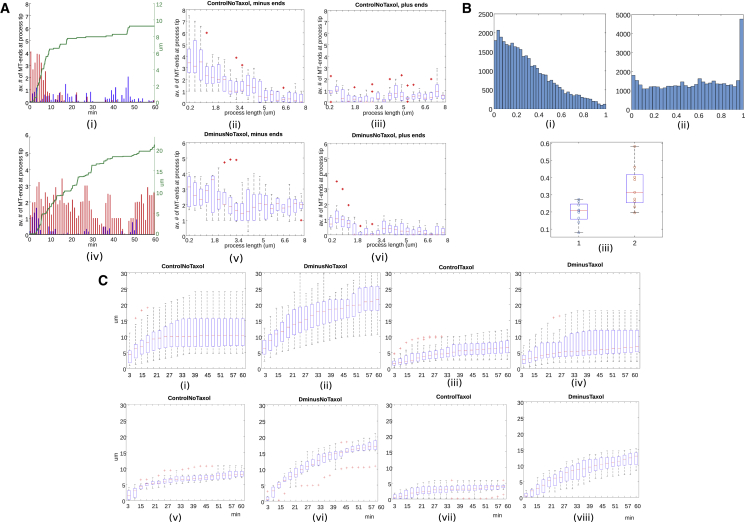
Recent experimental studies of the role of microtubule sliding in neurite outgrowth suggested a qualitative model, according to which kinesin-1 motors push the minus-end-out microtubules against the cell membrane and generate the early cell processes. At the later stage, dynein takes over the sliding, expels the minus-end-out microtubules from the neurites, and pulls in the plus-end-out microtubules that continue to elongate the nascent axon. This model leaves unanswered a number of questions: why is dynein unable to generate the processes alone, whereas kinesin-1 can? What is the role of microtubule dynamics in process initiation and growth? Can the model correctly predict the rates of process growth in control and dynein-inhibited cases? What triggers the transition from kinesin-driven to dynein-driven sliding? To answer these questions, we combine computational modeling of a network of elastic dynamic microtubules and kinesin-1 and dynein motors with measurements of the process growth kinetics and pharmacological perturbations in Drosophila S2 cells. The results verify quantitatively the qualitative model of the microtubule polarity sorting and suggest that dynein-powered elongation is effective only when the processes are longer than a threshold length, which explains why kinesin-1 alone, but not dynein, is sufficient for the process growth. Furthermore, we show that the mechanism of process elongation depends critically on microtubule dynamic instability. Both modeling and experimental measurements show, surprisingly, that dynein inhibition accelerates the process extension. We discuss implications of the model for the general problems of cell polarization, cytoskeletal polarity emergence, and cell process protrusion.
Copyright © 2018 Biophysical Society. Published by Elsevier Inc. All rights reserved.
Figures
Similar articles
-
Interplay between kinesin-1 and cortical dynein during axonal outgrowth and microtubule organization in Drosophila neurons.Elife. 2015 Dec 28;4:e10140. doi: 10.7554/eLife.10140. Elife. 2015. PMID: 26615019 Free PMC article.
-
Cytoplasmic Dynein Transports Axonal Microtubules in a Polarity-Sorting Manner.Cell Rep. 2017 Jun 13;19(11):2210-2219. doi: 10.1016/j.celrep.2017.05.064. Cell Rep. 2017. PMID: 28614709 Free PMC article.
-
Moonlighting Motors: Kinesin, Dynein, and Cell Polarity.Trends Cell Biol. 2017 Jul;27(7):505-514. doi: 10.1016/j.tcb.2017.02.005. Epub 2017 Mar 8. Trends Cell Biol. 2017. PMID: 28284467 Free PMC article. Review.
-
Kinesin-1, -2, and -3 motors use family-specific mechanochemical strategies to effectively compete with dynein during bidirectional transport.Elife. 2022 Sep 20;11:e82228. doi: 10.7554/eLife.82228. Elife. 2022. PMID: 36125250 Free PMC article.
-
Why are ATP-driven microtubule minus-end directed motors critical to plants? An overview of plant multifunctional kinesins.Funct Plant Biol. 2020 May;47(6):524-536. doi: 10.1071/FP19177. Funct Plant Biol. 2020. PMID: 32336322 Review.
Cited by
-
LeishIF4E1 Deletion Affects the Promastigote Proteome, Morphology, and Infectivity.mSphere. 2019 Nov 13;4(6):e00625-19. doi: 10.1128/mSphere.00625-19. mSphere. 2019. PMID: 31722993 Free PMC article.
-
Microtubule polymerization generates microtentacles important in circulating tumor cell invasion.Biophys J. 2025 Jul 1;124(13):2161-2175. doi: 10.1016/j.bpj.2025.05.018. Epub 2025 May 26. Biophys J. 2025. PMID: 40432209 Free PMC article.
-
Manipulation of Axonal Outgrowth via Exogenous Low Forces.Int J Mol Sci. 2020 Oct 28;21(21):8009. doi: 10.3390/ijms21218009. Int J Mol Sci. 2020. PMID: 33126477 Free PMC article. Review.
-
Patronin regulates presynaptic microtubule organization and neuromuscular junction development in Drosophila.iScience. 2024 Jan 18;27(2):108944. doi: 10.1016/j.isci.2024.108944. eCollection 2024 Feb 16. iScience. 2024. PMID: 38318379 Free PMC article.
-
Bidirectional sliding of two parallel microtubules generated by multiple identical motors.J Math Biol. 2019 Jul;79(2):571-594. doi: 10.1007/s00285-019-01369-w. Epub 2019 Apr 23. J Math Biol. 2019. PMID: 31016335 Free PMC article.
References
-
- Huber F., Boire A., Koenderink G.H. Cytoskeletal crosstalk: when three different personalities team up. Curr. Opin. Cell Biol. 2015;32:39–47. - PubMed
-
- van Beuningen S.F., Hoogenraad C.C. Neuronal polarity: remodeling microtubule organization. Curr. Opin. Neurobiol. 2016;39:1–7. - PubMed
-
- Schelski M., Bradke F. Neuronal polarization: from spatiotemporal signaling to cytoskeletal dynamics. Mol. Cell. Neurosci. 2017;84:11–28. - PubMed
-
- Fivaz M., Bandara S., Meyer T. Robust neuronal symmetry breaking by Ras-triggered local positive feedback. Curr. Biol. 2008;18:44–50. - PubMed
-
- Inagaki N., Toriyama M., Sakumura Y. Systems biology of symmetry breaking during neuronal polarity formation. Dev. Neurobiol. 2011;71:584–593. - PubMed
Publication types
MeSH terms
Substances
Grants and funding
LinkOut - more resources
Full Text Sources
Molecular Biology Databases
