. 2018 Nov 7;100(3):684-699.e6.
doi: 10.1016/j.neuron.2018.09.001. Epub 2018 Sep 27.

Learning-Related Plasticity in Dendrite-Targeting Layer 1 Interneurons

Affiliations

Learning-Related Plasticity in Dendrite-Targeting Layer 1 Interneurons

Elisabeth Abs et al. Neuron. .

Abstract

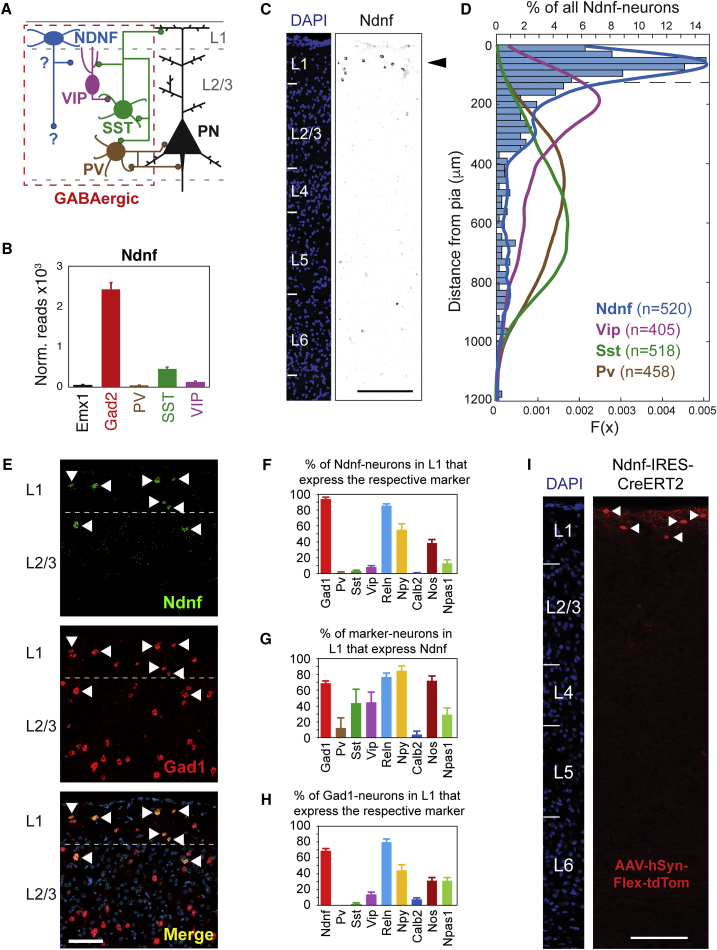
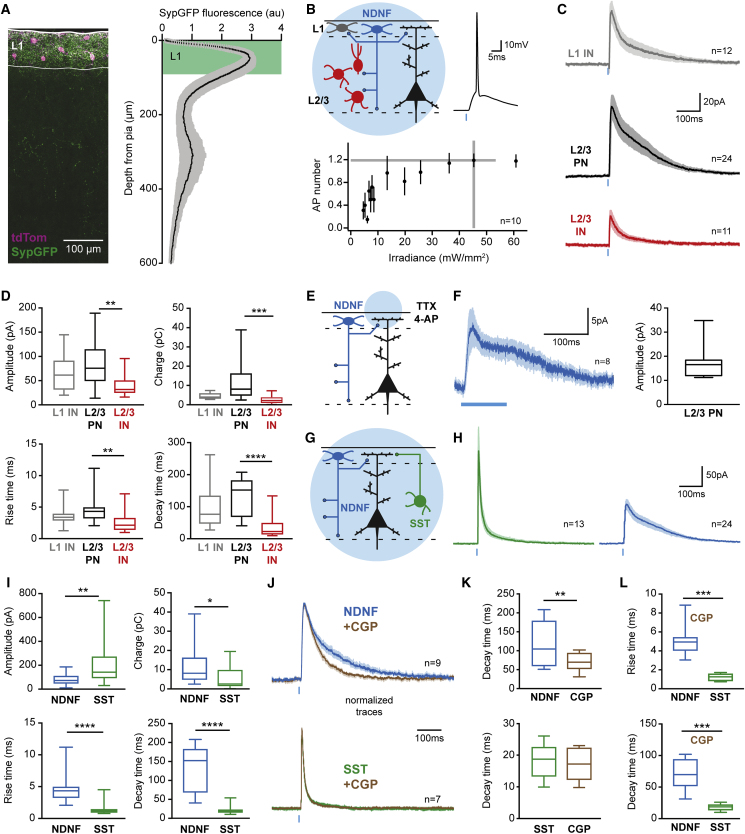
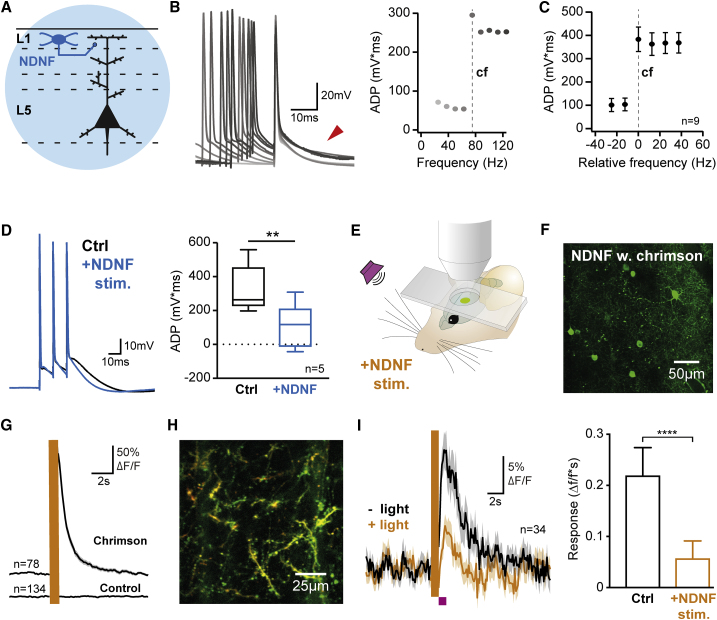
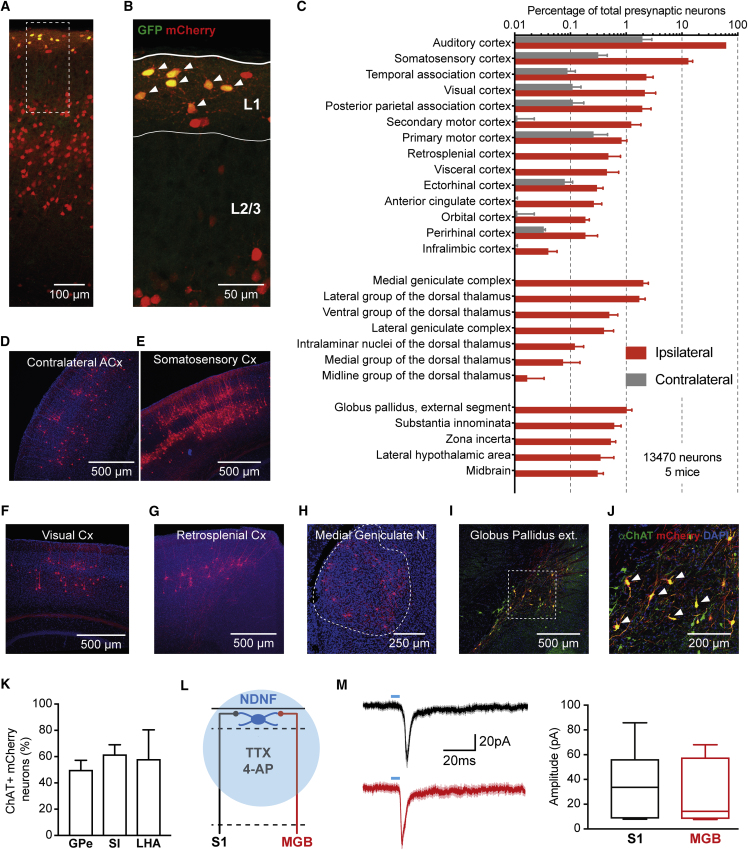
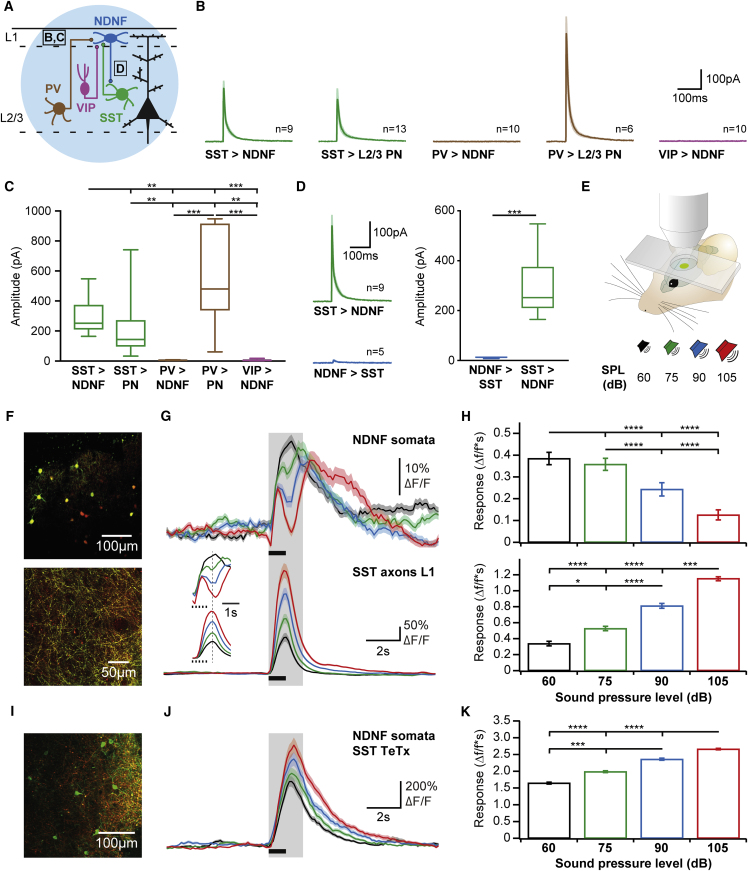
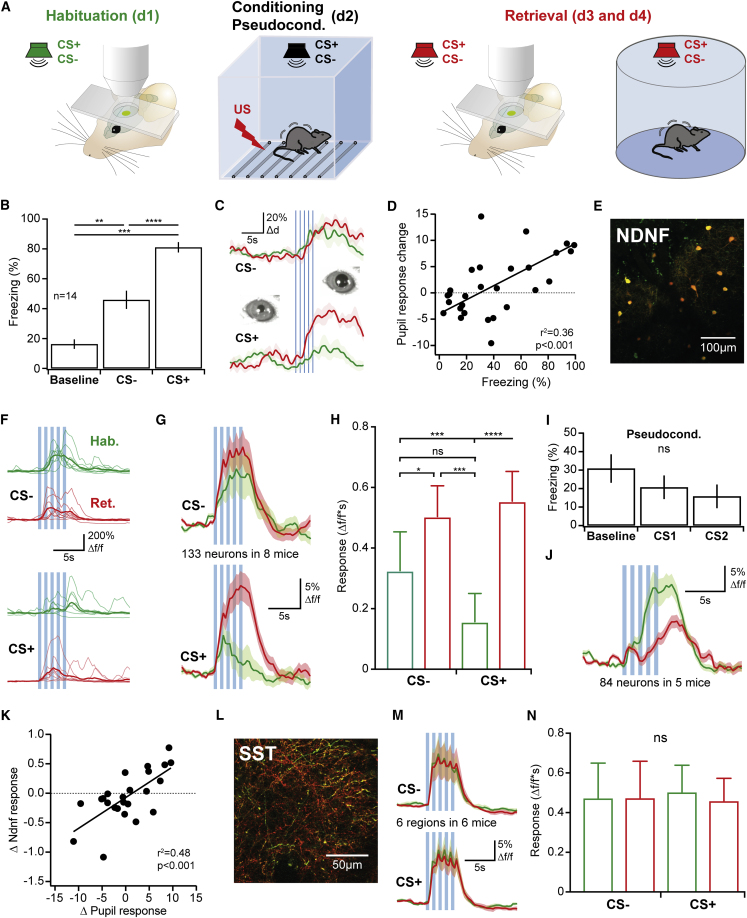
A wealth of data has elucidated the mechanisms by which sensory inputs are encoded in the neocortex, but how these processes are regulated by the behavioral relevance of sensory information is less understood. Here, we focus on neocortical layer 1 (L1), a key location for processing of such top-down information. Using Neuron-Derived Neurotrophic Factor (NDNF) as a selective marker of L1 interneurons (INs) and in vivo 2-photon calcium imaging, electrophysiology, viral tracing, optogenetics, and associative memory, we find that L1 NDNF-INs mediate a prolonged form of inhibition in distal pyramidal neuron dendrites that correlates with the strength of the memory trace. Conversely, inhibition from Martinotti cells remains unchanged after conditioning but in turn tightly controls sensory responses in NDNF-INs. These results define a genetically addressable form of dendritic inhibition that is highly experience dependent and indicate that in addition to disinhibition, salient stimuli are encoded at elevated levels of distal dendritic inhibition. VIDEO ABSTRACT.

Keywords: GABAergic interneurons; NDNF interneurons; connectivity; dendritic inhibition; fear learning; genetic markers; interneurons; layer 1; neocortical circuits; somatostatin interneurons; top-down processing.


Figures

Figure 1
Figure 1
Ndnf Is a Selective Marker of Neocortical Layer 1 Interneurons (A) Circuit diagram of neocortex. The connections of L1 NDNF-INs are not known and are the subject of this study. (B) RiboTag-seq indicates that Ndnf-expression is highly enriched in GABAergic neurons, but not in IN subtypes that express Pv, Sst, or Vip. (C and D) Ndnf-expressing GABAergic neurons are concentrated in L1. RNAscope FISH for Ndnf, Gad1, and IN subtype markers was done in the adult auditory cortex. (C) Ndnf-expressing cells are concentrated in L1 (scale bar, 200 μm). (D) The distribution of Ndnf-expressing INs in the adult auditory cortex differs from the distribution of other INs. The distance from the pia was determined for each cell expressing a given marker and plotted as a histogram (for Ndnf) or the corresponding probability density function (PDF; for Ndnf, Pv, Sst, and Vip; dashed line indicates the L1 border). (E–H) Ndnf-expressing neurons constitute the majority of L1 GABAergic neurons and do not overlap with Pv, Sst, or Vip. (E) Representative image of FISH for Ndnf and Gad1 in the auditory cortex (co-expressing neurons are indicated by arrowheads, and DAPI-labeled nuclei are in blue; scale bar represents 100 μm). (F) Percentage of L1 Ndnf neurons that co-express the respective marker. (G) Percentage of L1 neurons expressing the respective subtype marker that co-expresses Ndnf. (H) Percentage of Gad1-positive L1 neurons expressing each subtype marker. (I) A newly generated mouse line allows for temporally controlled selective labeling of L1 NDNF-neurons. Auditory cortex section of an Ndnf-Ires-CreERT2 mouse injected with an AAV-construct that drives Cre-dependent tdTomato expression (AAV-hSyn-Flex-tdTomato) upon tamoxifen application (scale bar, 200 μm). Data are presented as mean ± SEM.
Figure 2
Figure 2
Output Connectivity of Layer 1 NDNF-Interneurons in the Auditory Cortex (A) AAV-mediated expression of tdTomato and synaptophysin-GFP in the Ndnf-Ires-CreERT2 mouse auditory cortex (left). Synaptophysin-GFP fluorescence is strongly enriched in L1, suggesting that L1 is the primary output location of L1 NDNF-INs (right) (19 slices, 3 animals). (B) Optogenetic identification of the postsynaptic partners of L1 NDNF-INs in acute slices (top left). L1 and L2/3 INs were identified by nuclear mCherry expression (Peron et al., 2015) and L2/3 PNs by morphology. Calibration of ChR-2 expressing L1 NDNF-IN stimulation (bottom; top right shows an example trace). The chosen irradiance (gray lines, 45 mW/mm2) elicited 1.2 action potentials per pulse (0.5 ms, n = 10). (C) Average IPSCs in ChR-2 negative L1 INs (gray, n = 12), L2/3 PNs (black, n = 24), and L2/3 INs (red, n = 11). (D) Comparison of L1 NDNF-IN-mediated IPSCs in the different postsynaptic populations. Note the greater amplitude and charge of IPSCs in L2/3 PNs and the faster rise and decay in L2/3 INs (Kruskal-Wallis H-test with Dunn’s multiple comparison). (E) Optogenetic activation of L1 NDNF-IN synapse selectively in L1 under action potential block (1 μM tetrodotoxin [TTX], 100 μM 4-AP). (F) Input to L2/3 PNs is targeted to their distal dendrites located in L1. (G) Comparison of NDNF and SST-IN input to the distal dendrites of L2/3 PNs. Note that the two datasets are from different experiments. (H) Average IPSCs evoked by SST- (green, n = 13) and NDNF-IN stimulation (blue, n = 24). (I) IPSCs mediated by L1 NDNF-INs showed greater charge transfer and longer rise and decay times compared to SST inhibition (Mann-Whitney test). (J) IPSCs from SST- (green, n = 7) and L1 NDNF-INs (blue, n = 9) in baseline and after bath application of the selective GABAB receptor antagonist CGP 55845 (3 μM, brown, normalized). (K) GABAB receptor block accelerated the decay time of IPSCs mediated by L1 NDNF-INs but left SST-IN inhibition unaffected (Mann-Whitney test). (L) Kinetic differences between NDNF- and SST-IN IPSCs persist under GABAB receptor block, indicating additional sources (Mann-Whitney test). Data in (B), (C), (F), (H), and (J) represent mean ± SEM; other plots show range, quartiles, and median. (D, I, K, and L) p < 0.05; ∗∗p < 0.01; ∗∗∗p < 0.001; ∗∗∗∗p < 0.0001.
Figure 3
Figure 3
Layer 1 NDNF-Interneurons Control Activity in Pyramidal Neuron Dendrites (A) Recordings from L5 PNs combined with optogenetic stimulation of L1 NDNF-INs. (B) Stimulation of a L5 PN at increasing frequencies (3 action potentials, 25–125 Hz, light to dark gray) causes a sharp increase in the afterdepolarization (ADP, arrowhead, quantification on right) that constitutes the critical frequency of the neurons (dashed line) and correlates with dendritic spike initiation (Larkum et al., 1999a). (C) Quantified data aligned to the critical frequency of each neuron (dashed line) reveals highly supralinear dependence of the ADP on action potential frequency (n = 9). (D) Activation of L1 NDNF-INs (4 pulses at 40 Hz, ending 50–100 ms before last action potential, n = 5, paired t test) significantly reduced the ADP. This indicates that inhibition from L1 NDNF-INs powerfully controls the initiation of PN dendritic spikes in acute brain slices. (E) In vivo 2-photon imaging in auditory cortex of awake mice combined with sensory stimulation (magenta, 5 white noise bursts, 100 ms duration, delivered at 5 Hz) and optogenetic activation of L1 NDNF-INs (yellow, 594 nm). (F) Field of view during in vivo imaging of L1 NDNF-INs co-expressing GCaMP6s (green) and the optogenetic effector Chrimson in Ndnf-Ires-FlpO mice. (G) Optogenetic activation (yellow) elicited strong responses in L1 NDNF-INs expressing Chrimson (top, n = 78) and no activity in animals that only expressed GCaMP6s (n = 134). These data demonstrate reliable optogenetic activation of L1 NDNF-INs in the awake auditory cortex. (H) Field of view during in vivo imaging of distal PN dendrites in L1 expressing GCaMP6s (green) and tdTomato (red) used for motion correction. PNs were selectively labeled by a combination of retrograde Cre expression from subcortical regions (amygdala and striatum) and Cre-dependent expression of GCaMP6s and tdTomato in auditory cortex. (I) Sensory responses (black) in dendritic branches that displayed significant activation by auditory stimulation (34 dendrites in 3 mice; see STAR Methods for details). Optogenetic activation of L1 NDNF-INs (yellow) immediately preceding auditory stimulation (magenta) caused a significant, long lasting reduction of dendritic responses (Wilcoxon test; see also Figures S4G–S4K). Together, these data demonstrate strong control of PN dendritic activity by L1 NDNF-INs in vitro and in awake animals. Data in (D) represent range, quartiles, and median; other plots show mean ± SEM. (D and I) ∗∗p < 0.01; ∗∗∗∗p < 0.0001.
Figure 4
Figure 4
Brain-wide Sources of Synaptic Input to Auditory Cortex Layer 1 NDNF-Interneurons (A) Representative image of the injection site in the adult auditory cortex. L1 NDNF-INs were made competent for rabies virus by injection of AAV-synP-DIO-sTpEpB (Kohara et al., 2014) and subsequent tamoxifen induction in Ndnf-Ires-CreERT2 mice. After 4–5 weeks of expression time, RV-dG-mCherry was injected at the same site. Note localization of starter cells expressing both GFP and mCherry in L1 and presynaptic partners in both L1 and deeper layers. (B) Magnified view of the area indicated in (A). Starter L1 NDNF-INs are marked by arrowheads. (C) Brain-wide input map to auditory cortex L1 NDNF-INs obtained by referencing mCherry cells (13,470 neurons from 5 animals) to the Allen Brain Atlas (Fürth et al., 2018). This analysis reveals a large number of cortical (top), thalamic (center), and other areas (bottom) that provide afferent input to auditory cortex L1 NDNF-INs. (D–H) Representative images of the indicated areas. (I and J) Image of mCherry-expressing neurons in globus pallidus externus counterstained for ChAT, identifying several input neurons in this area to be cholinergic (I); arrowheads in (J), high magnification. (K) Approximately half of the mCherry-expressing neurons in the globus pallidus externus (GPe), substantia innominate (SI), and lateral hypothalamic area (LHA) were ChAT positive, revealing substantial cholinergic input to auditory cortex L1 NDNF-INs from these areas. (L) Anterograde physiological validation of the strongest cortical (somatosensory cortex [S1]) and strongest thalamic (medial geniculate body [MGB]) input sources. (M) Optogenetic stimulation of these axons under action potential block by TTX and 4-AP to prevent polysynaptic input elicits excitatory postsynaptic current (EPSCs) of comparable amplitude in auditory cortex L1 NDNF-INs (n = 7 each, p > 0.05, unpaired t test), confirming that rabies virus tracing identifies true synaptic connectivity. Data in (M) represent range, quartiles, and median; other plots show mean ± SEM.
Figure 5
Figure 5
Inhibitory Control of Layer 1 NDNF-Interneuron Activity in the Auditory Cortex (A) Optogenetic identification of inhibitory inputs to L1 NDNF-INs. ChR-2 was expressed in SST-, PV-, or VIP-INs, and whole-cell recordings were performed in acute slices from genetically identified L1 NDNF-INs (Gong et al., 2003) and neighboring L2/3 PNs for comparison. (B) Average IPSCs in L1 NDNF-INs (n = 9 from SST, n = 10 from PV, and n = 10 from VIP) and L2/3 PNs (n = 13 from SST and n = 6 from PV). (C) L1 NDNF-INs receive strong inhibition from SST-INs similar to L2/3 PNs but no input from PV- or VIP-INs (Kruskal-Wallis H-test with Dunn’s multiple comparison). (D) The opposite connection direction was addressed in a cross of SST-Ires-Cre and Ndnf-Ires-FlpO animals, allowing expression of Chrimson for light stimulation in L1 NDNF-INs in combination with tdTomato expression in SST-INs to target these cells for whole-cell recordings. Light stimulation elicited IPSCs in neighboring PNs with amplitudes indistinguishable from those evoked with ChR-2 (Figure S6F), indicating efficient recruitment of L1 NDNF-INs. In contrast, input from L1 NDNF-INs to SST-INs (n = 5) displayed much smaller amplitudes than in the opposite direction (right, n = 9, unpaired t test), indicating that inhibition is largely unidirectional from SST- to NDNF-INs. (E) In vivo 2-photon imaging in auditory cortex of awake mice during presentation of white noise (5 bursts, 100 ms duration, delivered at 5 Hz) at different sound pressure levels. (F) Fields of view during in vivo imaging of L1 NDNF-INs (top) and axons derived from SST-INs (bottom) in the auditory cortex L1. L1 NDNF-INs expressed GCaMP6s due to the better signal-to-noise ratio, whereas SST axons were imaged using either GCaMP6s or GCaMP6f for better temporal resolution. Both populations also expressed tdTomato for motion correction. (G) Average responses of L1 NDNF-IN somata (top, 95 neurons in 5 mice) and SST axons (bottom, 11 regions in 11 mice, 8 with GCaMP6f, and 2 with GCaMP6s) during auditory stimulation at different sound pressure levels (indicated by the black bar; color code in E). Inset: responses in the quantified time window (2 s after stimulus onset) at higher temporal resolution. Note that the excitatory peak in SST axons (bottom, dashed line) coincides with the local minimum in L1 NDNF-INs (top). Importantly, similar data were obtained with somatic imaging of SST-INs (Figures S6H–S6J). (H) Quantification of the response integral during 2 s after stimulation onset (gray shading in G for L1 NDNF-INs [top] and SST axons [bottom]). While SST axon responses increased with increasing stimulus intensity, L1 NDNF-INs displayed the opposite relationship (>6 trials per intensity, Friedman test with Dunn’s multiple comparison). (I) To test whether input from SST-INs causes the observed inhibition of L1 NDNF-INs at higher stimulus intensities, we crossed SST-Ires-Cre and Ndnf-Ires-FlpO animals, allowing expression of GCaMP6s in L1 NDNF-INs in combination with expression of tetanus toxin light chain (TeTx) and tdTomato in SST-INs. (J) Silencing of synaptic release from SST-INs converted the responses of L1 NDNF-INs (n = 38 neurons in 4 mice) from decreasing with stimulus intensity in controls (G, top) to increasing. (K) Quantification of the response integral during 2 s after stimulation onset (gray shading in J; Friedman test with Dunn’s multiple comparison). Data in (C) and (D) represent range, quartiles, and median; other plots show mean ± SEM. (C, D, H, and K) p < 0.05; ∗∗p < 0.01; ∗∗∗p < 0.001; ∗∗∗∗p < 0.0001.
Figure 6
Figure 6
Plasticity of Layer 1 NDNF-Interneuron Responses after Associative Learning (A) Discriminative auditory fear conditioning in combination with awake in vivo 2-photon imaging. Trains of frequency-modulated sweeps of opposite modulation direction (counterbalanced between experiments) were used as conditioned stimuli (CS). (B) Freezing behavior of the fear-conditioned animals presented in (E)–(N) in a freely behaving memory retrieval session on day 3 or 4 indicates strong, discriminative fear memory (CS+: 8 animals up sweeps, 6 animals down sweeps, one-way ANOVA F(1.7, 21.7) = 56.1, p < 0.0001; Tukey’s multiple comparison test). (C) Example pupil diameter response to CS presentation during habituation (green) and memory retrieval (red, sweep onset blue lines) in head fixation. (D) The change in pupil response for the CSs (response integral retrieval minus integral habituation) correlated with freezing to the stimuli (both fear and pseudoconditioned mice shown), demonstrating that pupil responses can be used as a fear readout under the microscope. (E) Field of view for in vivo imaging of NDNF-INs in the auditory cortex L1 of awake, head-fixed mice (conditional expression of GCaMP6s [green] and tdTomato [red] in Ndnf-Ires-CreERT2). (F) Responses of an example L1 NDNF-IN before and after fear conditioning (thin traces represent single trials and thick traces averages). (G) Average CS responses of all imaged L1 NDNF-INs (133 neurons in 8 mice, CS+: 58 neurons up sweeps, 75 neurons down sweeps) showing a modest increase for the CS− and strong potentiation of CS+ responses. (H) Quantification of response integral. Both CS− and CS+ responses were significantly potentiated after fear conditioning, whereas no difference was observed during habituation (p = 0.93, Friedman test with Dunn’s multiple comparison). (I) Freezing behavior of pseudoconditioned animals (n = 5). Note absence of CS evoked freezing (one-way ANOVA F(1.5, 5.8) = 3.2, p > 0.05). (J) Average CS responses of all imaged L1 NDNF-IN in mice from (I) (84 neurons in 5 mice, CS1 and CS2 combined) showing a decrease in responses for these stimuli. (K) Correlation between the response change in L1 NDNF-INs due to fear conditioning (response integral retrieval minus integral habituation) and the change in pupil response elicited by that stimulus for fear and pseudoconditioned animals indicates that potentiation of L1 NDNF-IN correlates with learned stimulus relevance. (L) Field of view during imaging of axons derived from SST-INs in the auditory cortex L1 (GCaMP6s, green; tdTomato, red). (M) Average CS responses of all imaged SST axons (6 regions in 6 mice, CS+: 4 animal up sweeps, 2 animals down sweeps) showing no change with fear conditioning. (N) Quantification of response integral (p > 0.05, Friedman test with Dunn’s multiple comparison). Data are shown as mean ± SEM. (B and H) p < 0.05; ∗∗p < 0.01; ∗∗∗p < 0.001; ∗∗∗∗p < 0.0001.

Comment in

References

    1. Adesnik H., Bruns W., Taniguchi H., Huang Z.J., Scanziani M. A neural circuit for spatial summation in visual cortex. Nature. 2012;490:226–231. - PMC - PubMed
    1. Bastos A.M., Usrey W.M., Adams R.A., Mangun G.R., Fries P., Friston K.J. Canonical microcircuits for predictive coding. Neuron. 2012;76:695–711. - PMC - PubMed
    1. Bennett C., Arroyo S., Berns D., Hestrin S. Mechanisms generating dual-component nicotinic EPSCs in cortical interneurons. J. Neurosci. 2012;32:17287–17296. - PMC - PubMed
    1. Bucurenciu I., Kulik A., Schwaller B., Frotscher M., Jonas P. Nanodomain coupling between Ca2+ channels and Ca2+ sensors promotes fast and efficient transmitter release at a cortical GABAergic synapse. Neuron. 2008;57:536–545. - PubMed
    1. Cadwell C.R., Palasantza A., Jiang X., Berens P., Deng Q., Yilmaz M., Reimer J., Shen S., Bethge M., Tolias K.F. Electrophysiological, transcriptomic and morphologic profiling of single neurons using Patch-seq. Nat. Biotechnol. 2016;34:199–203. - PMC - PubMed

Publication types

LinkOut - more resources