. 2018 Oct 4;175(2):372-386.e17.
doi: 10.1016/j.cell.2018.08.067. Epub 2018 Sep 27.

Structural Remodeling of the Human Colonic Mesenchyme in Inflammatory Bowel Disease

Affiliations

Structural Remodeling of the Human Colonic Mesenchyme in Inflammatory Bowel Disease

James Kinchen et al. Cell. .

Abstract

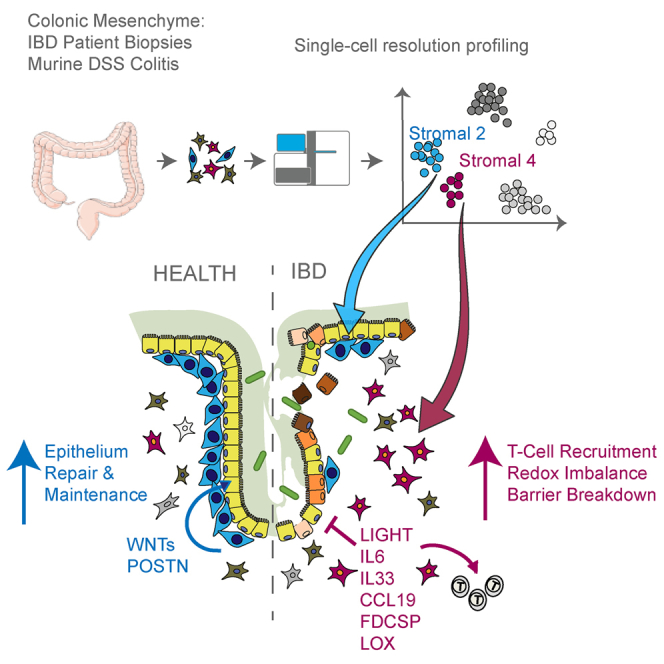
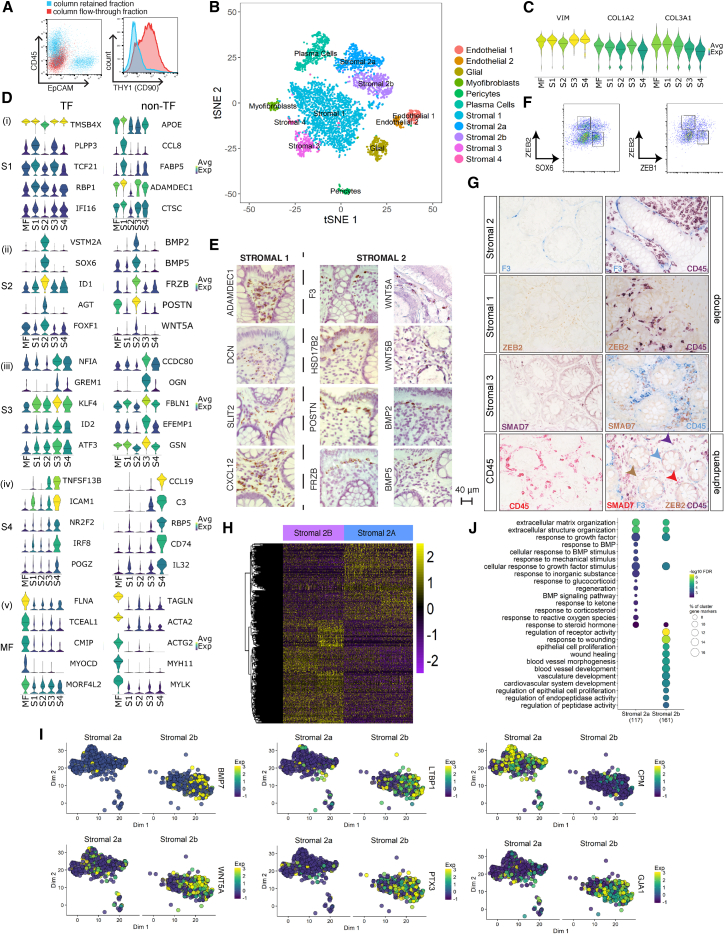
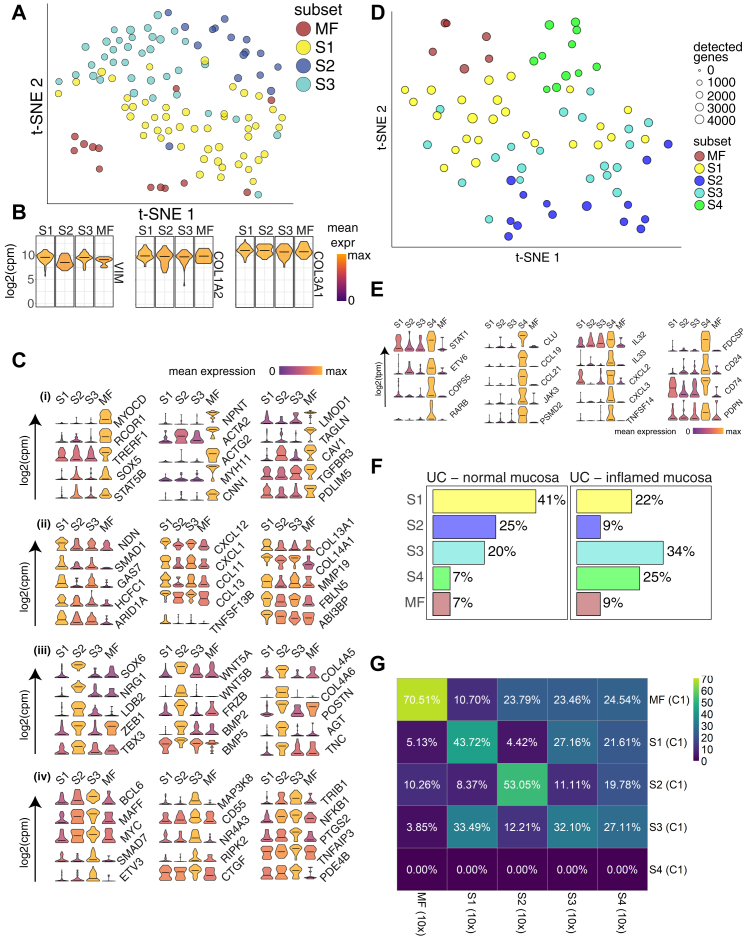
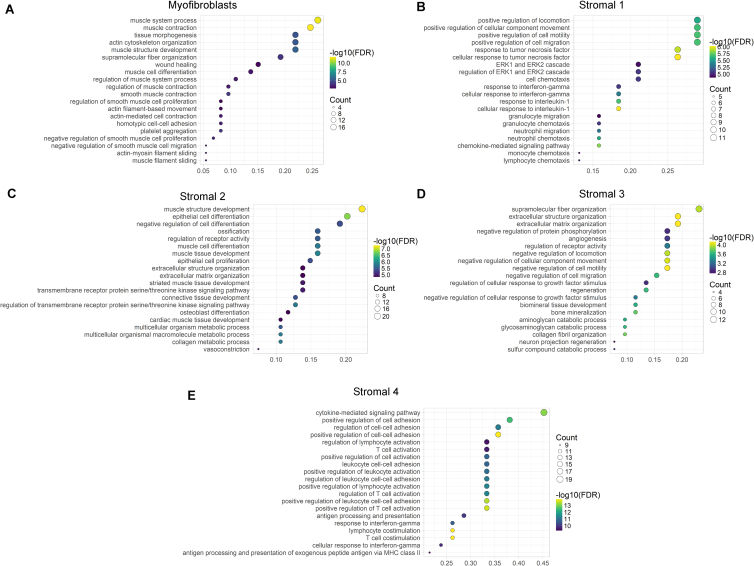
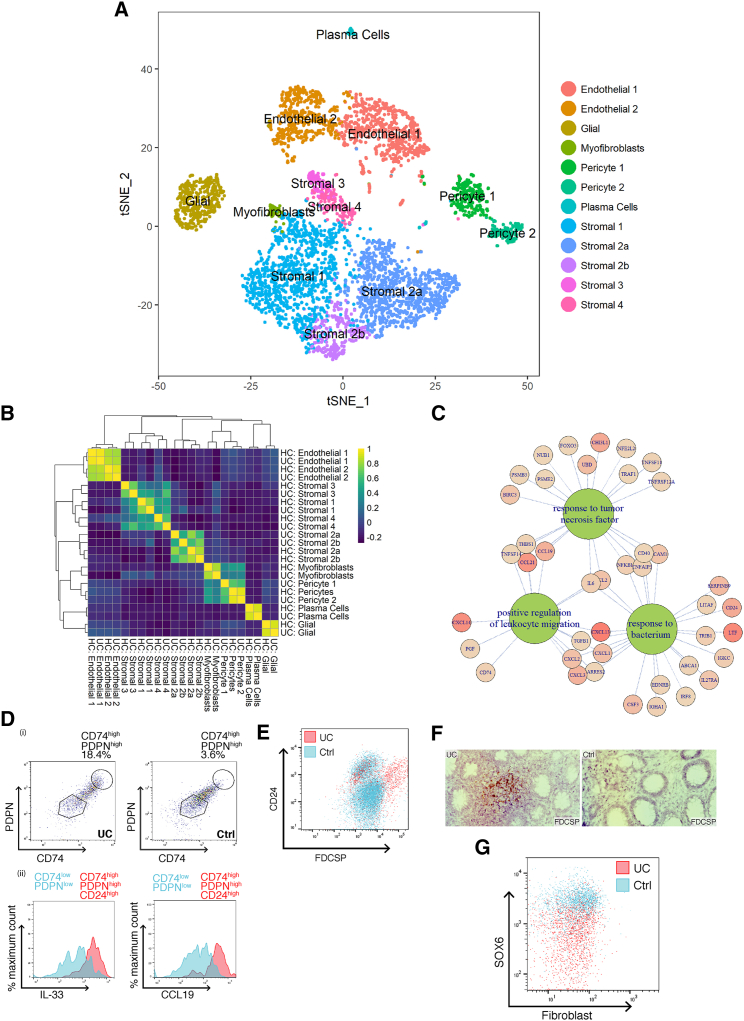
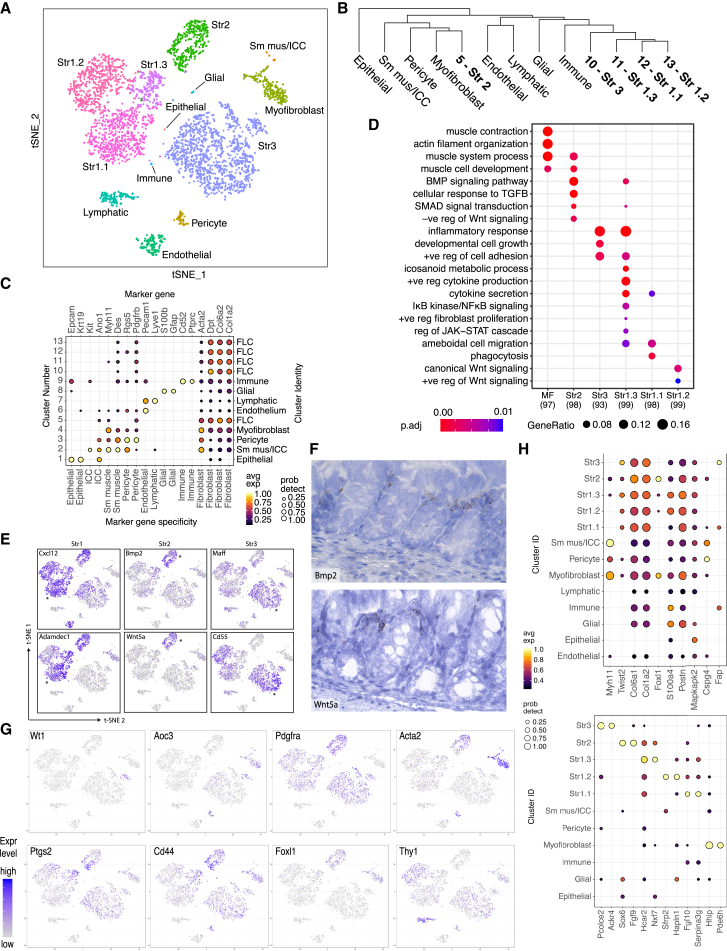
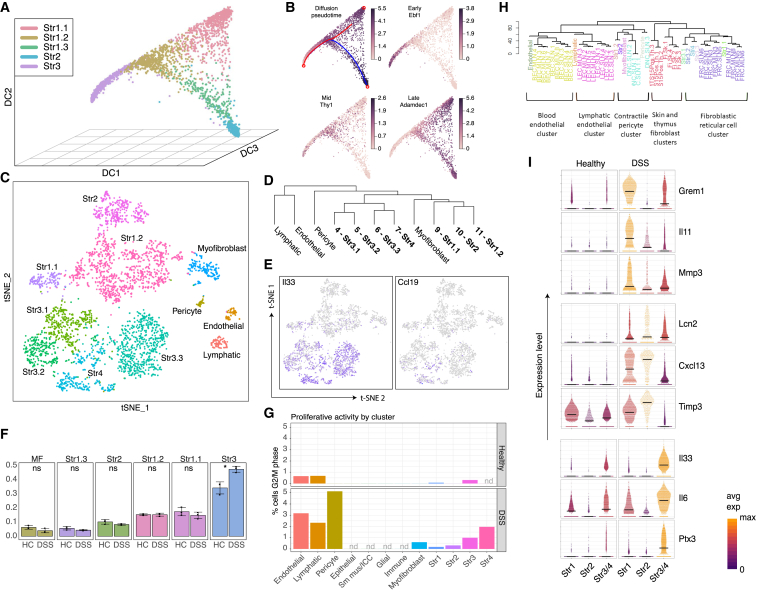
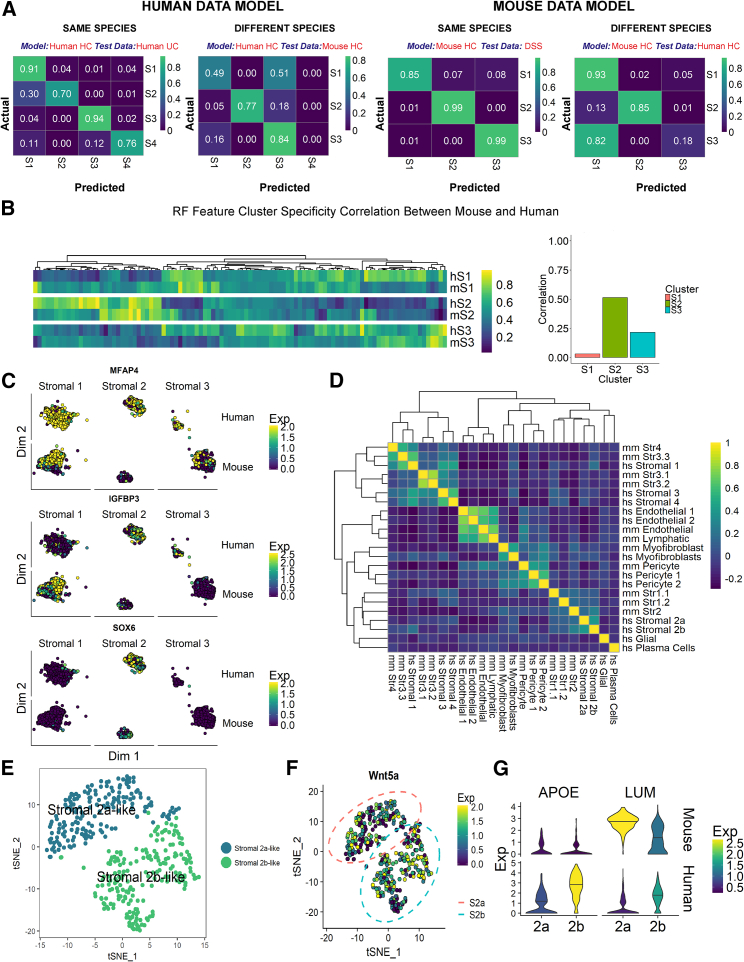
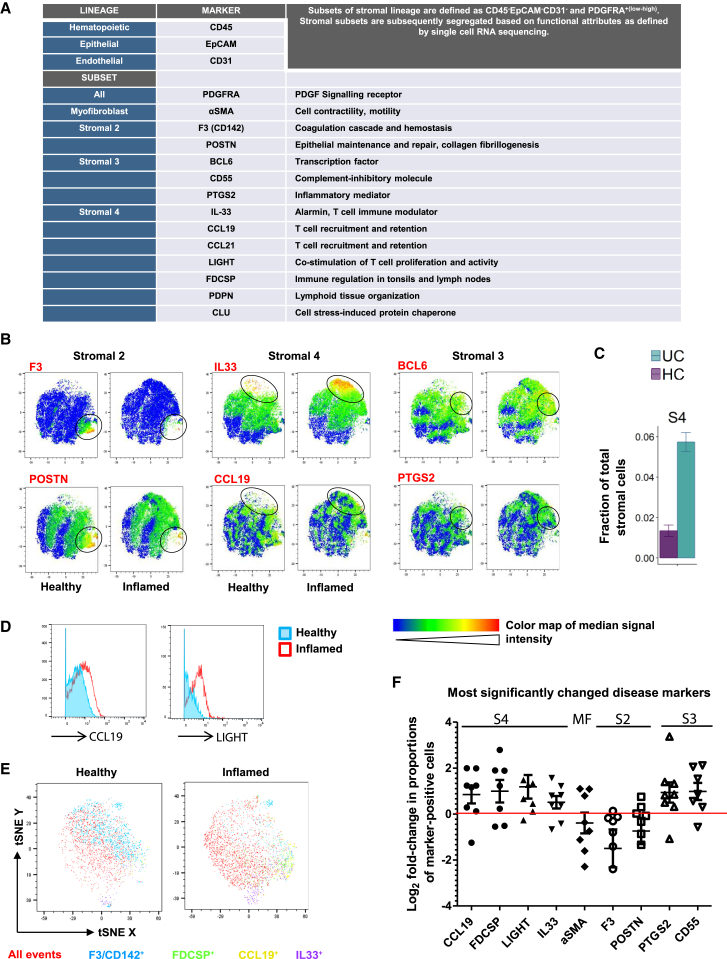
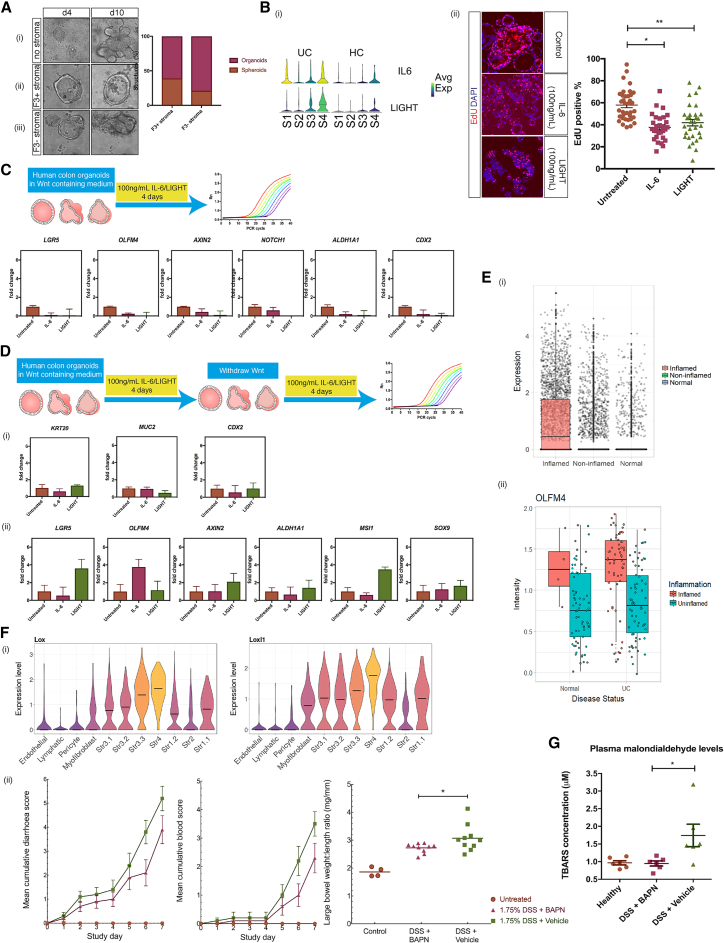
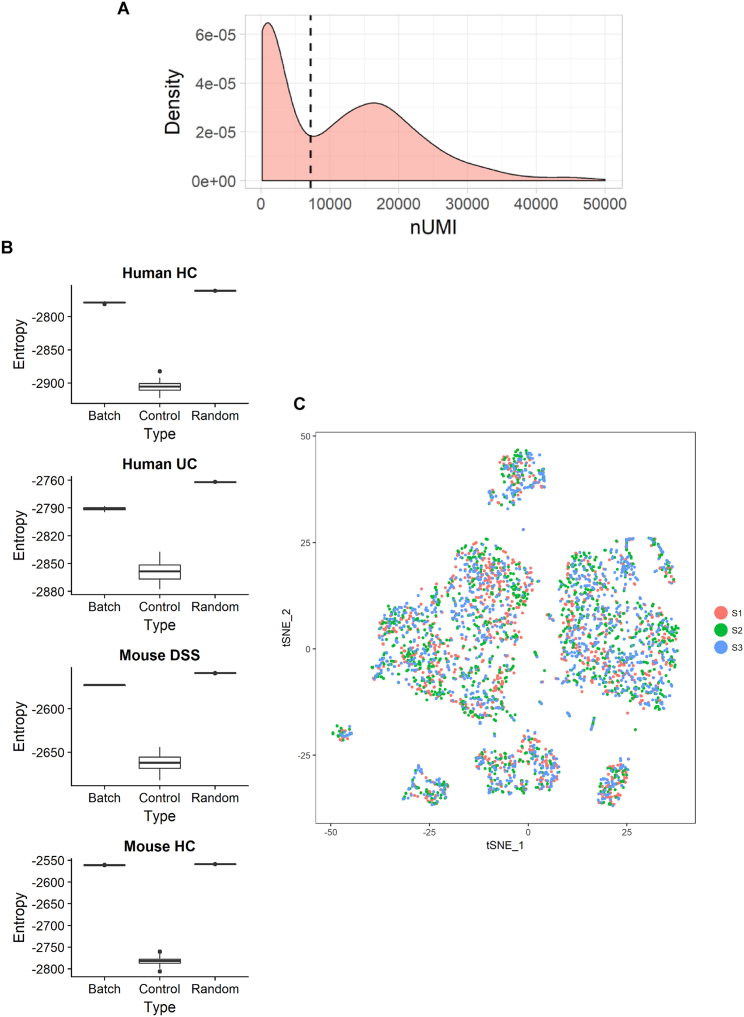
Intestinal mesenchymal cells play essential roles in epithelial homeostasis, matrix remodeling, immunity, and inflammation. But the extent of heterogeneity within the colonic mesenchyme in these processes remains unknown. Using unbiased single-cell profiling of over 16,500 colonic mesenchymal cells, we reveal four subsets of fibroblasts expressing divergent transcriptional regulators and functional pathways, in addition to pericytes and myofibroblasts. We identified a niche population located in proximity to epithelial crypts expressing SOX6, F3 (CD142), and WNT genes essential for colonic epithelial stem cell function. In colitis, we observed dysregulation of this niche and emergence of an activated mesenchymal population. This subset expressed TNF superfamily member 14 (TNFSF14), fibroblastic reticular cell-associated genes, IL-33, and Lysyl oxidases. Further, it induced factors that impaired epithelial proliferation and maturation and contributed to oxidative stress and disease severity in vivo. Our work defines how the colonic mesenchyme remodels to fuel inflammation and barrier dysfunction in IBD.

Keywords: CyTOF; SOX6; TNFSF14; Wnts; crypt niche; inflammatory bowel disease; mesenchyme; single-cell RNA-seq; stratification; stromal cell; target discovery.


Figures

None
Graphical abstract
Figure 1
Figure 1
Human Colonic Mesenchymal Heterogeneity in Health (A) Flow cytometry analysis of the indicated surface markers on colonic single-cell suspensions following removal of epithelial and hematopoietic cells by MACS. Column flow-through is shown in red, and column-retained fraction is in blue. (B) t-SNE plot of the healthy human colonic mesenchyme dataset. Single cells colored by cluster annotation. (C) Violin plots for pan-fibroblast marker genes vimentin (VIM) and collagen types 1 and 3 (COL1A2, COL3A1) across clusters. (D) Violin plots for high-ranked transcriptional regulators and marker genes sharing GO annotation for significantly enriched terms for (i) S1 subset, (ii) S2 subset, (iii) S3 subset, (iv) S4 subset, and (v) myofibroblasts. Crossbars indicate median expression. (E) Single-molecule ISH staining of healthy human colonic tissue showing distribution of S1 markers (ADAMDEC1, DCN, SLIT2, and CXCL12) (left) and S2 markers (F3 (CD142), WNT5A, HSD17B2, WNT5B, POSTN, BMP2, FRZB, BMP5) (right). (F) Identification of SOX6ZEB2+/ZEB1ZEB2+ S1 and SOX6+ZEB2/ZEB1+ZEB2 S2 subsets in healthy human colon. (G) Single (left) and co-staining with CD45 (right) and F3/CD142 (S2), ZEB2 (S1), and SMAD7 (S3) by IHC in colonic sections. The lower far-right panel is a quadruple stain of all 4 markers. (H) Differential expression analysis between S2a and S2b reveals 302 differentially expressed genes. (I) t-SNE plots showing examples of genes differentially expressed between S2a and S2b. (J) GO enrichment terms for S2a and S2b. See also Figures S1–S3 and Tables S1–S4.
Figure S1
Figure S1
Single-Cell Profiling of Human Colonic Stromal Cells Using C1 Fluidigm Platform, Related to Figures 1 and 2 (A) t-SNE visualization of stromal cell clusters obtained from healthy human donors using the C1 Fluidigm platform. (B) Violin plots for the pan-fibroblast marker genes vimentin (VIM) and collagen types 1 and 3 (COL1A2, COL3A1) across clusters detected. (C) Cluster marker gene expression visualized as violin plots. (D) t-SNE visualization of stromal cell clusters obtained from IBD patients using the C1 Fluidigm platform. (E) S4 cluster marker gene visualization. (F) Cluster distribution comparison between inflamed and non-inflamed mucosa. (G) C1 healthy donor cluster marker overlap with 10x healthy donor cluster markers.
Figure S2
Figure S2
Gene Ontology Biological Process Term Enrichment Plots, Related to Figure 1 (A–E) GO enrichment plots for marker genes for (A) Myofibroblasts, (B) Stromal 1 cells, (C) Stromal 2 cells, (D) Stromal 3 Cells, and (E) Stromal 4 cells.
Figure 2
Figure 2
Colonic Mesenchymal Plasticity in IBD (A) t-SNE plot of UC colonic mesenchyme dataset. Single cells colored by cluster annotation. Descriptive cluster labels are shown. (B) Human healthy and UC cluster marker gene overlap correlation heatmap. (C) Selected enriched (FDR < 0.01) GO terms of UC S4 mesenchymal population marker genes. (D) (i) Flow cytometry analysis of CD74 and PDPN expression on colonic stromal cells from Ctrl (right) or UC (left) donors. (ii) Comparison of intracellular CCL19 and IL-33 levels in CD74highPDPNhighCD24high cells (red) versus the corresponding CD74lowPDPNlow subset (blue) in inflamed UC colonic tissue. (E) Flow cytometry analysis of FDCSPhigh and CD24high colonic stromal cells from Ctrl (blue) or UC (red). (F) Single-molecule ISH staining of FDCSP in Ctrl or UC colonic tissue sections. (G) Flow cytometric analysis of SOX6 expression in Ctrl (blue) or UC (red) colonic stromal cells. See also Figures S1 and S3 and Tables S1 and S5.
Figure S3
Figure S3
Flow Cytometry Gating Strategies on Intestinal Stromal Cells from Human Colonic Biopsies, Related to Figures 1 and 2 Representative gating strategies for analyses of EpCAM-CD45-CD31- human colonic stromal subsets. (A) Gating strategies for the detection of nuclear targets. (B) Gating strategies for the detection of cytoplasmic targets.
Figure S4
Figure S4
Murine DSS Challenge, Related to Figures 3 and 4 Colonic stromal cells were isolated from age and sex matched Ctrl mice or mice treated with DSS for 7 days. (A) Ratio of large bowel weight to length by treatment group. Measurements were made post-mortem on study day 7. (B) A composite score of in-life disease activity measures (comprising weight loss, diarrhea and rectal bleeding) for all treatment groups. Group means are indicated (cross-bars). (C) An immunologically specialized fibroblast subset analogous to human Stromal 4 is identified in the murine DSS model. Cross-tabulation of human Stromal 4 marker genes against marker genes for the 8 clusters of fibroblast-like cells identified in the DSS dataset. The number of shared markers and p value (Fisher’s Exact Test) are shown. Color scale −log(p value).
Figure 3
Figure 3
Phylogenetic Tree and Identity of Murine Colonic Mesenchymal Cells in Health (A) t-SNE plot of murine healthy colonic mesenchyme dataset. Single cells colored by cluster annotation. (B) Phylogenetic tree of murine clusters representing inter-cell distances between the average cells for each cluster in gene expression space. (C) Dot plot showing expression of canonical marker genes against detected clusters. Circle size represents the within-cluster probability of gene detection. Fill color represents the normalized mean expression level. Cell-type specificity for each marker is indicated (color bar). Numeric cluster identifiers and corresponding inferred cell types shown (left and right y axis labels). (D) Selected GO terms showing significant enrichment among top marker genes for stromal clusters. The number of markers identified for each cluster indicated (x axis). Circle size corresponds to the proportion of markers annotated to a given term, while the fill color indicates the adjusted p value. (E) t-SNE expression plots of human fibroblast subset markers in the murine dataset. Cells colored by normalized expression of indicated marker genes. The murine cluster with the highest mean expression is indicated (). Left, S1; middle, S2; and right, S3 markers. (F) sm-ISH localization of S2 genes (Bmp2 and Wnt5a). (G) Expression of historical murine colonic fibroblast markers segregated across novel mesenchymal clusters identified by scRNA-seq. (H) Candidate molecular markers for future subset characterization. Specificity of candidate marker genes (x axis) for detected fibroblast subsets. Top: Existing markers. Bottom: New markers showing high subset specificity in this dataset. Circle size represents the within-cluster probability of gene detection. Fill color represents normalized mean expression level. See also Figure S4 and Tables S1 and S6.
Figure 4
Figure 4
Murine Colonic Stromal Cells in Colitis (A) Diffusion component plot for colonic stromal cells from healthy mice. Individual points represent single cells colored by cluster annotation. (B) Projection of pseudo-time (top left) and selected gene expression onto diffusion map. (C) t-SNE projection of 3,354 single cells derived from 3 mice following DSS challenge. A random forest classifier trained using the healthy dataset classified cells from DSS-challenged mice. Identities of clusters in the DSS dataset were inferred and are colored by cluster annotation. (D) Phylogenetic tree and identities of murine stromal cell clusters in DSS colitis. Phylogenetic tree represents inter-cell distances between the average cells for each cluster in gene expression space. (E) t-SNE representation of the DSS dataset showing expression of S4 marker genes Il33 and Ccl19. (F) Increased relative abundance of the S3 subset in DSS colitis. The size of each fibroblast cluster (column facets) expressed as a proportion of the total number of cells was compared across three biological replicates for healthy controls (HC) and DSS-challenged mice (DSS). Individual data points, mean, and SD shown. DSS challenge significantly increased the fraction of S3 cells (p = 0.02). (G) Fibroblast subsets show differential proliferative activity on DSS challenge. Cell-cycle-phase annotation for the healthy and DSS datasets using a pre-trained murine cell-cycle classifier (cyclone, “pairs” method). Percentages of cells in G2M phase by cluster (nd, no equivalent cluster detected in dataset). (H) Phylogenetic tree showing similarity between murine colonic mesenchymal stromal subsets and murine stroma obtained from lymphoid tissue. (I) Stromal subsets show differential responses to DSS challenge. Violin plots for indicated genes significantly induced on DSS challenge in S1–3. Individual cells represented as points. Color scale reflects row-normalized mean expression. Crossbars indicate cluster median expression. See also Figure S4 and Tables S1, S7, and S8.
Figure 5
Figure 5
Comparing Murine and Human Colonic Mesenchymal Cells (A) Confusion matrices of human (left) and mouse (right) random forest models applied to independent datasets from the same species and different species show the proportion of real and model-predicted cell cluster identities for healthy control (HC), human UC, or mouse DSS. (B) Human HC model features scored for cluster specificity in human (hS1, hS2, hS3) and mouse (mS1, mS2, mS3) data. The heatmap shows increasingly positive cluster markers in yellow (>0.5) and increasingly negative cluster markers in purple (<0.5), and non-specific genes in green ( = 0.5). The bar plot shows the correlation between mouse and human marker specificity for each cluster. (C) Examples of features that drive the random forest results: MFAP4, IGFBP3, and SOX6. (D) Human and mouse cluster marker gene overlap correlation heatmap. (E) t-SNE plot visualizing sub-cluster analysis of S2 cells from healthy mouse scRNA-seq. Two distinct cell clusters, not previously detected, show similarities to human S2a and S2b counterparts. (F) Wnt5a expression by both S2a- and S2b-like mouse sub-clusters. (G) Violin plots show example S2 markers identified from human data that do not exhibit a conserved expression patterns in mouse S2 subtypes.
Figure 6
Figure 6
CYTOF Analysis of Key Mesenchymal Subset Markers Reveals Colitis-Associated Stromal Remodeling (A) CyTOF panel detected colonic mesenchymal populations. Stromal subsets are represented by indicated markers. (B) Heatmaps of selected markers on concatenated healthy and inflamed t-SNE plots representing key stromal subsets. Color maps by F3 (CD142), POSTN, IL-33, CCL19, BCL6, and PTGS2 shown. (C) Expansion of S4 in UC detected by scRNA-seq. (D) Histogram comparisons of CCL19 and TNFSF14 (LIGHT) levels in healthy versus inflamed colonic mesenchyme marks the emergence of S4. (E) t-SNE comparisons of healthy versus inflamed colonic mesenchyme. Clustering used the following parameters: F3/CD142, POSTN, PDGFRA, PDPN, BCL6, PTGS2, CD55, CCL19, CCL21, IL-33, LIGHT, CLU, FDCSP, and αSMA. Select markers representing S2 and S4 in healthy versus inflamed tissues shown. (F) Graphical summary of the most significantly changed markers in UC. Each dot represents one independent pair of healthy donor and patient samples. See also Figure S5.
Figure S5
Figure S5
CyTOF Gating Strategies on Intestinal Stromal Cells from Human Colonic Biopsies, Related to Figure 6 (A–E) Gating was performed on cells (191Ir+140Ce-) to exclude calibration beads (A), followed by singlets (B), then live cells (C), and CD45-EpCAM-CD31- events (D, E).
Figure 7
Figure 7
Functional Attributes of Crypt Niche and IBD-Associated Mesenchymal Cells (A) Epithelial characterization after in vitro co-culture with and without S2. S2 was isolated by fluorescence-activated cell sorting (FACS) for F3 (CD142). Crypts with (ii) and without (iii) F3+ stromal cells grown in culture containing Rspo1 and assessed for up to 10 days of culture. Representative images from day 4 and day 10 are shown. (i) Normal growth of human colon organoids without any stromal cells. Bar graph shows quantification of organoid complexity during the course of co-culture. (B) (i) Violin plots from the scRNA-seq data showing IL-6 and TNFSF14 (LIGHT) upregulated by S4. (ii) Human colon organoids were treated with 100 ng/mL of either IL-6 or LIGHT. Confocal immunofluorescence images show EdU-labeled nuclei (red) and total nuclei stained with DAPI (blue). Epithelial proliferative capacity was assessed by quantification of the total numbers of EdU positive nuclei and DAPI-stained nuclei to calculate the fraction of proliferating cells in a section of interest. For each experiment, 15 random fields were quantified for each treatment. n = 3 independent experiments. ∗∗p < 0.0001, p < 0.001 Mann-Whitney U test. (C) Real-time qPCR measured stem cell markers (LGR5, OLFM4, AXIN2, NOTCH1, and ALDH1A1) and CDX2 gene expression after treatment of human colon organoids with IL-6 or LIGHT for 4 days in the presence of Wnt containing medium. (D) Real-time qPCR measured stem cell marker (LGR5, OLFM4, AXIN2, ALDH1A1, MSI1, and SOX9) and differentiation marker (KRT20, MUC2, and CDX2) gene expression after treatment of human colon organoids with IL-6 or LIGHT for 4 days in the presence of Wnt containing medium, with subsequent Wnt withdrawal and treatment with IL-6 and LIGHT for another 4 days. (E) OLFM4 gene expression from scRNA-seq of over 11,175 single cells isolated from healthy, non-inflamed and inflamed colonic biopsies (i), and gene expression from bulk RNA of inflamed and non-inflamed mucosa of IBD patients compared to healthy control samples. (F) (i) Violin plots of relative gene expression of Lox and Loxl1 in DSS-induced colitis. (ii) Cumulative diarrhea score, blood score, and large bowel weight to length ratio of vehicle-only Ctrls versus BAPN-treated animals. (G) Lipid peroxidation measured by malondialdehyde (MDA) plasma levels of vehicle-only and BAPN-treated animals. Error bars represent the SEM.
Figure S6
Figure S6
Computational Analysis and Batch Effect Assessment, Related to Quantification and Statistical Analysis (A) Identification of cellular barcodes in 10x data was selected as the first local minima across individual samples. Example distribution density and local minimum (dashed line) are shown. (B) Batch effects in the 10x scRNA-seq data. Boxplots show the entropy of batch mixing for each dataset (Batch), compared to a negative (Random) and positive (Control) controls. For each set of data, entropy of batch mixing was computed as in Haghverdi et al., 2018. As negative controls (no batch effect), random batch labels were assigned to each cell. As a set of positive batch controls (each cluster is driven entirely by batch effect), cluster labels were used. In each dataset, the entropy of mixing for the batch effects approaches that of negative control. (C) tSNE plot visualizing the batch distribution in healthy mouse 10x data, corresponding to S2B bottom panel.

References

    1. Angerer P., Haghverdi L., Büttner M., Theis F.J., Marr C., Buettner F. destiny: Diffusion maps for large-scale single-cell data in R. Bioinformatics. 2016;32:1241–1243. - PubMed
    1. Aoki R., Shoshkes-Carmel M., Gao N., Shin S., May C.L., Golson M.L., Zahm A.M., Ray M., Wiser C.L., Wright C.V., Kaestner K.H. Foxl1-expressing mesenchymal cells constitute the intestinal stem cell niche. Cell. Mol. Gastroenterol. Hepatol. 2016;2:175–188. - PMC - PubMed
    1. Bao S., Ouyang G., Bai X., Huang Z., Ma C., Liu M., Shao R., Anderson R.M., Rich J.N., Wang X.F. Periostin potently promotes metastatic growth of colon cancer by augmenting cell survival via the Akt/PKB pathway. Cancer Cell. 2004;5:329–339. - PubMed
    1. Barker N. Adult intestinal stem cells: Critical drivers of epithelial homeostasis and regeneration. Nat. Rev. Mol. Cell Biol. 2014;15:19–33. - PubMed
    1. Bernardo M.E., Fibbe W.E. Mesenchymal stromal cells: Sensors and switchers of inflammation. Cell Stem Cell. 2013;13:392–402. - PubMed

Publication types

MeSH terms

Substances