. 2018 Oct 4;175(2):387-399.e17.
doi: 10.1016/j.cell.2018.08.064. Epub 2018 Sep 27.

RAB11FIP5 Expression and Altered Natural Killer Cell Function Are Associated with Induction of HIV Broadly Neutralizing Antibody Responses

Affiliations

RAB11FIP5 Expression and Altered Natural Killer Cell Function Are Associated with Induction of HIV Broadly Neutralizing Antibody Responses

Todd Bradley et al. Cell. .

Abstract

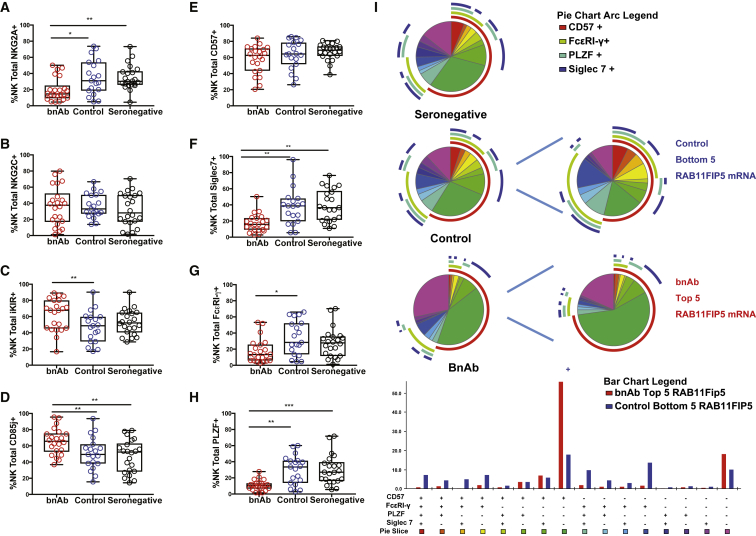
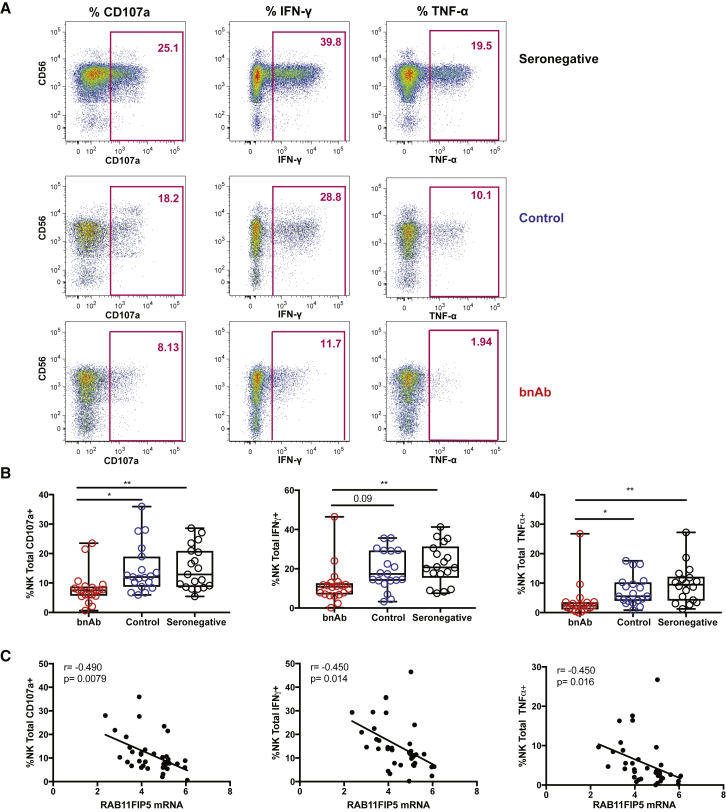
HIV-1 broadly neutralizing antibodies (bnAbs) are difficult to induce with vaccines but are generated in ∼50% of HIV-1-infected individuals. Understanding the molecular mechanisms of host control of bnAb induction is critical to vaccine design. Here, we performed a transcriptome analysis of blood mononuclear cells from 47 HIV-1-infected individuals who made bnAbs and 46 HIV-1-infected individuals who did not and identified in bnAb individuals upregulation of RAB11FIP5, encoding a Rab effector protein associated with recycling endosomes. Natural killer (NK) cells had the highest differential expression of RAB11FIP5, which was associated with greater dysregulation of NK cell subsets in bnAb subjects. NK cells from bnAb individuals had a more adaptive/dysfunctional phenotype and exhibited impaired degranulation and cytokine production that correlated with RAB11FIP5 transcript levels. Moreover, RAB11FIP5 overexpression modulated the function of NK cells. These data suggest that NK cells and Rab11 recycling endosomal transport are involved in regulation of HIV-1 bnAb development.

Keywords: HIV-1; Rab11fip5; broadly neutralizing antibodies; natural killer cells; recycling endosomes; vaccine.


Figures

None
Graphical abstract
Figure S1
Figure S1
RAB11FIP5 Is Significantly Upregulated in Individuals Who Develop bnAbs, Related to Figure 1 (A) Heatmaps of metadata from the cohort of individuals studied. Natural log of geometric mean (ID50) neutralization and mean viral load from sampled time points in addition to sex and age. Age and sex did not differ significantly between the bnAb and control groups. A more detailed description of these subjects and attributes of the larger cohort from which they were selected are provided in Moody et al. (2016). (B) Quantitative PCR for RAB11FIP5 expression from RNA isolated from individuals’ PBMCs. Cohort A bnAb n = 41; Cohort A control n = 25; Cohort B bnAb n = 21; Cohort B control n = 16. P value determined by Wilcoxon-Mann-Whitney. No statistically significant difference between the bnAb and Control group was detected for Cohort B samples alone. (C and D) Representative flow cytometry density plots demonstrating the populations sorted for quantitative PCR and RNA-seq. (E) RAB11FIP5 expression level measured by RNA-seq in immune subsets, the fraction of reads per million of mapped reads (FPM) graphed with SEM.
Figure 1
Figure 1
Upregulation of RAB11FIP5 in bnAb Individuals (A and B) Plots of differential transcript expression in the bnAb group compared with control group (A) and after controlling for age, sex, country, autoantibody status, and viral load (B). Transcripts with p < 0.05 and log (FC) >1 are colored in blue. Transcripts associated with vesicle trafficking are circled. (C) Boxplot of RAB11FIP5 expression levels for each individual in the bnAb (n = 47) and control group (n = 46; t test). (D and E) Spearman correlations of RAB11FIP5 expression (y axis) and neutralization breadth (principal component 1) (D) or viral load (E). bnAb group are in red and control group in blue; solid fill autoantibody positive and open fill autoantibody negative individuals. (F and G) Bar graphs of quantitative PCR of RAB11FIP5 of PBMC, CD19+, CD4+, CD8+ and non-B/T cells (F) and monocytes, NK, pDC and mDC cells (G). BnAb group (n = 3 or 4) shown in blue and control group (n = 3 or 4) shown in red. The groups of HIV-1 infected bnAb and control subjects selected for this analysis were matched for viral load. Group average and SEM shown. See also Figures S1 and S2 and Table S1.
Figure S2
Figure S2
Transcriptome Sequencing of NK Cells from bnAb and Control Individuals, Related to Figure 1 (A) Bar graph of log fold-change of genes downregulated (blue) or upregulated (red) in bnAb subject NK cells (n = 4) compared with control subject NK cells (n = 4) determined by RNA-seq. (B and C) Dot plots of log fragments per kilobase of transcript per million mapped reads for genes in NK cells from bnAb (red) and control groups (blue). Line indicates group mean. Adjusted P values generated by DeSeq2.Values not corrected for viral load.
Figure S3
Figure S3
NK Cell Gating Strategy and NK Cell Frequency, Related to Figure 2 (A) Representative example gated on live CD14-CD19-CD3-CD4- lymphocytes; CD56 and CD16 are used to identify NK cells, discriminating between populations on the basis of CD56bright, dim and negative expression levels. (B) Boxplots of the percentage of NK cells out of live lymphocytes in individuals in the bnAb (red; n = 22), control (blue; n = 19) and HIV-seronegative (black; n = 22) groups. Each symbol represents data from an individual subject and the box-and-whisker plots show the median, quartiles and range. (C) ViSNE map of NK and T cell distribution based on CD3, CD4, CD8, CD56 and CD16 expression from compiled subjects in the bnAb, control and HIV seronegative group. CD4CD3+ T cells are shown in blue, CD8CD3+ T cells in orange, CD56+CD3- NK cells in red and the CD56-CD16+ NK cell subset in green.
Figure 2
Figure 2
More Pronounced NK Cell Subset Redistribution in bnAb versus Control Subjects (A) Representative pseudocolor flow cytometry plots from bnAb, control, and HIV-seronegative individuals showing NK cell subsets distinguished on the basis of CD56 and CD16 expression. Gated on live, CD19CD14CD4CD3 lymphocytes. (B–D) Boxplots of the percentage of NK cells that were CD56bright (B), CD56dim (C), and CD56CD16+ (CD56neg) (D) in individuals in the bnAb (red; n = 22), control (blue; n = 19), and HIV-seronegative (black; n = 19) groups. Each symbol represents data from an individual subject and the box-and-whisker plots show the median, quartiles, and range. p < 0.05, ∗∗p < 0.01, ∗∗∗p < 0.001, ∗∗∗∗p < 0.0001. p values are corrected for multiple comparisons analysis and viral load. (E and F) Spearman correlations of (E) RAB11FIP5 mRNA levels in total PBMC and (F) plasma HIV-1 neutralization breadth (PC1) with the percentage of CD56dim (black) and CD56CD16+ (blue) NK subsets within total NK cells. See also Figure S3 and Table S2.
Figure 3
Figure 3
Increased Frequencies of Mature and Adaptive-like NK Cells in bnAb Subjects (A–H) Boxplots of the percentage of total NK cells expressing NKG2A (A), NKG2C (B), iKIR (cocktail of antibodies against KIR2DL1/S5, KIR2DL2/L3/S2, KIR3DL2, KIR3DL1) (C), CD85j (D), CD57 (E), Siglec7 (F), FcεRI-γ (G), and PLZF (H) in bnAb (red; n = 22), control (blue; n = 19) and HIV seronegative individuals (black; n = 22). Each symbol represents data from an individual subject and the box-and-whisker plots show the median, quartiles, and range. p < 0.05, ∗∗p < 0.01, ∗∗∗p < 0.001. p values are corrected for multiple comparisons analysis and viral load. (I) SPICE (simplified presentation of incredibly complex evaluations) analysis of CD57, FcεRI-γ, PLZF, and Siglec7 receptor combinations on total NK cells in HIV seronegative individuals (n = 22), control (n = 19) and bnAb (n = 22) subjects. SPICE pie charts are shown for seronegative, control and bnAb groups and for individuals with the lowest RAB11FIP5 mRNA (bottom 5; blue; n = 5) in the control group and highest levels of expression of RAB11FIP5 mRNA in total PBMC (top 5; red; n = 5) in the bnAb group. SPICE bar charts depict the proportion of total NK cells expressing the indicated receptor combinations in the top 5 RAB11FIP5 subjects in the bnAb group (red bars) and bottom 5 RAB11FIP5 subjects in the control group (blue bars). Student’s t test was used to compare samples in SPICE. + p < 0.0001. See also Figures S4 and S5.
Figure S4
Figure S4
CD56dim and CD56neg Subset Phenotypic Analysis, Related to Figure 3 (A and B) Summary boxplots of expression of NKG2A, NKG2C, iKIR (cocktail of antibodies against KIR2DL1/S5, KIR2DL2/L3/S2, KIR3DL2, KIR3DL1), CD85j, CD57, FcεRI-γ, PLZF and Siglec7 on CD56dim NK cells and (B) on the CD56neg NK cell subset in bnAb (red; n = 22), control (blue; n = 19) and HIV seronegative individuals (black; n = 22). Each symbol represents data from an individual subject and the box-and-whisker plots show the median, quartiles and range. p < 0.05, ∗∗p < 0.01, ∗∗∗p < 0.001. P values corrected for MCA and viral load.
Figure S5
Figure S5
RAB11FIP5 Transcript in Total PBMC Correlates with Receptor Expression on Total NK Cells, Related to Figure 3 (A–F) Spearman correlation of RAB11FIP5 mRNA levels in total PBMC with total NK cells expression of (A) NKG2A, (B) CD85j, (C) iKIR (cocktail of antibodies against KIR2DL1/S5, KIR2DL2/L3/S2, KIR3DL2, KIR3DL1), (D) Siglec 7, (E) FcεRI-γ, and (F) PLZF. p < 0.05, ∗∗p < 0.01, ∗∗∗p < 0.001. P values corrected for MCA. (G) Plasma antibody binding to HCMV cell lysate antigen or recombinant HCMV gB antigen measured by ELISA and Bio-Rad clinical CMV assay for individuals in the bnAb (blue) and control group (red). Values displayed as log area under the curve. Cutoff for positivity for the IgG and IgM clinical assay was > 1.1.
Figure 4
Figure 4
Decreased Function of NK Cells in bnAb Subjects (A and B) Representative pseudocolor flow cytometry plots from individual seronegative, control, and bnAb groups (A) and summary boxplots for all individuals analyzed in each group (B) showing CD107a expression, IFN-γ production, and TNF-α production by total NK cells following stimulation with MHC class I low target cells. Each symbol represents data from an individual subject and the box-and-whisker plots show the median, quartiles, and range. p < 0.05, ∗∗p < 0.01. p values are corrected for multiple comparisons analysis and viral load (bnAb, n = 20; control, n = 19; seronegative, n = 18 or 19). (C) Spearman correlation of RAB11FIP5 mRNA levels in total PBMC with percentage of total NK cells expressing CD107a, producing IFN-γ, and producing TNF-α in response to target cell stimulation. See also Figure S6.
Figure S6
Figure S6
Functional Analysis of CD56dim and CD56neg NK Subsets and Gating Strategy for Analysis of NK:Tfh:B Cell Co-culture, Related to Figures 4 and 5 (A) Spearman correlation of percentage of total NK cells undergoing degranulation (assessed by CD107a expression) on exposure to target cells with plasma HIV-1 neutralization breadth (PC1). (B and C) Summary boxplots for CD107a expression, IFN-γ and TNF-α production from (B) CD56dim NK cells and (C) CD56neg NK cells following target cell stimulation in bnAb (red), control (blue) and HIV seronegative individuals (black). Each symbol represents data from an individual subject and the box-and-whisker plots show the median, quartiles and range. p < 0.05, ∗∗p < 0.01. P values corrected for MCA and viral load. (D) Class-switched memory B cells were identified as live CD3-CD4-CD56-CD19+IgD-IgM-CD20+CD38+/− cells and plasmablasts as live CD3-CD4-CD56-CD19+IgD-IgM-CD20-CD38+ cells. Tfh cells were identified as live CD3+CD4+CD19-CD56- cells. The division index was calculated using Flowjo software. CountBright absolute counting beads were used to calculate absolute numbers. The staining shown is from a representative subject (Tfh+B cell only condition).
Figure 5
Figure 5
NK Cells Reduce Tfh Numbers and Help for B Cells in an In Vitro Tfh-B Cell Co-culture System Total NK cells and resting CD127hiCD25lowCXCR5+CD4+Tfh cells isolated from the peripheral blood of HIV seronegative donors (n = 6) were activated with IL-2/12/15/18 (NK cells) or SEB (Tfh) then mixed and co-cultured with autologous naive B cells at a B:Tfh:NK ratio of 2:1:5 in the presence of SEB. (A) Representative example of live Tfh cells (gated within CD3+CD4+CD19CD56 cells), class-switched B cells and plasmablasts (both gated within live CD3CD4CD19+IgMIgD cells) in the presence or absence of NK cells measured 6 days later. (B and C) CD4 Tfh numbers (B) and division index (C). (D and E) Numbers of class-switched memory B cells (D) and plasmablasts (E). (F and G) Supernatant levels of total IgM (F) IgG (G). Paired data from Tfh-B cell co-cultures carried out in the presence and absence of NK cells with samples from individual donors are shown. p < 0.05. Wilcoxon matched-pairs signed rank test; p values corrected for multiple comparison analysis. See also Figure S6.
Figure S7
Figure S7
Transcript Expression from Bulk NK Cell RNA-Seq and Cytokine Secretion from Rab11Fip5-Expressing NK-92 Cells Measured by Luminex Assay Together with Analysis of Their Cytolytic Activity, Related to Figures 6 and 7 (A) Median unique molecular identifiers (UMIs) and genes detected per cell in the scRNA-seq datasets. (B) Single-cell RNA-seq analysis was performed on CD56bright, dim and neg NK subsets isolated from a single donor by cell sorting. Violin plots of transcripts significantly upregulated in RAB11FIP5-expressing cells (red) compared to cells not expressing RAB11FIP5 (blue). Data for each NK cell subset is shown separately for significant genes (determined by likelihood ratio test and p ≤ 0.05). Normalized transcript expression is shown on the y axis. (C) NK cells from three HIV-infected donors were sorted into subsets on the basis of CD56 expression and subjected to bulk RNA-seq. Reads were aligned to the human genome (Hg38) and Fragments Per Kilobases of transcript per Million mapped reads (FPKM) were determined for each donor in each subset for IFNG transcript expression. (D) NK-92/RAB11FIP5 transduced cells and NK-92/empty vector control cells were stimulated with 500 ng/ml PMA and 5 μg/ml ionomycin for 2 hours. Supernatants were harvested and levels of GM-CSF, sCD137, IFN-γ, sFas, sFasL, Granzyme A, Granzyme B, IL-2, IL-4, IL-5, IL-6, IL-10, IL-13, MIP-1α, MIP-1β, TNF-α and perforin were analyzed by Luminex assay. All the cytokines in range of the standard curves are shown. Error bars represent standard deviation of quadruplicate wells. Wilcoxon-Mann-Whitney was utilized for statistical analysis. ns, not significant; ∗∗∗p ≤ 0.001. (E) Granzyme B (GzB)-based cytotoxicity assays performed using NK-92/RAB11FIP5 (red) or NK-92/ZsGreen control (blue) cells as effectors and K562 cells as targets at different effector:target ratios. The percentage of cells positive for proteolytically active GzB is represented as % GzB activity. Data from 3 individual experiments, each of which was were performed in triplicate, are shown.
Figure 6
Figure 6
High RAB11FIP5-Expressing Cells Are Enriched in the CD56CD16+ NK Cell Subset (A and B) Non-linear dimensionality reduction by t-distributed stochastic neighbor embedding and visualization of single-cell RNA-seq of sorted NK cell subsets (CD56bright, 2,891; CD56dim, 7,674; CD56negative, 11,677) showing (A) all cells and (B) RAB11FIP5 expressing cells. Each dot represents a single cell. (C) Dot plot of RAB11FIP5 expression in single cells in each NK cell subset. Normalized expression value of RAB11FIP5 shown on y axis. Proportion of cells with detectable RAB11FIP5 expression shown above. (D) Violin plots of transcripts significantly (likelihood ratio test; p < 0.05) upregulated in RAB11FIP5-expressing cells (red) compared to cells not expressing RAB11FIP5 (blue). Normalized transcript expression is shown on the y axis. p values for each transcript are also shown. See also Figure S7 and Table S3.
Figure 7
Figure 7
Overexpression of Rab11Fip5 in NK-92 Cells Increases Cytokine and Granzyme Release (A) Effect of Rab11Fip5 overexpression on IFN-γ production and degranulation (CD107a expression) of NK-92 cells in response to stimulation with PMA/ionomycin. NK-92/Rab11Fip5 (red symbols) and NK-92/ZsGreen cells (blue symbols) were stimulated with 500 ng/mL PMA and 5 μg/mL ionomycin for 2 hr in the presence of a CD107a antibody and the protein transport inhibitor monensin. Dots represent MFIs from 6 replicate wells. Significance determined by Wilcoxon-Mann-Whitney (ns, not significant; ∗∗p < 0.01). (B) Granzyme B (GzB)-based cytotoxicity assays performed using NK-92/Rab11Fip5 (red) or NK-92/ZsGreen control (blue) cells as effectors and K562 cells as targets at different effector:target ratios. The percentage of cells positive for proteolytically active GzB is represented as % GzB activity. The average values from 3 independent experiments performed in triplicate are shown. (C) Western blot of Rab11Fip5 expression in NK-92 cells transduced with a RAB11FIP5 expression vector or zsGreen vector control, in the presence or absence of K562 target cell stimulation (5:1 effector:target ratio). Cells were analyzed at 10 hr post stimulation. GAPDH used as protein loading control. See also Figure S7.

References

    1. Akesson C., Uvebrant K., Oderup C., Lynch K., Harris R.A., Lernmark A., Agardh C.D., Cilio C.M. Altered natural killer (NK) cell frequency and phenotype in latent autoimmune diabetes in adults (LADA) prior to insulin deficiency. Clin. Exp. Immunol. 2010;161:48–56. - PMC - PubMed
    1. Alter G., Teigen N., Davis B.T., Addo M.M., Suscovich T.J., Waring M.T., Streeck H., Johnston M.N., Staller K.D., Zaman M.T. Sequential deregulation of NK cell subset distribution and function starting in acute HIV-1 infection. Blood. 2005;106:3366–3369. - PubMed
    1. Anders S., Pyl P.T., Huber W. HTSeq--a Python framework to work with high-throughput sequencing data. Bioinformatics. 2015;31:166–169. - PMC - PubMed
    1. Béziat V., Descours B., Parizot C., Debré P., Vieillard V. NK cell terminal differentiation: correlated stepwise decrease of NKG2A and acquisition of KIRs. PLoS ONE. 2010;5:e11966. - PMC - PubMed
    1. Björkström N.K., Ljunggren H.G., Sandberg J.K. CD56 negative NK cells: origin, function, and role in chronic viral disease. Trends Immunol. 2010;31:401–406. - PubMed

Publication types

MeSH terms