. 2018 Oct 8;34(4):643-658.e5.
doi: 10.1016/j.ccell.2018.08.018. Epub 2018 Sep 27.

HOXA9 Reprograms the Enhancer Landscape to Promote Leukemogenesis

Affiliations

HOXA9 Reprograms the Enhancer Landscape to Promote Leukemogenesis

Yuqing Sun et al. Cancer Cell. .

Abstract

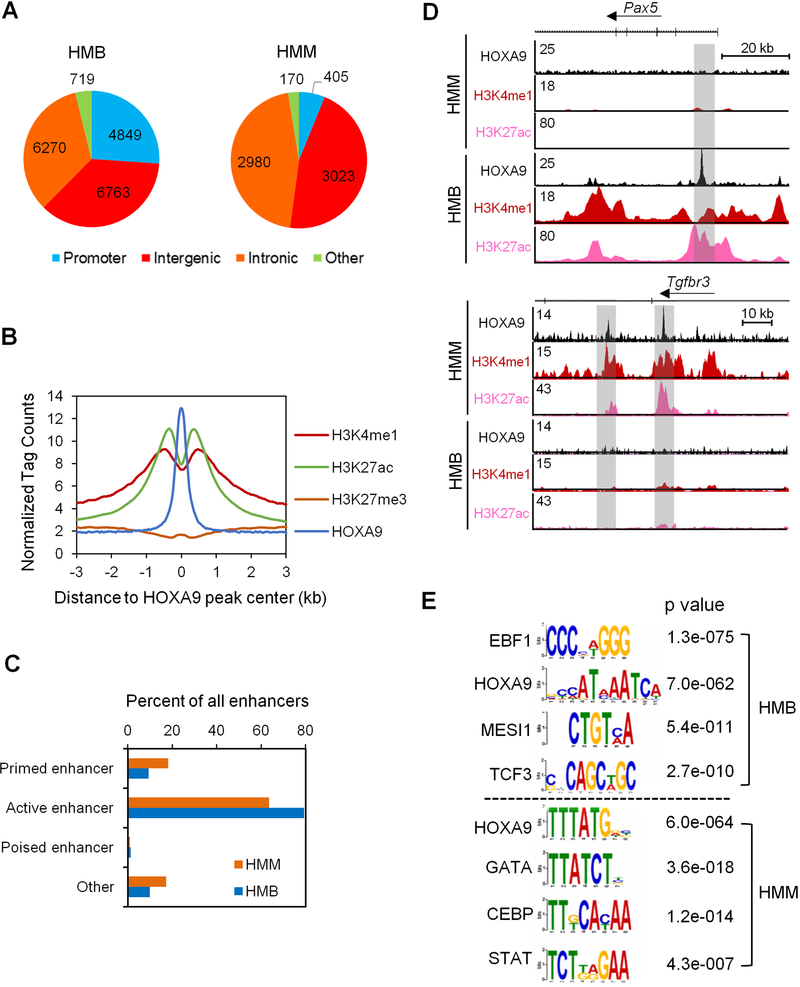
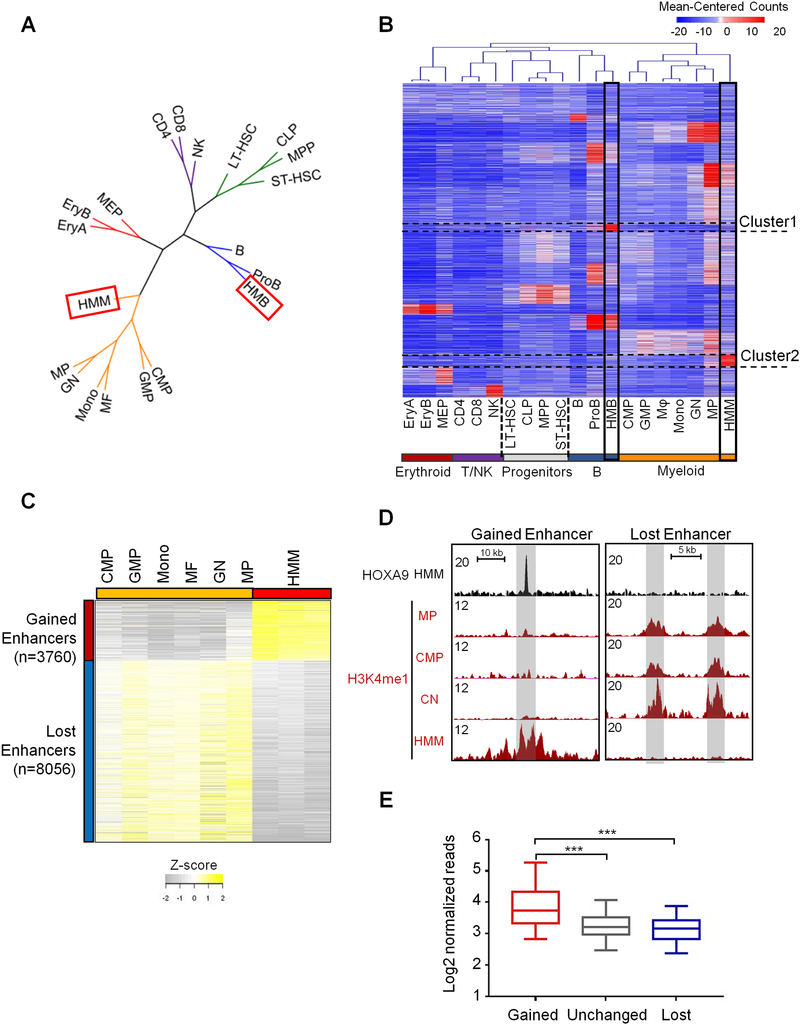
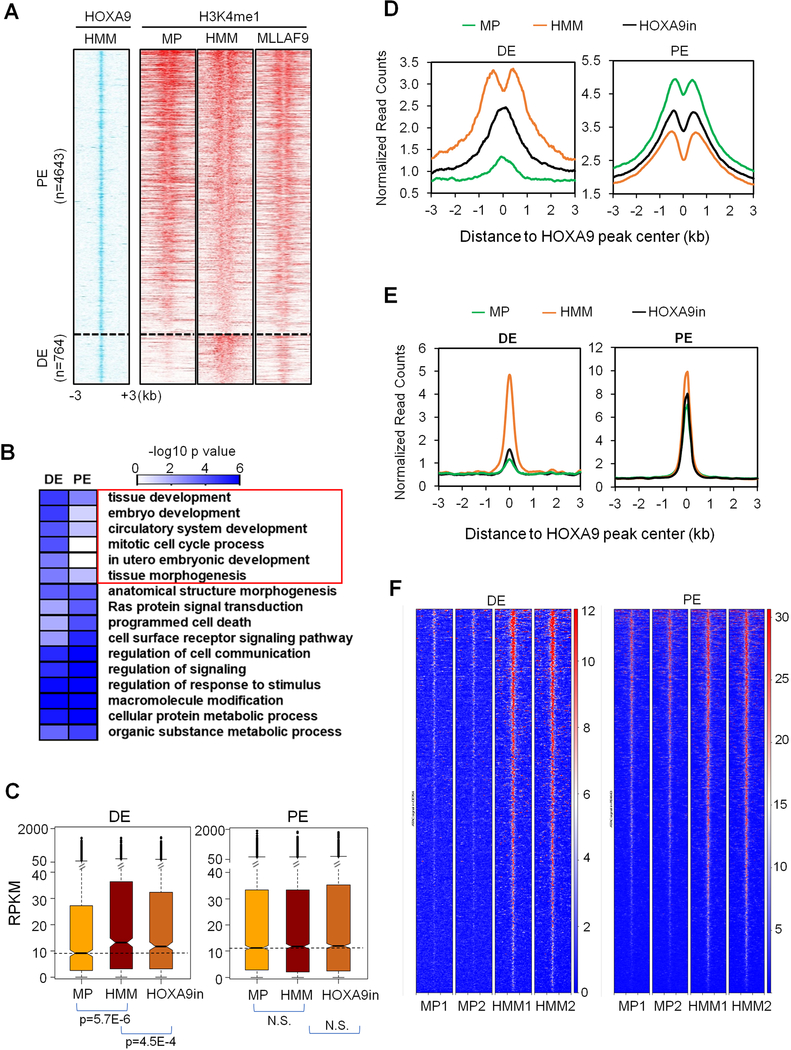
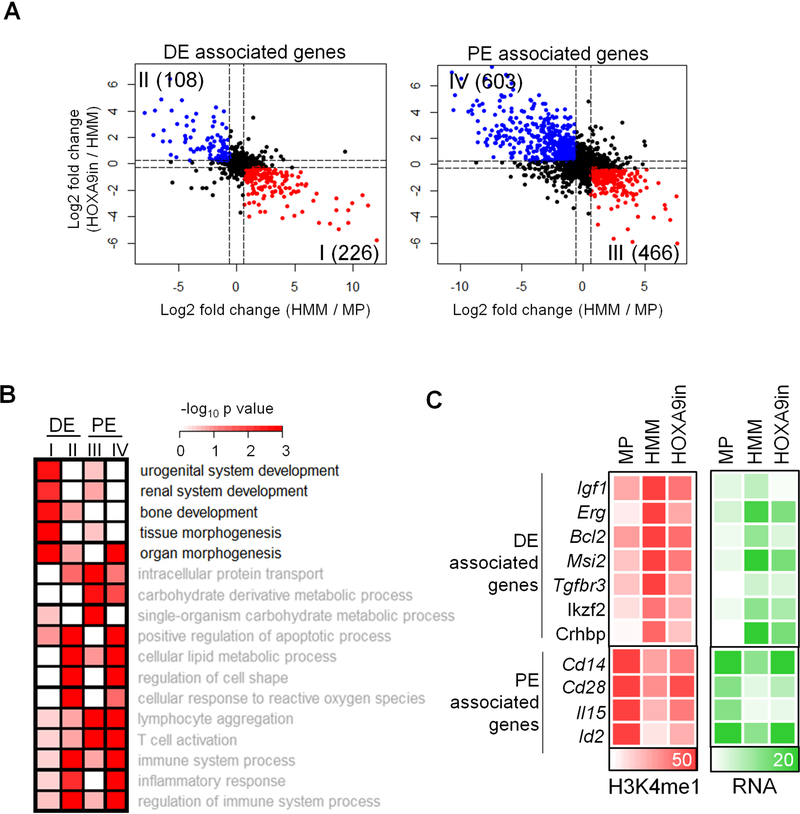
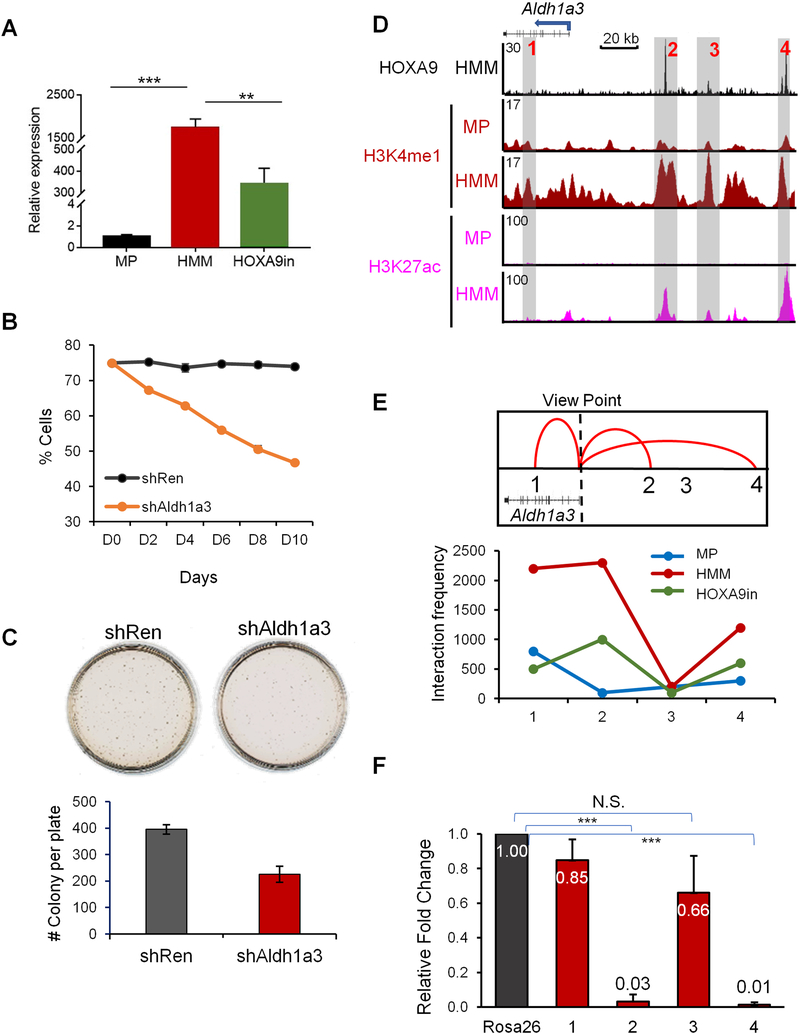
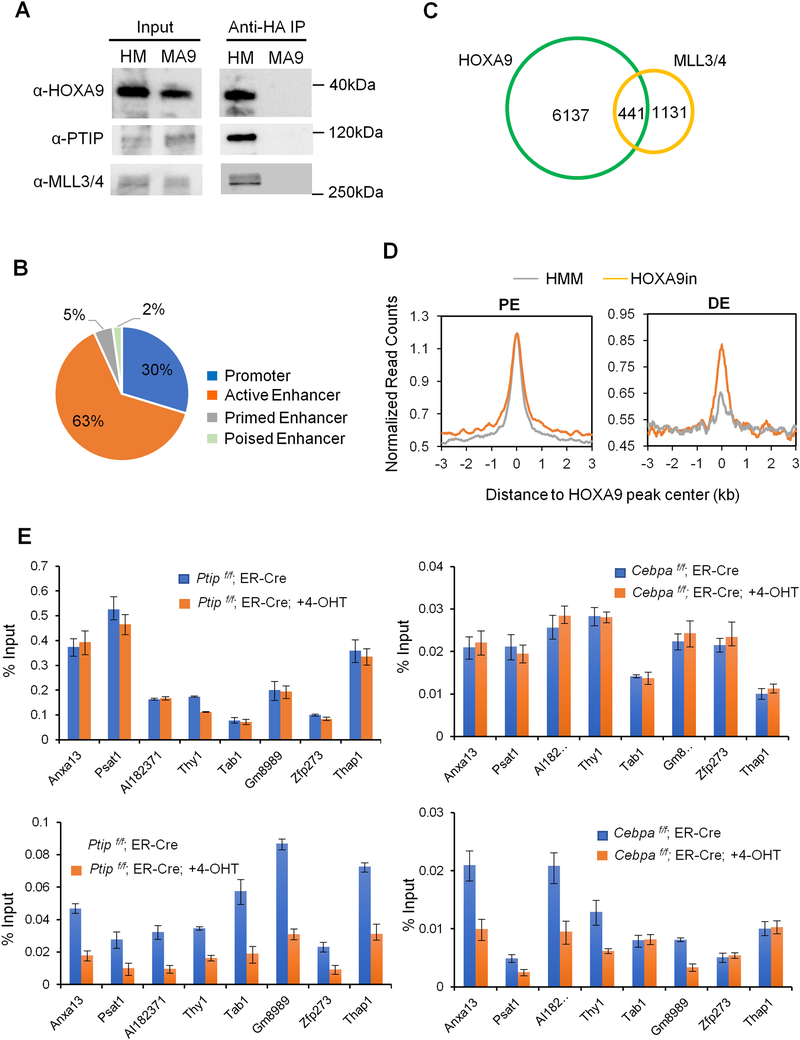
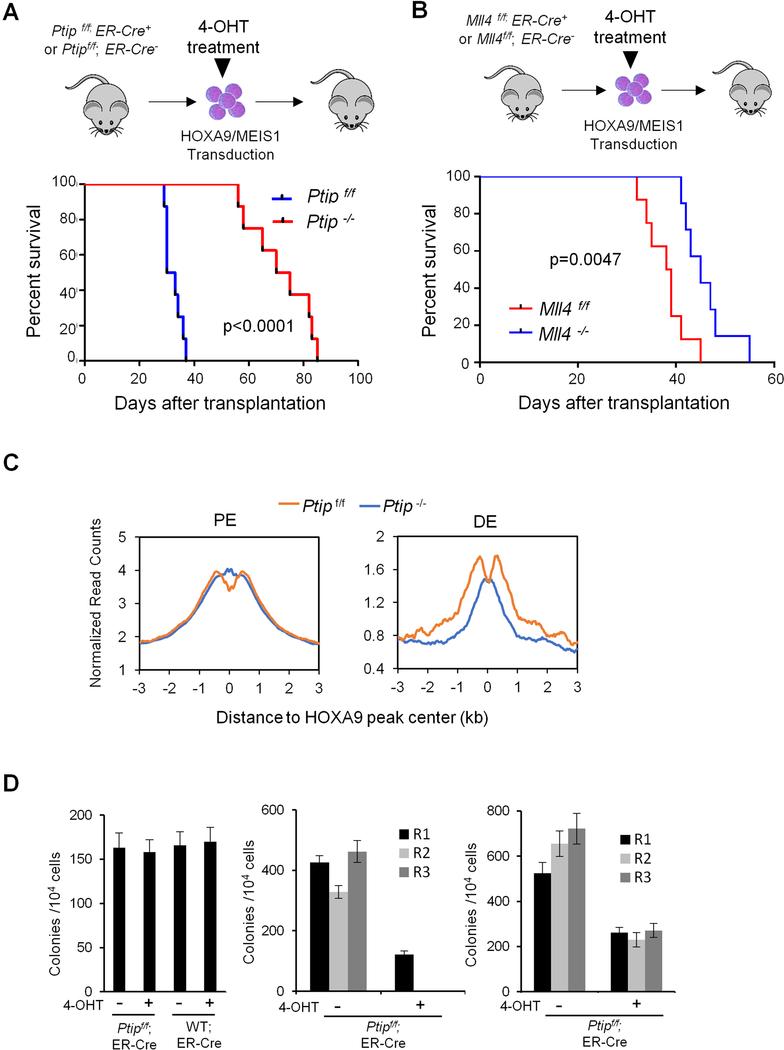
Aberrant expression of HOXA9 is a prominent feature of acute leukemia driven by diverse oncogenes. Here we show that HOXA9 overexpression in myeloid and B progenitor cells leads to significant enhancer reorganizations with prominent emergence of leukemia-specific de novo enhancers. Alterations in the enhancer landscape lead to activation of an ectopic embryonic gene program. We show that HOXA9 functions as a pioneer factor at de novo enhancers and recruits CEBPα and the MLL3/MLL4 complex. Genetic deletion of MLL3/MLL4 blocks histone H3K4 methylation at de novo enhancers and inhibits HOXA9/MEIS1-mediated leukemogenesis in vivo. These results suggest that therapeutic targeting of HOXA9-dependent enhancer reorganization can be an effective therapeutic strategy in acute leukemia with HOXA9 overexpression.

Keywords: HOXA9; KMT2; MLL; acute leukemia; de novo enhancer; epigenetics; histone methylation; pioneer factor; transcription factor.


Conflict of interest statement

DECLARATION OF INTERESTS

There are no competing interests.

Figures

Figure 1.
Figure 1.. HOXA9 binds to active enhancers in HMM and in HMB cells.
(A) Genomic distribution of HOXA9 in HMB cells (left) and HMM cells (right). (B) Composite plot for average ChIP-seq signal density per base pair for HOXA9, H3K4me1, H3K27ac and H3K27me3 at HOXA9 binding sites in HMM cells. Library size was normalized to 107 reads. (C) Percentage distribution of various enhancers in HMM and HMB cells as indicated on left. Promoter, −2 kb to +1 kb of transcription start site (TSS); active enhancer, H3K4me1 and H3K27ac; primed enhancer, H3K4me1 and H3K27me0; poised enhancer, H3K4me1 and H3K27me3; others, H3K4me0 and H3K27me0. (D) UCSC browser view of HOXA9 binding and histone modifications at two representative gene loci Pax5 and Tgfbr3, which are important regulators of B cells and myeloid cell differentiation respectively. (E) Motif analysis for 6,578 and 18,601 HOXA9 peaks in HMM and HMB cells, respectively. See also Figures S1 and S2.
Figure 2.
Figure 2.. HOXA9/MEIS1-mediated transformation reshapes the enhancer landscape of the leukemia cells.
(A) Clustering dendrogram of cell types based on H3K4me1 profiles to show association of HMM and HMB cells with cells in the myeloid branch and proB cells, respectively. Color code: green for multipotent progenitors, orange for myeloid lineage (including oligopotent common myeloid progenitors (CMP), granulocyte-macrophage (GMP) and differentiated myeloid cells, blue for B lineage, red for erythroid lineage, and purple for T and NK cells. (B) Heat map for 101,413 H3K4me1 marked enhancers for cells as indicated on bottom. H3K4me1 signal was clustered with K-means (K=16) using the normalized read counts at each enhancer region. Cluster 1 and Cluster 2 de novo enhancers were highlighted. (C) Heat map for 11,816 differentially enriched H3K4me1 regions between HMM cells and normal myeloid cells. Cut-off: FDR < 0.05. (D) UCSC browser views of H3K4me1 profiles on representative genomic loci in CMP, GN, MP and HMM cells. Gained (left) and lost (right) enhancers are shaded in grey. (E) Average HOXA9 ChIP-seq tag density at gained, lost and unchanged enhancers as indicated on bottom. Mann-Whitney U-test was used for statistical analysis. Line, median; box, interquartile range (25%–75%); whiskers, 5 and 95 percentiles; ***, p<0.001. See also Figure S2.
Figure 3.
Figure 3.. HOXA9 regulates two distinct classes of enhancers.
(A) Heat map for HOXA9 ChIP-seq signal in HMM cells as well as corresponding H3K4me1 ChIP-seq signals in MP, HMM and MLLAF9 cells. Numbers of PE and DE were indicated on left. The rows show 3 kb regions flanking the HOXA9 peak center. Peaks were sorted by total normalized H3K4me1 tag counts within each category. (B) Gene Ontology analysis on biological processes for genes annotated to PE and DE by GREAT. Heat map key indicated the Benjamini p values. DE-specific pathways were highlighted. (C) Transcriptional activity (RPKM) of PE and DE-associated genes in MP, HMM and HOXA9in cells, respectively. Line, median; box, interquartile range (25%–75%); whiskers, 1.5 interquartile range above and below median; circles, outlier data points. p values were calculated by Mann-Whitney U-test. N.S., no significance. (D) Composite plots for H3K4me1 ChIP-seq signals at DE and PE in MP, HMM and HOXA9in cells. (E) Composite plots for CEBPα ChIP-seq signals at DE and DE in MP, HMM and HOXA9in cells. (F) ATAC-seq for HOXA9 bound DE or PE in two independent MP or HMM cell lines. See also Figures S3-S5 and Table S1.
Figure 4.
Figure 4.. HOXA9 regulates ectopic gene expression program via DE.
(A) Expression changes in genes annotated to DE or PE are shown in the scatter plots. X-axis, log2 fold change in HMM vs. MP cells; Y-axis, log2 fold change in HOXA9in vs HMM cells. Red: genes that are significantly up regulated in HMM cells and down regulated in HOXA9in cells. Blue: Genes that are significantly down regulated in HMM cells and up regulated in HOXA9in cells. (B) Gene Ontology analysis on biological processes associated with groups I, II, III and IV genes as defined in 4A. Benjamin p value was indicated by heat map key. (C) Heat map for normalized read counts of H3K4me1 and RPKM of representative genes in groups I and IV as indicated on left. If multiple enhancers were annotated to the same gene, the nearest enhancer to the promoter was selected for visualization. See also Table S2.
Figure 5.
Figure 5.. Long distance transcription regulation by HOXA9 at Aldh1a3 loci.
(A) Real-time PCR for Aldh1a3 mRNA in MP, HMM and HOXA9in cells. Expression of Aldh1a3 was normalized against GAPDH and presented as fold change relative to its level in MP cells, which was arbitrarily set as 1. Means and standard deviations (error bars) from at least three independent experiments were presented. ***, p<0.0001, **, p<0.001, student t test. (B) Competitive proliferation assay. Percentage of Aldh1a3 shRNA or non-targeting Renilla shRNA positive cells in liquid culture was counted by flow cytometry over 10 days. (C) CFU-assay in methylcellulose after Aldh1a3 or control knockdown. Error bars represent standard deviations from at least three replicates. (D) UCSC browser view of HOXA9, H3K4me1 and H3K27ac at genomic regions near Aldh1a3. Three HOXA9-bound DE (regions 2, 3 and 4) as well as HOXA9-independent region 1 were highlighted, see text for details. (E) 4C-seq analysis for interaction between Aldh1a3 TSS and four regions highlighted in D. Aldh1a3 TSS was used as the view point. Top, summary of the confirmed interactions to TSS; Bottom, interaction frequencies of region 1–4 (as indicated on bottom) with TSS in different cell lines. (F) Real time PCR for Aldh1a3 expression after CRISPR-mediated deletion of regions 1–4 defined in D. Expression level of Aldh1a3 was normalized against GAPDH and presented as fold change relative to its level in control cells with deletion of Rosa26-promoter, which was arbitrarily set as 1. Means +/− standard deviation, which was represented by error bars, from at least three independent experiments were presented. See also Figure S6.
Figure 6.
Figure 6.. HOXA9 directly recruits the MLL3/MLL4 complex to DE.
(A) Co-immunoprecipitations performed with anti-HA antibody in HMM (HA-HOXA9) and MLL-AF9 (MA9) leukemia cells. Immunoblots for HOXA9, PTIP and MLL3/MLL4 were shown as indicated on left. (B) Distribution of MLL3/MLL4 at promoter or enhancers in HMM cells. Percentage of MLL3/MLL4 peaks in each category was included. (C) Venn diagram showing overlap between HOXA9 and MLL3/MLL4 peaks. (D) Composite plots for normalized counts of MLL3/MLL4 ChIP-seq on PE (top) and DE (bottom) in HMM and HOXA9in cells. (E) ChIP experiments using antibodies as indicated on top. Signals for each experiment were normalized to 1% input. Means and standard deviations (as error bars) from at least three independent experiments were presented. See also Figure S6 and Table S3.
Figure 7.
Figure 7.. The MLL3/MLL4 complex is essential for HOXA9-mediated leukemogenesis.
(A) Schematic for the in vivo mouse experiment (top) and survival curve for mice transplanted with HOXA9/MEIS1 Ptipf/f (blue) or Ptip−/− (red) cells (bottom). Log-rank test was used for statistical analysis, p<0.0001. (B) Experimental schematic (top) and survival curve for mice transplanted with HOXA9/MEIS1 Mll4f/f (blue) or Mll4−/− (red) cells (bottom). Log-rank test was used for statistical analysis. (C) Composite plots for H3K4me1 signals at PE) and DE in bone marrow cells isolated from recipient mice at 30 days post-transplantation. (D) CFU-assay in methylcellulose for normal bone marrow (BM) cells (left), MLL-AF9 (middle) or E2A-HLF (right) cells with or without Ptip deletion as indicated on top. Normal BM cells were plated for one round. Leukemia cells were serially plated for three rounds (R1, R2, R3). Means and standard deviations (as error bars) from at least three independent experiments were presented. See also Figure S7.

References

    1. Alharbi RA, Pettengell R, Pandha HS, and Morgan R (2013). The role of HOX genes in normal hematopoiesis and acute leukemia. Leukemia 27, 1000–1008. - PubMed
    1. Argiropoulos B, and Humphries RK (2007). Hox genes in hematopoiesis and leukemogenesis. Oncogene 26, 6766–6776. - PubMed
    1. Armstrong SA, Staunton JE, Silverman LB, Pieters R, den Boer ML, Minden MD, Sallan SE, Lander ES, Golub TR, and Korsmeyer SJ (2002). MLL translocations specify a distinct gene expression profile that distinguishes a unique leukemia. Nat Genet 30, 41–47. - PubMed
    1. Barbieri I, Tzelepis K, Pandolfini L, Shi J, Millan-Zambrano G, Robson SC, Aspris D, Migliori V, Bannister AJ, Han N, et al. (2017). Promoter-bound METTL3 maintains myeloid leukaemia by m(6)A-dependent translation control. Nature 552, 126–131. - PMC - PubMed
    1. Beh CY, El-Sharnouby S, Chatzipli A, Russell S, Choo SW, and White R (2016). Roles of cofactors and chromatin accessibility in Hox protein target specificity. Epigenetics Chromatin 9, 1. - PMC - PubMed

Publication types

Substances