. 2018;13(8):808-821.
doi: 10.1080/15592294.2018.1514232. Epub 2018 Sep 29.

Age-dependent methylation in epigenetic clock CpGs is associated with G-quadruplex, co-transcriptionally formed RNA structures and tentative splice sites

Affiliations

Age-dependent methylation in epigenetic clock CpGs is associated with G-quadruplex, co-transcriptionally formed RNA structures and tentative splice sites

Andigoni Malousi et al. Epigenetics. 2018.

Abstract

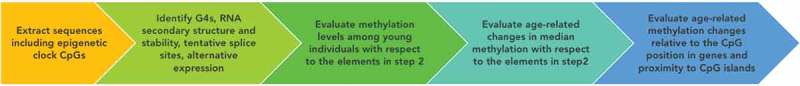
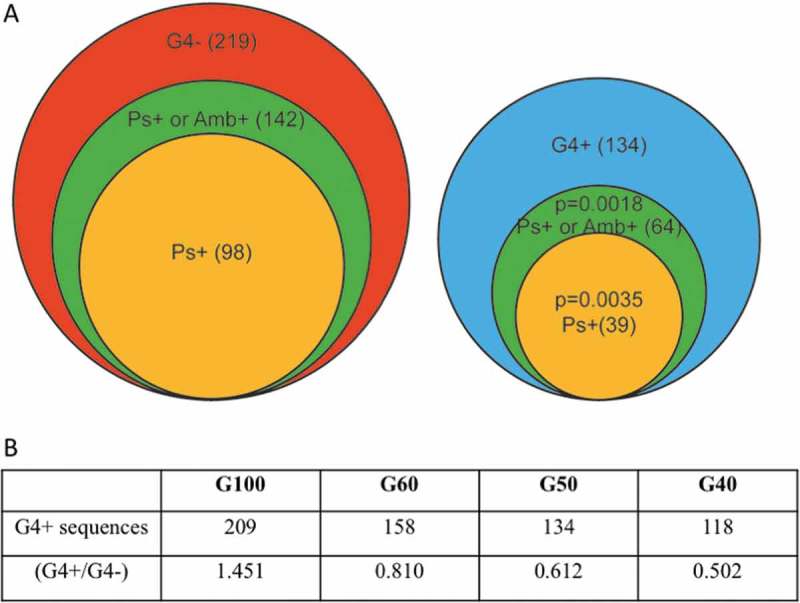
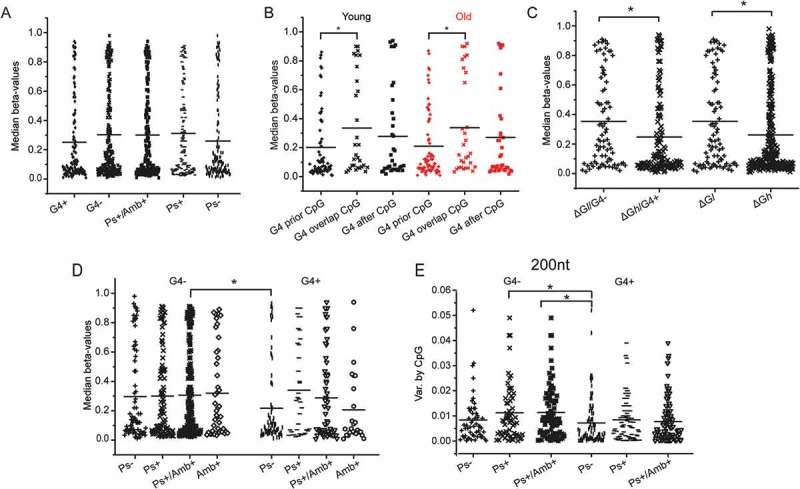
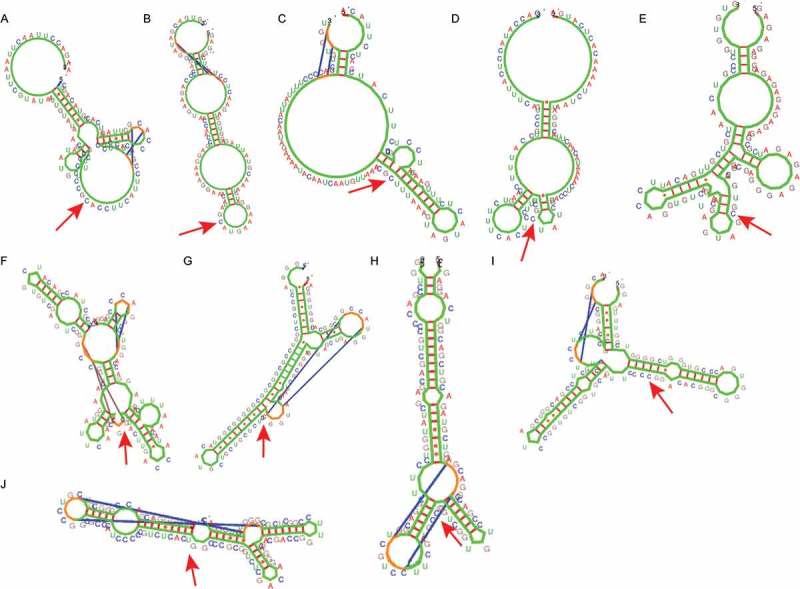
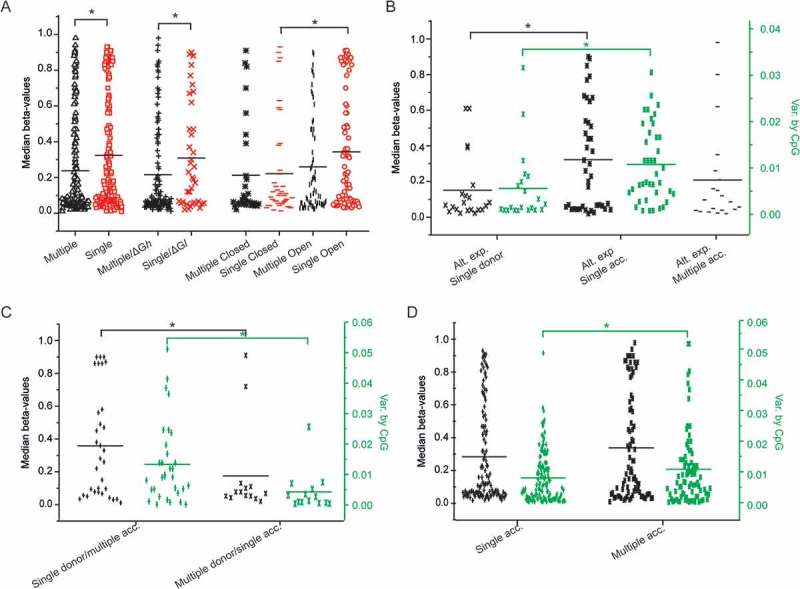
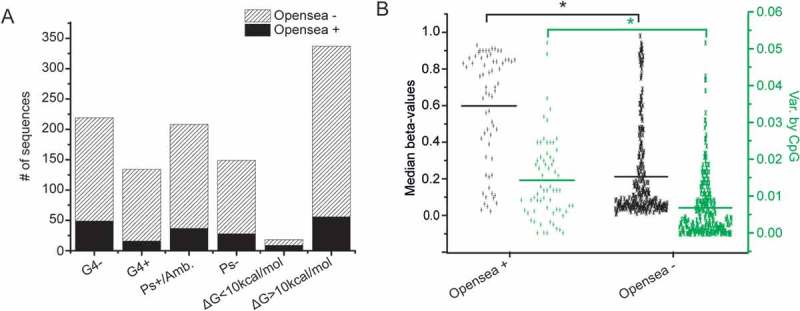
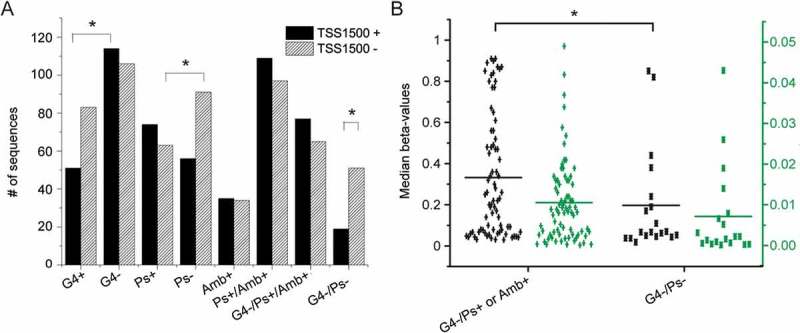
Horvath's epigenetic clock consists of 353 CpGs whose methylation levels can accurately predict the age of individuals. Using bioinformatics analysis, we investigated the conformation, energy characteristics and presence of tentative splice sites of the sequences surrounding the epigenetic clock CpGs, in relation to the median methylation changes in different ages, the presence of CpG islands and their position in genes. Common characteristics in the 100 nt sequences surrounding the epigenetic clock CpGs are G-quadruplexes and/or tentative splice site motifs. Median methylation increases significantly in sequences which adopt less stable structures during transcription. Methylation is higher when CpGs overlap with G-quadruplexes than when they precede them. Median methylation in epigenetic clock CpGs is higher in sequences expressed as single products rather than in multiple products and those containing single donors and multiple acceptors. Age-related methylation variation is significant in sequences without G-quadruplexes, particularly those producing low stability nascent RNA and those with splice sites. CpGs in sequences close to transcription start sites and those which are possibly never expressed (hypothetical proteins) undergo similar extent of age-related median methylation decrease and increase. Preservation of methylation is observed in CpG islands without G-quadruplexes, contrary to CpGs far from CpG islands (open sea). Sequences containing G-quadruplexes and RNA pseudoknots, determining the recognition by H3K27 histone methyltransferase, are hypomethylated. The presented structural DNA and co-transcriptional RNA analysis of epigenetic clock sequences, foreshadows the association of age-related methylation changes with the principle biological processes of DNA and histone methylation, splicing and chromatin silencing.

Keywords: DNA methylation; G-quadruplex; aging; alternative splicing; co-transcriptionally formed RNA structures; epigenetic clock; hypothetical proteins; tentative splice sites.


Figures

Figure 1.
Figure 1.
Sequence of tasks for evaluating the association of age-related methylation deviation in epigenetic clock CpGs with the presence G-quadruplexes, co-transcriptionally formed RNA characteristics, and the presence of tentative splice sites close to the epigenetic clock CpGs.
Figure 2.
Figure 2.
A Number of sequences forming pseudoknots (Ps+), or ambivalent sequences (Amb+, sequences predicted to assume both pseudoknot and non-pseudoknot conformations of < 1kcal/mol difference between the most stable non-pseudoknot conformation and the next less stable pseudoknot conformation), in sequences predicted to form G4s (G4+, right) or without G4s (G4-, left) among the epigenetic clock sequence ensemble (± 50 nt from clock CpGs, G50). B Number of sequences containing G-quadruplexes in different sequence sizes and the corresponding ratio of G4+/G4- sequences. P values obtained by chi-squared test.
Figure 3.
Figure 3.
Dot plots indicating the median CpG methylation and methylation variance by CpG in: A. Young individuals with respect to the propensity of the surrounding sequence (CpG ± 50 nt) to form G4s (G4+) and pseudoknots (Ps), or ambivalent sequences (Amb+), B. Young (black) and old (red) individuals with respect to the relative the positions of CpG and G4s in the surrounding sequence (CpG ± 50 nt), C. Young individuals with respect to the relative folding stability and propensity of the surrounding sequence (± 50 nt) to form G4s (ΔGl < 16.35 kcal/mol, ΔGh > 16.35 kcal/mol), D. Young individuals with respect to the combined presence of G4 and pseudoknots in the surrounding sequence (CpG ± 50 nt). E. Variance of methylation by CpG relative to the sequence propensity to form G4s, identified in different sequence lengths (± 50 nt and ± 100 nt). Statistically significant differences by Student’s t-test are shown by *.
Figure 4.
Figure 4.
Characteristic Kinefold structures of ± 50 nt next to the methylation site. Structures (A-E). ΔGl, open-sea sequences, G4-; A, C, D: methylation decrease by aging; B, E: methylation increase by aging. Structures (F-J). G4+, Ps- (according to Hotknots), ΔGh (> 18.14), methylation decrease by aging. The arrows indicate the epigenetic clock CpGs.
Figure 5.
Figure 5.
Dot plots of median methylation and methylation variance by CpG among young individuals relative to the sequence expression, the energy of the transcript, its conformational characteristics and the presence of tentative splice sites. A. Dot plots of CpG methylation in sequences predicted to be alternatively (black) or singly (red) expressed in relation to their propensity to form G4s and Pseudoknots (G4-/Ps+: open conformation, G4+/Ps-: closed conformation) and the relative folding stability (ΔGl, ΔGh) of the corresponding transcript. B. Dot plots of median CpG methylation (black) and methylation variance by CpG (green) in sequences containing single tentative donors (no acceptors) and single or multiple acceptors (no donors), C. Dot plots of median CpG methylation (black) and methylation variance by CpG (green) in sequences containing different combinations of tentative splice sites. D. Dot plots of median CpG methylation (black) and methylation variance by CpG (green) in sequences containing single acceptors and multiple acceptors regardless of the presence of donors. Statistically significant differences by Student’s t-test are shown by *.
Figure 6.
Figure 6.
Open sea sequences. A. Frequency of G4, pseudoknots and relative low folding stability of the corresponding transcripts in open sea and non-open sea sequences (P values obtained by chi-squared test). B. Dot plots of median methylation and methylation variance by CpG in open sea and non-open sea sequences among young individuals. Statistically significant differences by Student’s t-test are shown by *.
Figure 7.
Figure 7.
Characteristics of the 1500 nt regions upstream transcription start sites (TSS1500). A. Frequency of G4, Pseudoknots, ambivalent motifs and their combinations (P values obtained by chi-squared test) in sequences predicted (black) or not (striped) to be loci of transcription initiation. B. Dot plots of median methylation (black) and methylation variance by CpG (green) among young individuals in TSS sequences with ‘open’ or ‘closed’ conformation. Statistically significant differences by Student’s t-test are shown by *.

References

    1. Ashapkin VV, Kutueva LI, Vanyushin BF.. Aging as an epigenetic phenomenon. Curr Genomics. 2017;18:385–407. - PMC - PubMed
    1. Sutherland H, Macartney-Coxson D, Griffiths L, et al. Methylome ‐ wide association study of whole blood DNA in the Norfolk Island isolate identifies robust loci associated with age. Aging (Albany NY). 2017;9:753–766. - PMC - PubMed
    1. Kato N, Loh M, Takeuchi F, et al. Trans-ancestry genome-wide association study identifies 12 genetic loci influencing blood pressure and implicates a role for DNA methylation. Nat Genet. 2015;47:1282. - PMC - PubMed
    1. Rönn T, Volkov P, Gillberg L, et al. Impact of age, BMI and HbA1c levels on the genome-wide DNA methylation and mRNA expression patterns in human adipose tissue and identification of epigenetic biomarkers in blood. Hum Mol Genet. 2015;24:3792–3813. - PubMed
    1. Johnson KC, Houseman EA, King JE, et al. Normal breast tissue DNA methylation differences at regulatory elements are associated with the cancer risk factor age. Breast Cancer Res. 2017;19:1–11. - PMC - PubMed

Substances