. 2018 Sep 13:11:333.
doi: 10.3389/fnmol.2018.00333. eCollection 2018.

Inhibition of Casein Kinase 2 Protects Oligodendrocytes From Excitotoxicity by Attenuating JNK/p53 Signaling Cascade

Affiliations

Inhibition of Casein Kinase 2 Protects Oligodendrocytes From Excitotoxicity by Attenuating JNK/p53 Signaling Cascade

Manuel Canedo-Antelo et al. Front Mol Neurosci. .

Abstract

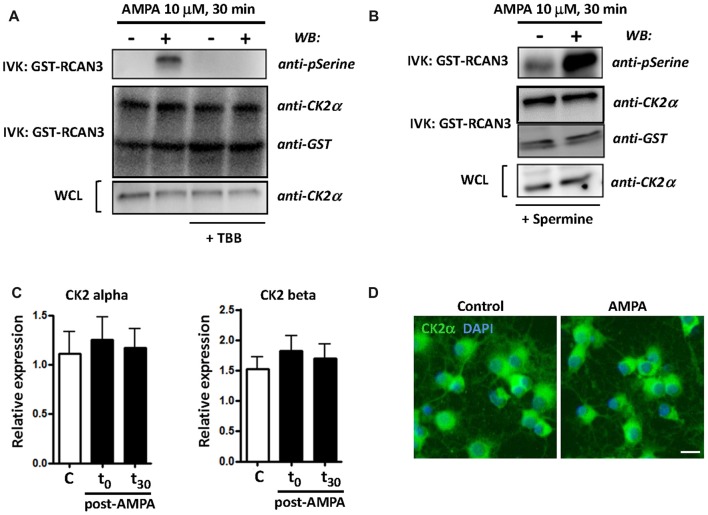
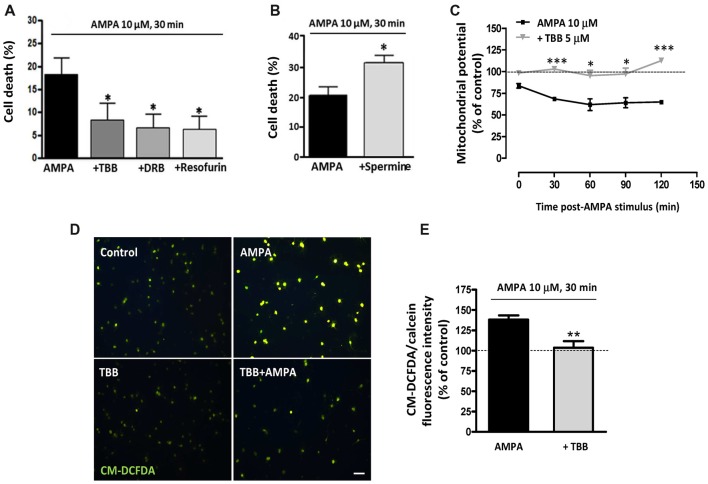
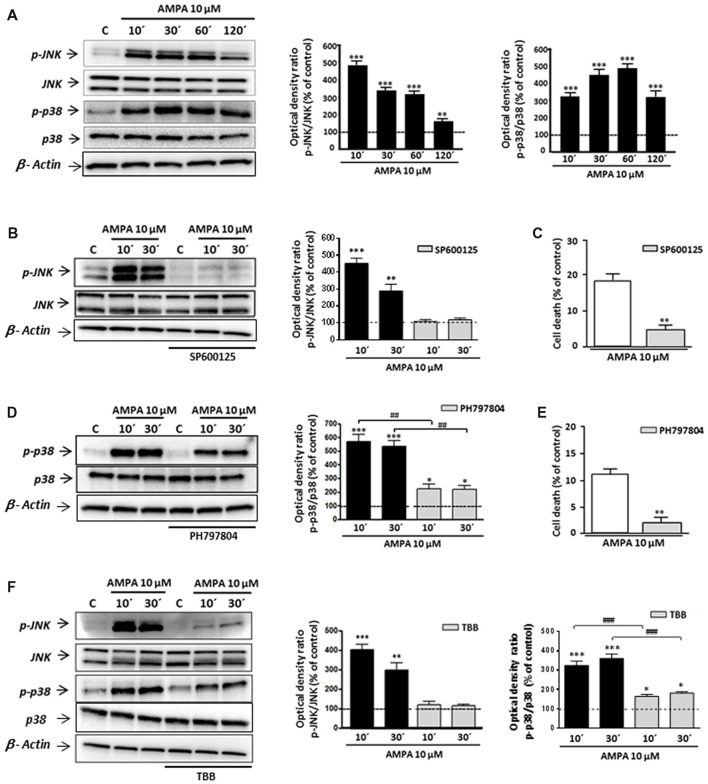
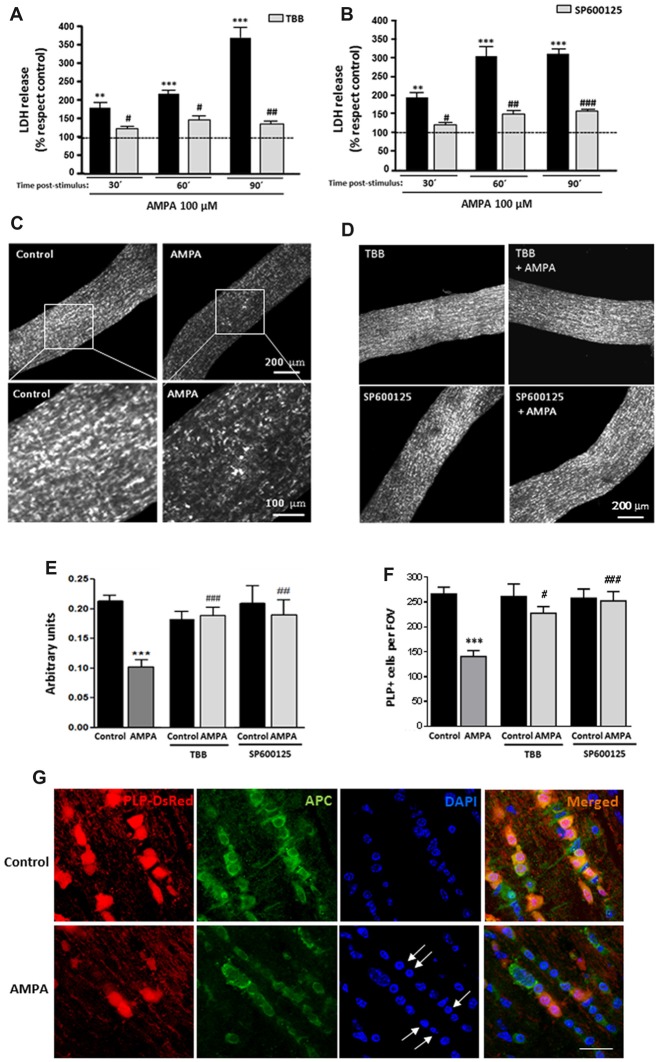
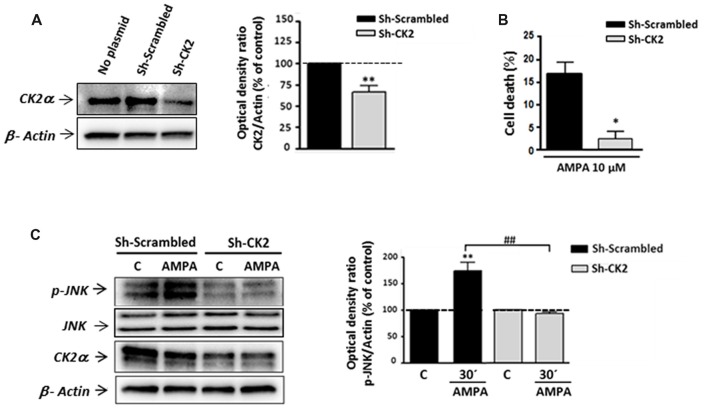
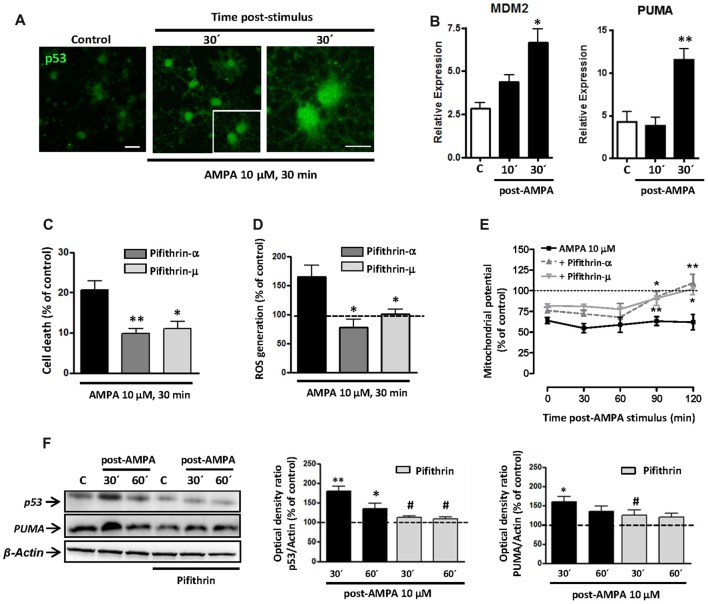
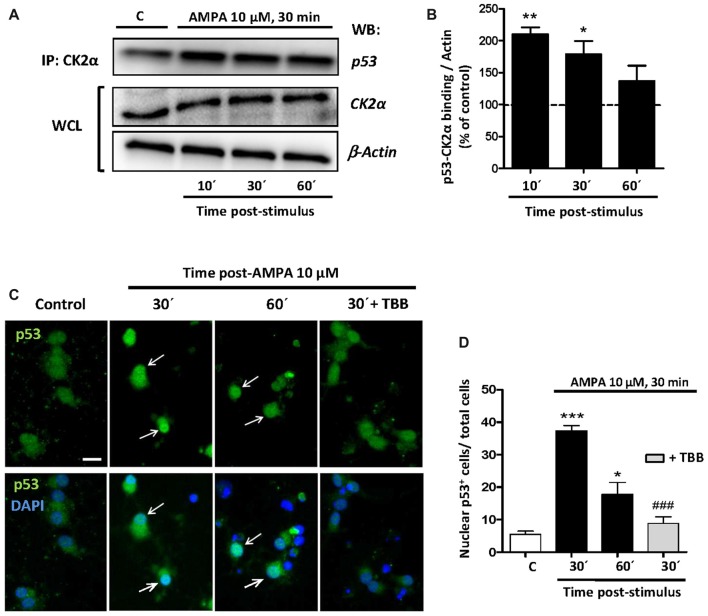
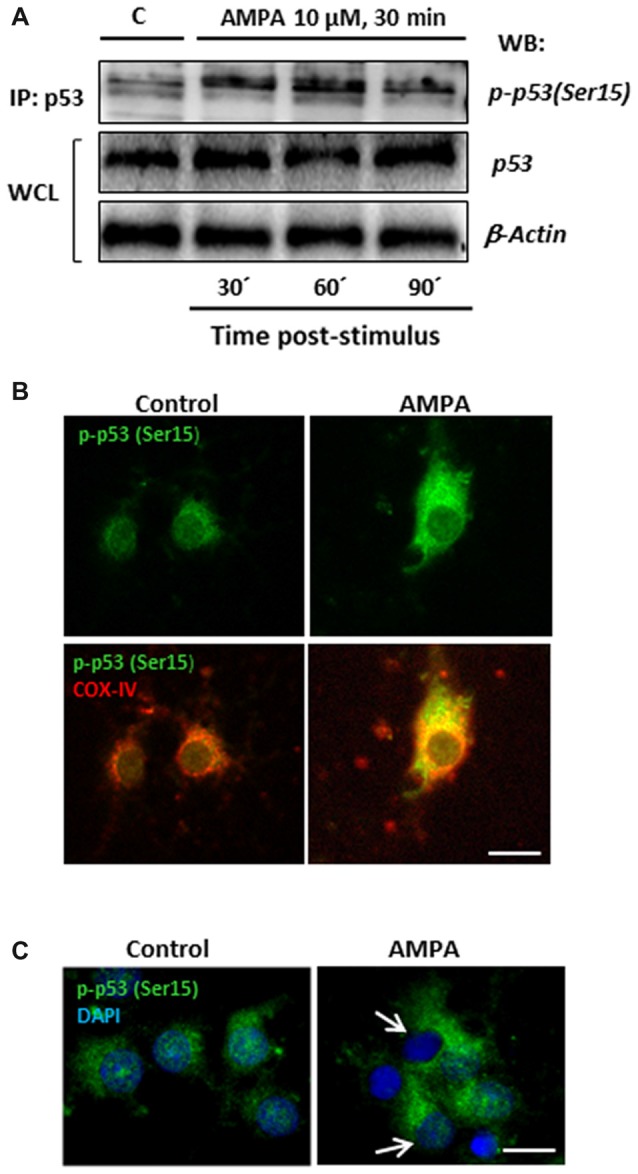
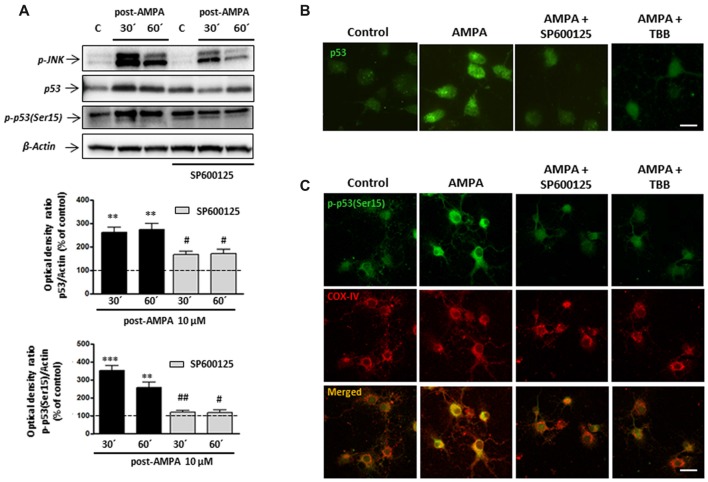
Oligodendrocytes are highly vulnerable to glutamate excitotoxicity, a central mechanism involved in tissue damage in Multiple Sclerosis (MS). Sustained activation of AMPA receptors in rat oligodendrocytes induces cytosolic calcium overload, mitochondrial depolarization, increase of reactive oxygen species, and activation of intracelular pathways resulting in apoptotic cell death. Although many signals driven by excitotoxicity have been identified, some of the key players are still under investigation. Casein kinase 2 (CK2) is a serine/threonine kinase, constitutively expressed in all eukaryotic tissues, involved in cell proliferation, malignant transformation and apoptosis. In this study, we identify CK2 as a critical regulator of oligodendrocytic death pathways and elucidate its role as a signal inductor following excitotoxic insults. We provide evidence that CK2 activity is up-regulated in AMPA-treated oligodendrocytes and CK2 inhibition significantly diminished AMPA receptor-induced oligodendroglial death. In addition, we analyzed mitogen-activated protein kinase (MAPK) signaling after excitotoxic insult. We observed that AMPA receptor activation induced a rapid increase in c-Jun N-terminal kinase (JNK) and p38 phosphorylation that was reduced after CK2 inhibition. Moreover, blocking their phosphorylation, we enhanced oligodendrocyte survival after excitotoxic insult. Finally, we observed that the tumor suppressor p53 is activated during AMPA receptor-induced cell death and, interestingly, down-regulated by JNK or CK2 inhibition. Together, these data indicate that the increase in CK2 activity induced by excitotoxic insults regulates MAPKs, triggers p53 activation and mediates subsequent oligodendroglial loss. Therefore, targeting CK2 may be a useful strategy to prevent oligodendrocyte death in MS and other diseases involving central nervous system (CNS) white matter.

Keywords: AMPA receptor; CK2; apoptosis; c-Jun N-terminal kinase (JNK); excitotoxicity; mitogen-activated protein kinase (MAPK); oligodendrocyte; p53.


Figures

Figure 1
Figure 1
AMPA receptor stimulation increases casein kinase 2 (CK2) activity in oligodendrocytes. Cultured rat oligodendrocytes obtained from mixed glial cultures were pre-incubated with 5 μM TBB (A) or 10 μM spermine (B) and the excitotoxic insult (10 μM AMPA plus 100 μM CTZ) was performed for 30 min. In all cases, cells were lysed after 30 min post-stimulus. (A,B) CK2 was immunoprecipitated with 2 μg of anti-CK2α antibody and in vitro CK2 phosphorylation assay was performed using recombinant GST-RCAN3 in presence of 200 μM ATP (as described in “Materials and Methods” section). Immunocomplexes were subjected to in vitro kinase assay (IVK) followed by SDS-PAGE/immunoblotting (western blot, WB) and kinase activity were visualized using anti-phosphoserine antibody. In addition, the amount of CK2α and GST-RCAN3 present in each immunocomplex and the expression level of CK2α in whole cell lysates (WCL) were also determined by WB. Results are representative of three independent experiments. (C) mRNA for CK2α and CK2β subunits was analyzed by real-time qPCR, and relative expression of mRNA is shown. Analyses were performed in cultured oligodendrocytes treated with AMPA for 30 min and then mRNA was immediately extracted (t0) or 30 min later (t30). The data showed no significant modifications in CK2 expression levels at the time points evaluated. Values represent mean ± SEM (n = 3). (D) Immunofluorescence analysis of CK2α expression in cultured oligodendrocytes. Untreated control cells and treated for AMPA receptor activation were processed for CK2 immunofluorescence using the anti-CK2α antibody described before (green), and nuclei were stained with DAPI (blue). The staining was performed at 30 min post-stimulus and it could be observed that exposure to AMPA did not cause significant changes in CK2α protein expression levels, compared with control cells. Scale bar, 10 μm.
Figure 2
Figure 2
CK2 inhibition protects rat oligodendrocytes from AMPA excitotoxic insults. Oligodendrocyte cultures were isolated from mixed glial culture and used for toxicity assays after 2 days in vitro in differentiation SATO medium. (A) Activation of AMPA receptors with 10 μM AMPA applied together with 100 μM cyclothiazide for 30 min, caused oligodendroglial cell death as measured by calcein-AM assay 24 h later. AMPA-induced cytotoxicity was significantly reduced in presence of CK2 inhibitors, 5 μM TBB, 5 μM DRB or 5 μM resofurin and none of these CK2 inhibitors produced alterations in the oligodendrocyte viability when they were used without AMPA (data not shown). The data are shown as mean ± SEM (n ≥ 4; *p < 0.05 compared with cells treated with AMPA). (B) Pretreatment of cells with CK2 activator spermine (10 μM) increased cytotoxic consequences derived from AMPA receptor activation in oligodendrocytes. Bars represent mean ± SEM (n ≥ 3; *p < 0.05 compared with cells treated with AMPA). (C) CK2 inhibitor TBB attenuated loss of mitochondrial membrane potential induced by activation of AMPA receptors. Oligodendrocytes were exposed to 10 μM AMPA for 30 min in absence or presence of TBB (5 μM; 3 h pretreatment) and mitochondrial membrane potential was quantified by fluorimetry at the indicated times post-AMPA stimulus, after loading cells with dye JC-1 (3 μM, Molecular Probes). Decrease of mitochondrial potential triggered by excitotoxic insult was not observed in oligodendrocytes pretreated with 5 μM TBB. The data are represented as mean ± SEM compared with untreated control cells for each time point analyzed (n ≥ 4; *p < 0.05, ***p < 0.001). (D,E) ROS generation induced by activation of AMPA receptors was limited in the presence of CK2 inhibitor TBB. Oligodendrocytes were treated similarly as described above and ROS generation was determined immediately afterwards using the dye CM-DCFDA (10 μM, Molecular Probes). Cells were observed under fluorescence microscopy (D) and quantification of signal was measured using a Synergy-HT fluorimeter (E). Histogram shows that levels of ROS induced by AMPA were attenuated in oligodendrocytes pretreated with TBB. Data represent mean ± SEM (n = 3; **p < 0.01, compared with cells treated only with agonist).
Figure 3
Figure 3
AMPA-induced c-Jun N-terminal kinase (JNK)/p38 apoptotic activation depends on CK2 activity. Oligodendrocytes were treated with 10 μM AMPA for 30 min, in the presence of 100 μM CTZ, and total lysates were harvested at the indicated times. When indicated, the stimulus was performed in the presence of the corresponding inhibitor. (A) Activation of AMPA receptors triggered an early and potent increase in the JNK and p38 phosphorylation levels at 10, 30, 60 and 120 min after AMPA treatment, determined by WB analysis. (B,D) The early AMPA-induced activation of JNK and p38 was prevented by the presence of 1 μM inhibitor SP600125 or PH797804, respectively. (C,E) The inhibition of JNK or p38 by SP600125 or PH797804, significantly reduced cell death induced by AMPA receptor activation in oligodendrocytes. (F) Intense JNK and p38 phosphorylation induced by exposure to AMPA was significantly reduced in the presence of CK2 inhibitor (TBB; 5 μM) at both times analyzed (10 and 30 min post-stimuli). *p < 0.05, **p < 0.01, ***p < 0.001 (cells treated with AMPA vs. control cells); ##p < 0.01, ###p < 0.001 (cells treated with each mitogen-activated protein kinases (MAPKs) inhibitor vs. cells treated with only AMPA).
Figure 4
Figure 4
AMPA provokes oligodendroglial damage in isolated optic nerves from PLP-DsRed transgenic mice. Isolated optic nerves from PLP-DsRed transgenic mice were preincubated in artificial CSF medium in absence or presence of TBB (25 μM; 3 h) or SP600125 (20 μM; 1 h) and subjected to excitotoxic insult by stimulation of AMPA receptors (100 μM CTZ plus 100 μM AMPA) during 2 h. (A,B) Lactate dehydrogenase (LDH) release quantification at 30, 60 and 90 min post-stimulus showed that TBB or SP600125 pre-treated optic nerves exhibited a significant reduction in LDH release at all post-stimulus times analyzed. **p < 0.005; ***p < 0.0001 (optic nerves treated with AMPA vs optic nerves control); #p < 0.05; ##p < 0.01; ###p < 0.001 (vs. optic nerves treated only with AMPA). (C,D) Representative fields of z-stacks of optic nerves from PLP-DsRed transgenic mice control or stimulated with AMPA alone (C) or in presence of inhibitors TBB or SP600125 (D). Note a loss of oligodendrocytes in optic nerves exposed to AMPA, which was prevented by incubation of agonist in presence of TBB or SP600125. (E) Quantification of the fluorescence signal emitted by oligodendrocytes of optic nerves from P25 PLP-DsRed mice, expressed as arbitrary units of fluorescence. ***p < 0.001 (optic nerves treated with AMPA vs. optic nerves control); ##p < 0.01, ###p < 0.001 (vs. optic nerves treated only with AMPA). (F) Cell counts of PLP+ oligodendrocytes were performed and data were represented as mean number of cells (±SEM, n > 4 animals) in a constant volume (FOV), as detailed in “Materials and Methods” section. ***p < 0.001 (optic nerves treated with AMPA vs. optic nerves control); #p < 0.05, ###p < 0.001 (vs. optic nerves treated only with AMPA). Both quantifications show that oligodendrocyte loss induced by AMPA excitotoxic insult was inhibited by the presence of TBB or SP600125 inhibitors. (G) Optic nerves from PLP-DsRed transgenic mice were processed for immunofluorescence using antibodies to APC and nuclei were stained with DAPI. Treatment with AMPA induced a dramatic fluorescence loss in both PLP and APC oligodendroglial markers, indicating severe oligodendrocyte damage. In addition, DAPI labeling revealed nuclei condenzation in AMPA-treated optic nerves (arrows). Scale bar 20 μm.
Figure 5
Figure 5
Gene silencing of CK2 mimics its pharmacological inhibition with pro-survival effects on oligodendrocytes exposed to AMPA. Isolated oligodendrocytes from mixed glial cultures were immediately transfected with Sh-Scrambled or Sh-CK2 (as described in “Materials and Methods” section) and then were maintained in culture until used. (A) WB analysis of endogenous CK2α expression in lysates of non-transfected cells (no plasmid) and cells transfected with shRNAs directed at CK2 (Sh-CK2) or the control sequence (Sh-Scrambled). Sh-CK2 reduced the expression of CK2 compared with non-transfected cells or transfected with control shRNA. The analysis of the β-actin was performed as an internal load control. **p < 0.01 (vs. Sh-Scrambled transfected cells). (B) Transfected oligodendrocytes were exposed to usual excitotoxic conditions (10 μM CTZ for 30 min), and cell viability was assayed 24 h later using calcein-AM. Knocking down-CK2 cells are less vulnerable to AMPA-induced cell death than Sh-Scrambled transfected cells. *p < 0.05 (vs. Sh-Scrambled transfected cells treated with agonist). (C) WB analysis of JNK phosphorylation state in transfected oligodendrocytes after excitotoxic insults. Cells were transfected with Sh-Scrambled or Sh-CK2, maintained in control situation or treated with AMPA (10 μM, 30 min) and subjected to western blotting with specific antibodies against phospho-JNK, total JNK, CK2α and β-actin, 30 min post-stimulus. Quantification shows that JNK phosphorylation by AMPA exposure was significantly blocked in Sh-CK2 transfected cells as compared to Sh-Scrambled transfected cells, without changing expression levels of total JNK. Detection of CK2α in these samples corroborated that expression of kinase was notably reduced in Sh-CK2 transfected oligodendrocytes. Analysis of β-actin was performed as an internal load control. **p < 0.01 (vs. control situation without AMPA treatment); ##p < 0.01 (vs. Sh-Scrambled transfected cells treated with agonist).
Figure 6
Figure 6
AMPA excitotoxic insult induces p53 stabilization and transcriptional activation in oligodendrocytes, which is inhibited by pifithrin. Oligodendrocytes were exposed to 10 μM AMPA together with 100 μM CTZ for 30 min. (A) Immunofluorescence analysis of p53 expression. After AMPA receptor activation, at 30 min post-stimulus, cells were processed for p53 immunofluorescence using the p53 (FL-393) antibody, which recognized total p53. Exposure to AMPA triggered a notable increase in the expression of total p53 (green). Scale bar, 20 μm (left and central images); 10 μm (right image). (B) RT-PCR analysis for expression of p53 transcriptional targets, MDM2 and PUMA, showed a significant rise in their relative expression in cultured oligodendrocytes after AMPA receptor activation. (n ≥ 3; *p < 0.05, **p < 0.01 respect to untreated control cells). (C) AMPA-induced excitotoxicity was significantly reduced in the presence of p53 inhibitors, pifithrin-β (20 μM) or pifithrin-μ (1 μM), preincubated for 1 h before the activation of AMPA receptors. (*p < 0.05, **p < 0.01, respect to cells treated only with AMPA). (D) ROS generation triggered by activation of AMPA receptors was attenuated by p53 inhibitors. Oligodendrocytes were exposed to 10 μM AMPA for 30 min in absence or presence of pifithrin and ROS level was immediately determined using the dye CM-DCFDA (10 μM, Molecular Probes) and measuring the signal in a Synergy-HT fluorimeter. Results showed that levels of ROS induced by AMPA were attenuated in oligodendrocytes pretreated with both pifithrin-α or pifithrin-μ. Data represent mean ± SEM (n = 3; *p < 0.05, compared with cells treated only with agonist). (E) In addition, mitochondrial membrane potential was quantified by fluorimetry at different times after AMPA stimulus, by loading cells with dye JC-1 (3 μM, Molecular Probes). Mitochondrial depolarization induced by excitotoxic insult was attenuated in pifithrin-α and pifithrin-μ pre-treated oligodendrocytes, as compared with cells treated only with agonist. Data are represented as mean ± SEM compared with cells treated only with AMPA for each time point analyzed (n ≥ 3; *p < 0.05; **p < 0.01). (F) Oligodendrocytes were preincubated with pifithrin-μ (1 μM) before AMPA receptor activation and total protein was collected 30 and 60 min later for WB analysis. The presence of p53 inhibitor pifithrin-μ during excitotoxic signals reduced p53 and PUMA accumulation induced by AMPA. The analysis of β-actin was performed as an internal load control and was used to quantify the expression level of p53 and PUMA in each condition. (*p < 0.05, **p < 0.01 respect to control cells; #p < 0.05 respect to cells treated only with AMPA).
Figure 7
Figure 7
CK2 directly interacts with p53 under conditions of AMPA-induced excitotoxicity in oligodendrocytes. (A) Oligodendrocytes in culture were subjected to excitotoxic insult and cell lysates were obtained at 10, 30 and 60 min after AMPA receptor activation. Co-immunoprecipitation assays were performed in the presence of rabbit polyclonal anti-CK2α antibody (IP: CK2α) and the immunoprecipitates were analyzed by WB using a mouse anti-p53 antibody. CK2α and β-actin were measured as internal loading controls in WCL. The image corresponds to one representative co-immunoprecipitation assay where it is observed that activation of AMPA receptors in oligodendrocytes provokes a direct interaction between CK2 and p53. (B) Quantification of p53-CK2α binding after co-immunoprecipitation assay in the experimental conditions indicated (n = 3; *p < 0.05; **p < 0.01 respect to control). (C) Immunofluorescence analysis of total p53 expression after AMPA receptors activation in absence or presence of CK2 inhibitor TBB. After AMPA treatment, oligodendrocytes were fixed, processed for immunofluorescence with an anti- total p53 antibody (p53 FL-393; green) and nuclei were stained with DAPI (blue). Images show that the increase in p53 activation and its translocation to the nuclei, examples indicated by arrows, was reduced by the CK2 inhibitor TBB. Scale bar, 10 μm. (D) Quantification of the number of p53 nuclear events determined by counting the cells with p53 in DAPI-positive region as fraction of total cells present in each condition. Cell counts were performed on a minimum of 10 independent fields (30 fields/3 coverslips/treatment) of images captured with a 20× objective, and all experimental conditions were always paired with corresponding internal controls (*p < 0.05; ***p < 0.001 respect to control; ###p < 0.001 respect to AMPA after 30 min).
Figure 8
Figure 8
AMPA leads to sustained p53 activation through its phosphorylation in Ser15 and its mitochondrial accumulation. (A) Immunoprecipitation assays were performed in cultured oligodendrocytes after AMPA receptor activation with 10 μM AMPA plus100 μM CTZ for 30 min. Cell lysates from oligodendrocytes were harvested at 30, 60 and 90 min post-stimulus and immunoprecipitated with a mouse anti-p53 antibody (total p53; IP:p53). Immunoprecipitates were analyzed by WB using the rabbit antibody against phospho-p53 (Ser15). Total p53 and β-actin in WCL were used as internal loading controls. The image corresponds to one representative immunoprecipitation assay where it is observed an increase in the p53 phosphorylation in Ser15 in response to excitotoxic insults in cultured oligodendrocytes. (B) AMPA induced mitochondrial accumulation of phospho-p53 (Ser15). Oligodendrocytes were treated for 30 min with 10 μM AMPA plus 100 μM CTZ and fixed and processed for immunofluorescence using the specific antibody phospho-p53 (Ser15), which only recognizes p53 when it is phosphorylated at this residue (green), and COX-IV antibody to detect mitochondria (red). Exposure to AMPA triggered p-p53 (Ser15) increase with cellular localization coincident with the mitochondrial environment (yellow). Scale bar, 10 μm. (C) Immunofluorescence images of oligodendrocytes control and exposed to AMPA where it is remarkable the accumulation of p-p53 (Ser15) induced by AMPA as well as the total absence of p-p53 (Ser15) in the nuclei, contrasted with DAPI (arrows). Scale bar: 10 μm.
Figure 9
Figure 9
Phosphorylation of p53 at Ser15 induced by AMPA is JNK/CK2 dependent. Oligodendrocytes were treated for 30 min with 10 μM AMPA plus 100 μM CTZ, in absence or presence of JNK or CK2 inhibitors, and the different assays were carried out at the indicated times. (A) WB analysis of total p53 and p-p53(Ser15) at 30 and 60 min after excitotoxic stimulus, in absence or presence of 1 μM SP600125. Exposure to AMPA induced an increase in expression levels of both total p53 and p-p53(Ser15), which were abolished by the JNK-inhibitor SP600125. The level of JNK phosphorylation was used as a control of the effectiveness of the treatment and β-actin was the internal loading control. **p < 0.01, ***p < 0.001 (cells treated with AMPA respect to control cells); #p < 0.05, ##p < 0.01 (cells treated with SP600125 respect to cells treated with only AMPA, at the same time). (B) AMPA triggered increases in p53 expression level, revealed with an antibody against total p53, which was reverted by JNK inhibitor SP600125 and CK2 inhibitor TBB. Scale bar: 10 μm. (C) Cells were treated with AMPA, as indicated above, in the presence of SP600125 or TBB and fixed at 30 min after stimulus. Immunofluorescence analysis using the specific antibody against p-p53(Ser15; green) showed that AMPA-induced activation of p53 through its phosphorylation in Ser15 was not detected in presence of JNK or CK2 inhibitors and neither its mitochondrial accumulation (revealed by COX-IV antibody; red). Scale bar: 10 μm.

Similar articles

Cited by

References

    1. Ahmad K. A., Wang G., Unger G., Slaton J., Ahmed K. (2008). Protein kinase CK2—a key suppressor of apoptosis. Adv. Enzyme Regul. 48, 179–187. 10.1016/j.advenzreg.2008.04.002 - DOI - PMC - PubMed
    1. Allende-Vega N., Dayal S., Agarwala U., Sparks A., Bourdon J. C., Saville M. K. (2013). p53 is activated in response to disruption of the pre-mRNA splicing machinery. Oncogene 32, 1–14. 10.1038/onc.2012.38 - DOI - PubMed
    1. Antony M. L., Kim S. H., Singh S. V. (2012). Critical role of p53 upregulated modulator of apoptosis in benzyl isothiocyanate-induced apoptotic cell death. PLoS One 7:e32267. 10.1371/journal.pone.0032267 - DOI - PMC - PubMed
    1. Atlante A., Calissano P., Bobba A., Giannattasio S., Marra E., Passarella S. (2001). Glutamate neurotoxicity, oxidative stress and mitochondria. FEBS Lett. 497, 1–5. 10.1016/s0014-5793(01)02437-1 - DOI - PubMed
    1. Axtell R. C., Xu L., Barnum S. R., Raman C. (2006). CD5-CK2 binding/activation-deficient mice are resistant to experimental autoimmune encephalomyelitis: protection is associated with diminished populations of IL-17-expressing T cells in the central nervous system. J. Immunol. 177, 8542–8549. 10.4049/jimmunol.177.12.8542 - DOI - PMC - PubMed