. 2018 Jul 26:7:1141.
doi: 10.12688/f1000research.15666.3. eCollection 2018.

A systematic performance evaluation of clustering methods for single-cell RNA-seq data

Affiliations

A systematic performance evaluation of clustering methods for single-cell RNA-seq data

Angelo Duò et al. F1000Res. .

Abstract

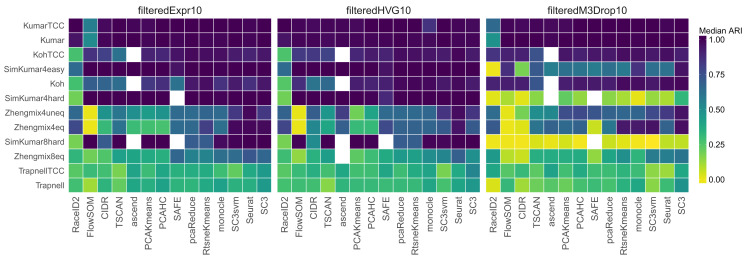
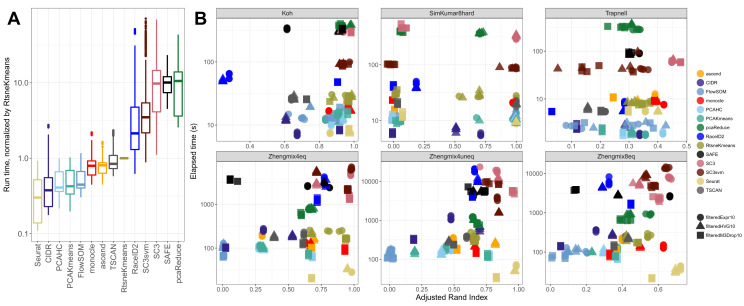
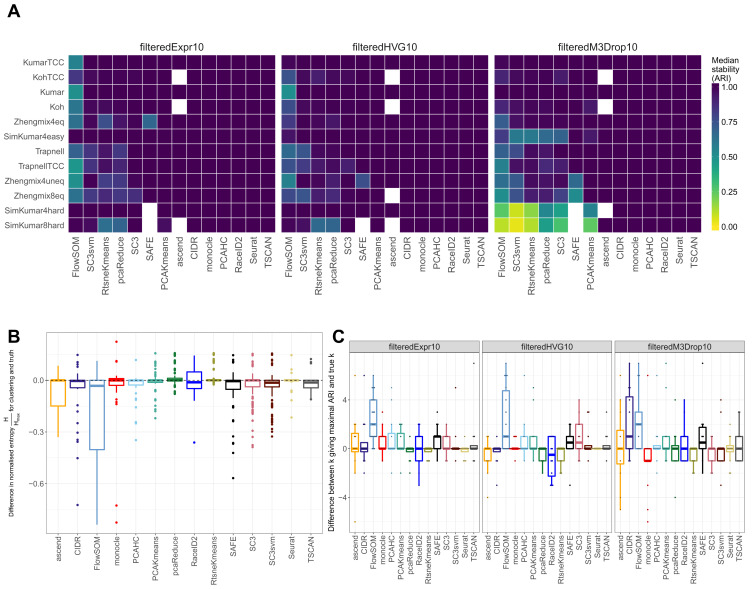
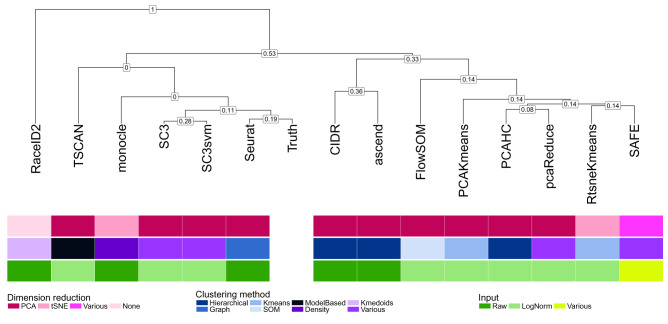
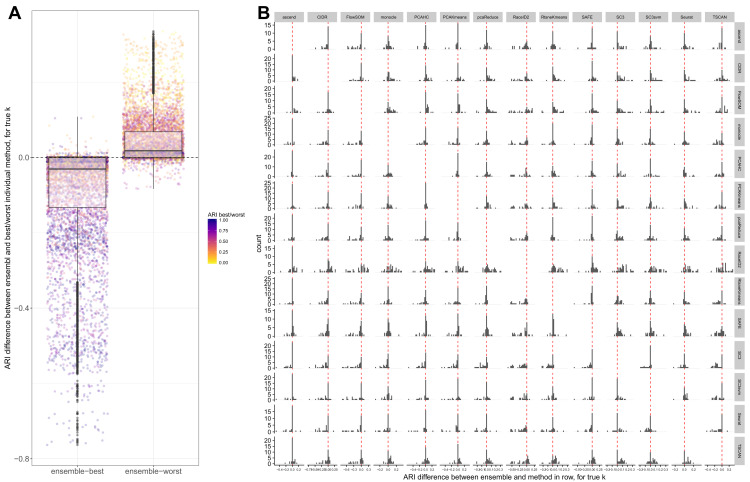
Subpopulation identification, usually via some form of unsupervised clustering, is a fundamental step in the analysis of many single-cell RNA-seq data sets. This has motivated the development and application of a broad range of clustering methods, based on various underlying algorithms. Here, we provide a systematic and extensible performance evaluation of 14 clustering algorithms implemented in R, including both methods developed explicitly for scRNA-seq data and more general-purpose methods. The methods were evaluated using nine publicly available scRNA-seq data sets as well as three simulations with varying degree of cluster separability. The same feature selection approaches were used for all methods, allowing us to focus on the investigation of the performance of the clustering algorithms themselves. We evaluated the ability of recovering known subpopulations, the stability and the run time and scalability of the methods. Additionally, we investigated whether the performance could be improved by generating consensus partitions from multiple individual clustering methods. We found substantial differences in the performance, run time and stability between the methods, with SC3 and Seurat showing the most favorable results. Additionally, we found that consensus clustering typically did not improve the performance compared to the best of the combined methods, but that several of the top-performing methods already perform some type of consensus clustering. All the code used for the evaluation is available on GitHub ( https://github.com/markrobinsonuzh/scRNAseq_clustering_comparison). In addition, an R package providing access to data and clustering results, thereby facilitating inclusion of new methods and data sets, is available from Bioconductor ( https://bioconductor.org/packages/DuoClustering2018).

Keywords: Benchmarking; Clustering; Clustering methods; RNA-seq; Single-cell RNA-seq.


Conflict of interest statement

No competing interests were disclosed.

Figures

Figure 1.
Figure 1.. Median ARI scores, representing the agreement between the true partition and the one obtained by each method, when the number of clusters is fixed to the true number.
Each row corresponds to a different data set, each panel to a different gene filtering method, and each column to a different clustering method. The methods and the data sets are ordered by their mean ARI across the filterings and data sets. Some methods failed to return a clustering with the correct number of clusters for certain data sets (indicated by white squares).
Figure 2.
Figure 2.
( A) Normalized run times, using RtsneKmeans as the reference method, across all data set instances and number of clusters. ( B) Run time versus performance (ARI) for a subset of data sets and filterings, for the true number of clusters.
Figure 3.
Figure 3.
( A) Median stability (ARI across different runs on the same data set) for the methods, with the annotated number of clusters imposed. Some methods failed to return a clustering with the correct number of clusters for certain data sets (indicated by white squares). ( B) The difference between the normalized entropy of the obtained clusterings and that of the true partitions, across all data sets and for the annotated number of clusters. ( C) The difference between the number of clusters giving the maximal ARI and the annotated number of clusters, across all data sets.
Figure 4.
Figure 4.. Clustering of the methods based on the average similarity of their partitions across data sets, for the true number of clusters.
Numbers on internal nodes indicate the fraction of dendrograms from individual data sets where a particular subcluster was found.
Figure 5.
Figure 5.. Comparison between individual methods and ensembles.
( A) Difference between the ARI of each ensemble and the ARI of the best (left) and worst (right) of the two methods in the ensemble, across all data sets and for the true number of clusters. ( B) Difference between the ARI of each ensemble and each of the components, across all data sets and for the true number of clusters. The histogram in row i, column j represents the differences between the ARIs of the ensemble of the methods in row i and column j and the ARI of the method in row i on its own.

References

    1. Tang F, Barbacioru C, Wang Y, et al. : mRNA-Seq whole-transcriptome analysis of a single cell. Nat Methods. 2009;6(5):377–382. 10.1038/nmeth.1315 - DOI - PubMed
    1. Picelli S, Björklund ÅK, Faridani OR, et al. : Smart-seq2 for sensitive full-length transcriptome profiling in single cells. Nat Methods. 2013;10(11):1096–1098. 10.1038/nmeth.2639 - DOI - PubMed
    1. Klein AM, Mazutis L, Akartuna I, et al. : Droplet barcoding for single-cell transcriptomics applied to embryonic stem cells. Cell. 2015;161(5):1187–1201. 10.1016/j.cell.2015.04.044 - DOI - PMC - PubMed
    1. Macosko EZ, Basu A, Satija R, et al. : Highly Parallel Genome-wide Expression Profiling of Individual Cells Using Nanoliter Droplets. Cell. 2015;161(5):1202–1214. 10.1016/j.cell.2015.05.002 - DOI - PMC - PubMed
    1. Zheng GX, Terry JM, Belgrader P, et al. : Massively parallel digital transcriptional profiling of single cells. Nat Commun. 2017;8: 14049. 10.1038/ncomms14049 - DOI - PMC - PubMed