. 2018 Nov 14:3:27.
doi: 10.12688/wellcomeopenres.14073.3. eCollection 2018.

ANIMA: Association network integration for multiscale analysis

Affiliations

ANIMA: Association network integration for multiscale analysis

Armin Deffur et al. Wellcome Open Res. .

Abstract

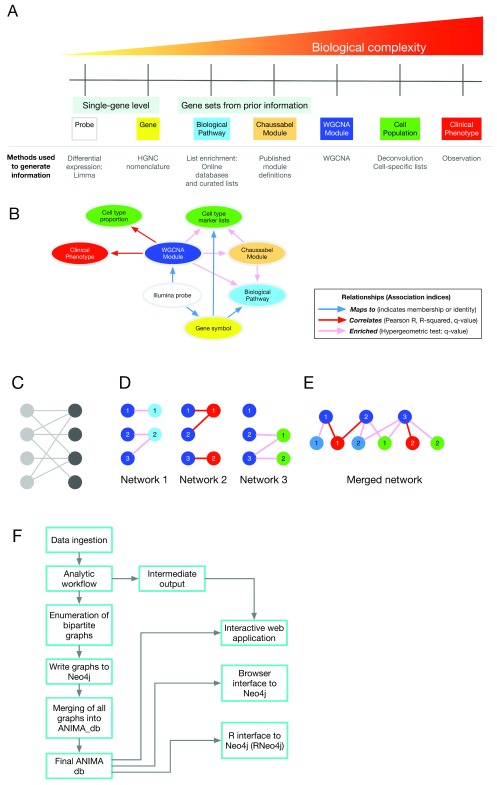
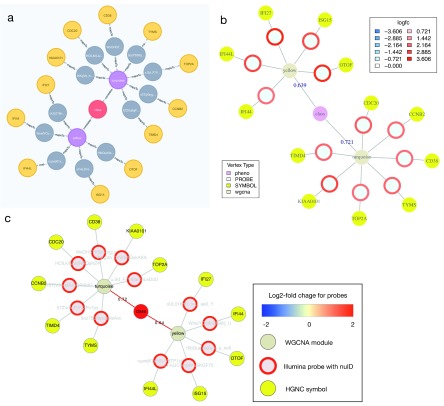
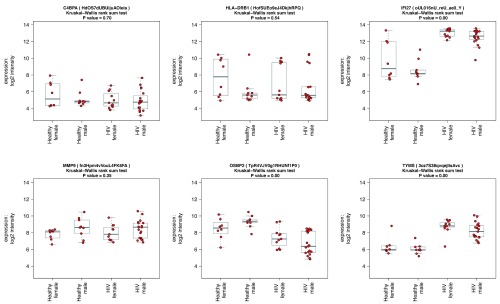
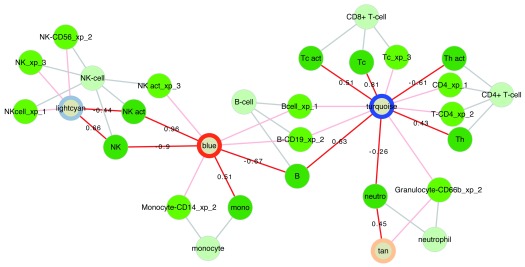
Contextual functional interpretation of -omics data derived from clinical samples is a classical and difficult problem in computational systems biology. The measurement of thousands of data points on single samples has become routine but relating 'big data' datasets to the complexities of human pathobiology is an area of ongoing research. Complicating this is the fact that many publicly available datasets use bulk transcriptomics data from complex tissues like blood. The most prevalent analytic approaches derive molecular 'signatures' of disease states or apply modular analysis frameworks to the data. Here we describe ANIMA (association network integration for multiscale analysis), a network-based data integration method using clinical phenotype and microarray data as inputs. ANIMA is implemented in R and Neo4j and runs in Docker containers. In short, the build algorithm iterates over one or more transcriptomics datasets to generate a large, multipartite association network by executing multiple independent analytic steps (differential expression, deconvolution, modular analysis based on co-expression, pathway analysis) and integrating the results. Once the network is built, it can be queried directly using Cypher (a graph query language), or by custom functions that communicate with the graph database via language-specific APIs. We developed a web application using Shiny, which provides fully interactive, multiscale views of the data. Using our approach, we show that we can reconstruct multiple features of disease states at various scales of organization, from transcript abundance patterns of individual genes through co-expression patterns of groups of genes to patterns of cellular behaviour in whole blood samples, both in single experiments as well in meta-analyses of multiple datasets.

Keywords: Transcriptomics; complex networks; data integration; graph databases.


Conflict of interest statement

No competing interests were disclosed.

Figures

Figure 1.
Figure 1.. Method overview.
( A) Analytical approaches and biological complexity. This conceptualises the need for understanding biological systems at multiple scales. ( B) Relationships between output types ( C) A bipartite graph, with two classes of nodes connected by edges. ( D) The separate bipartite graphs, with one node type in common. ( E) Multipartite graph obtained after merging the three graphs in ( D). ( F) Outline of different steps in setting up and accessing the ANIMA database. Abbreviations: HGNC, HUGO Gene Nomenclature Committee; WGCNA, weighted gene co-expression network analysis.
Figure 2.
Figure 2.. Visualising Cypher query results.
Relationships between nodes extracted from the ANIMA database using a Cypher query applied to the HIVsetB data (N HIV=30, N Controls=17, see Figure S1; Supplementary File 1). Shown are two WGCNA modules that contain probes with increased transcript abundance in acute HIV infection and whose module eigengene is positively correlated with disease class (an ordinal variable). ( A) Result from native browser interface for Neo4j. ( B) Result plotted from within an R session connected to the ANIMA database, using the igraph_plotter function. Log 2-fold change values for the individual probes are shown by coloured rings; values are shown in the legend. ( C) The same result, visualized in Cytoscape, taking advantage of the igraph_plotter function to export node and edge lists for easy import into Cytoscape. Links/edges are annotated with Pearson correlation coefficients where applicable.
Figure 3.
Figure 3.. Visualising individual probe-level expression data.
Box-and-whisker plots showing normalized, log 2-transformed probe-level expression data for six selected genes, obtained by a custom function in R in four groups: Healthy female, N = 8, Healthy male, N = 9, acute HIV female, N = 11, acute HIV male, N = 19; data from HIVsetB dataset. Gene (and probe nuIDs for disambiguation) are given for reference; the y-axis shows log2 scale normalized intensity values. Box and whisker plots show median, interquartile range, and range. Outliers are defined as values that lie beyond the whiskers, which extend to maximally 1.5 X the length of the box. Individual datapoints are superimposed in red on the box-and-whisker plots. The four groups are compared using Kruskal Wallis rank sum test, and the P-value for the comparison is shown in the plot title. Results for individual pairwise comparisons are not shown.
Figure 4.
Figure 4.. Cell associations of WGCNA modules.
Relationships of WGCNA modules and different cell types in the respInf dataset (Day 0 acute influenza, N = 46 vs baseline healthy samples, N = 48, see Figure S1; Supplementary File 1). Shown are WGCNA modules whose expression correlates with specific cell-type proportions (dark green, edges annotated with Pearson correlation coefficient R) and that are enriched for the genes specific to that cell type (medium green, suffixes xp_1-3 indicate the respective gene list on which the cell assignments were based, see Supplementary methods). The classes of cells are indicated in light green. The modules are annotated with coloured rings representing the difference in median eigengene values between cases and controls (diffME, see Supplementary methods); blue indicates modules which are under-expressed, and red indicates modules that are over-expressed in cases relative to controls. WGCNA module names are (arbitrarily) based on colours as per the convention of the WGCNA package, and modules were not renamed manually.
Figure 5.
Figure 5.. Correlation of module eigengenes with clinical variables.
Shown is the Pearson correlation of the pink module eigengene with CD4 count (cells/microlitre) ( A) and with age (years) ( B) in acute HIV (N = 28) vs healthy controls (N = 23) in the HIVsetA dataset. Study subject IDs are used as point labels, and coloured as indicated in the legend. Plot titles show the Pearson coefficient R and the associated P-value. ( C) WGCNA module annotation obtained from the Neo4j database for the pink module. Edges are labelled with the correlation coefficient (R) where applicable. Note that the same coefficient is obtained for CD4 count as in panel A. Legends are shown for vertex type and diffME (a measure of differential co-expression (see Supplementary methods), i.e. the extent that the module eigengene median varies between two classes). Abbreviations: diffME, differential module eigengene.
Figure 6.
Figure 6.. WGCNA module structure.
( A) Correlation matrix of all probes in the turquoise module in the HIVsetB dataset (N HIV=30, N Controls=17, see Figure S1; Supplementary File 1). Colours in the heatmap represent Pearson correlation coefficients, ranging from -1 to 1, as indicated by the legend. The module is enriched for lymphocyte-specific genes (right annotation panel) as well as cell cycle/mitosis associated genes, suggesting that various lymphocyte subsets in acute HIV infection are actively proliferating. (bottom annotation panel). Log 2-fold change values refer to differential transcript abundance in acute HIV relative to healthy controls. ( B) Correlation matrix of all probes in the yellow module in the HIVsetB dataset. It is enriched for innate cell genes as well as interferon signaling, suggesting that innate immune cells are in an interferon-induced state. Additional annotation information is provided to the left of the heatmap. The parameters modAUC1, modAUC2, diffME and sigenrich are defined in Supplementary methods. The plot is generated using a custom R function ( mwat).
Figure 7.
Figure 7.. Relationships between WGCNA and Chaussabel modules.
( A) Bipartite graph of the two module types based on the hypergeometric association index in the HIVsetA dataset (acute HIV, N = 28 vs healthy controls, N = 23). Strikingly, Chaussabel modules tend to have the same direction of differential expression (indicated by the rim colour of the Chaussabel modules, red indicating up-regulation in acute HIV, and blue indicating downregulation) as WGCNA modules they map to, indicated by the label colour of the module. ( B) Projection 1 of ( A), showing relationships between Chaussabel modules based on shared WGCNA modules; dense cliques of modules are observed. ( C) Projection 2 of ( A), showing relationships between WGCNA modules based on shared Chaussabel modules. All associations (hypergeometric test) shown are corrected for multiple testing, BH-corrected P-value < 0.05. All outputs were generated using the igraph_plotter function, exporting vertex and edge tables of the bipartite graph and the two projections and importing these into Cytoscape.
Figure 8.
Figure 8.. Cell/pathway activity matrix.
( A) Cell/pathway activity matrix for all cell-types for the respInf dataset (Day 0 acute influenza, N = 46 vs baseline healthy samples, N = 48, see Figure S1). The clustered heatmap shows pathway activity scores representing the mean log-2 fold change for all probes in the pathway for a particular cell type (see Supplementary methods). There is a clear interferon response in multiple cell types, as well as down-regulation of other pathways associated with translation. ( B) Barplots highlighting the most highly differentially regulated pathways (left panel, determined by row sums of matrix in A), and cells with highest levels of differential expression (right panel, determined by column sums of matrix in A). In all cases, up- and downregulated pathway scores are kept separate.
Figure 9.
Figure 9.. WGCNA module indices.
Plot of module indices representing the area-under-the-ROC curve for the two classes for all WGCNA modules in the HIVsetB dataset (N HIV=30, N Controls=17, see Figure S1; Supplementary File 1). The indices are named per the variable they aim to differentiate (disease class or sex). The class index corresponds to the modAUC1 variable and the sex index corresponds to modAUC2. These indices are calculated form the module eigengenes and given class assignments using functions from the rocr package. See text and Supplementary methods for details.
Figure 10.
Figure 10.. Meta-analysis of transcriptional and cellular patterns.
( A) All 258 Chaussabel modules plotted as a heatmap in all six datasets. ( B) The subset of modules all expressed in the same direction. Three module groups of interest are identified. ( C) Cell/pathway activity matrix for a single cell type (CD8 + T cell) based on three celltype-gene lists (xp1, xp2, xp3, see Supplementary methods) in all three conditions. Activity in CD8+ T cells in HIV all cluster together, and differ from both malaria and respiratory infections. Cell labels are constructed by [condition]_[dataset]_[comparison]_[cell class]_[cell type]_[gene list].

References

    1. Pavlopoulos GA, Kontou PI, Pavlopoulou A, et al. : Bipartite graphs in systems biology and medicine: a survey of methods and applications. GigaScience. 2018;7(4):1–31. 10.1093/gigascience/giy014 - DOI - PMC - PubMed
    1. Shannon P, Markiel A, Ozier O, et al. : Cytoscape: a software environment for integrated models of biomolecular interaction networks. Genome Res. 2003;13(11):2498–2504. 10.1101/gr.1239303 - DOI - PMC - PubMed
    1. Li P, Castrillo JI, Velarde G, et al. : Performing statistical analyses on quantitative data in Taverna workflows: an example using R and maxdBrowse to identify differentially-expressed genes from microarray data. BMC Bioinformatics. 2008;9:334. 10.1186/1471-2105-9-334 - DOI - PMC - PubMed
    1. https://www.docker.com
    1. Di Tommaso P, Chatzou M, Floden EW, et al. : Nextflow enables reproducible computational workflows. Nat Biotechnol. 2017;35(4):316–319. 10.1038/nbt.3820 - DOI - PubMed