. 2018 Jan 22:1:4.
doi: 10.1038/s42003-017-0005-3. eCollection 2018.

Acidity promotes degradation of multi-species environmental DNA in lotic mesocosms

Affiliations

Acidity promotes degradation of multi-species environmental DNA in lotic mesocosms

Mathew Seymour et al. Commun Biol. .

Abstract

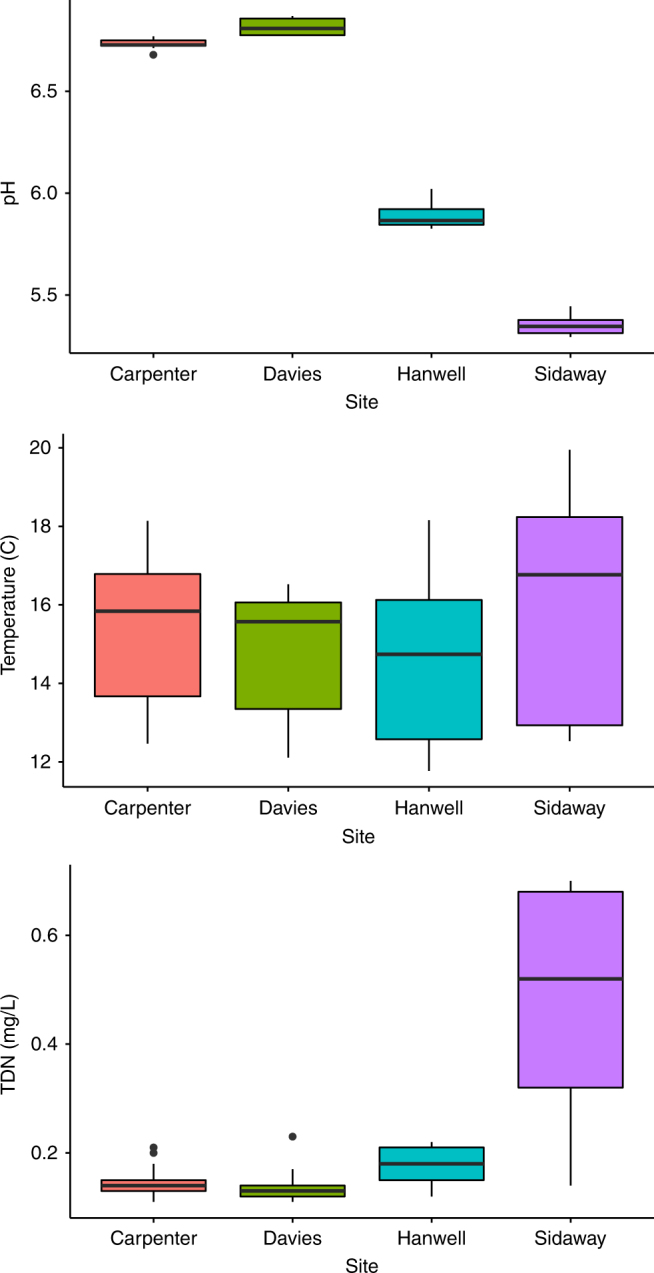
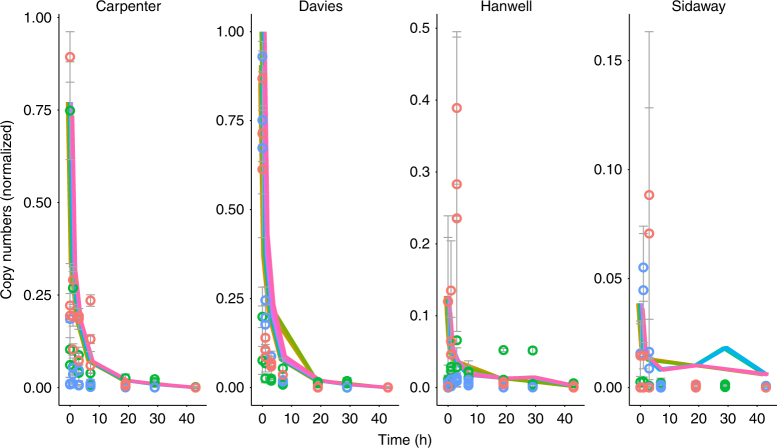
Accurate quantification of biodiversity is fundamental to understanding ecosystem function and for environmental assessment. Molecular methods using environmental DNA (eDNA) offer a non-invasive, rapid, and cost-effective alternative to traditional biodiversity assessments, which require high levels of expertise. While eDNA analyses are increasingly being utilized, there remains considerable uncertainty regarding the dynamics of multispecies eDNA, especially in variable systems such as rivers. Here, we utilize four sets of upland stream mesocosms, across an acid-base gradient, to assess the temporal and environmental degradation of multispecies eDNA. Sampling included water column and biofilm sampling over time with eDNA quantified using qPCR. Our findings show that the persistence of lotic multispecies eDNA, sampled from water and biofilm, decays to non-detectable levels within 2 days and that acidic environments accelerate the degradation process. Collectively, the results provide the basis for a predictive framework for the relationship between lotic eDNA degradation dynamics in spatio-temporally dynamic river ecosystems.


Conflict of interest statement

The authors declare no competing financial interests.

Figures

Fig. 1
Fig. 1
Schematic overview of the study design. The study design includes the sampling workflow for the water and biofilm eDNA sampling. Mesocosms are depicted with their associated names above. The dotted lines represent 1 m channel sections (20 m in total for each channel) in which terracotta tiles (small ceramic tiles) were placed for biofilm accumulation. Background colors (blue, green, orange, red) correspond to the natural acidic gradient of the mesocosms
Fig. 2
Fig. 2
Environmental variation of the experimental flumes. Boxplots showing environmental variation across sites (x-axis) for pH (top panel), temperature (middle panel), and total dissolved nitrogen (TDN) (bottom panel). Data shown include daily averages across 3 days with three samples taken per sampling site (one per channel). The upper and lower whiskers show the standard deviation
Fig. 3
Fig. 3
Temporal eDNA dynamics. Results of the qPCR analysis. Quantity (x-axis) as normalized copy numbers relative to time (y-axis) in hours with each point showing mean quantity values (n = 3) for each time point at the respective experimental stream (separate panels). The experiment consisted of 864 data points evenly distributed across three species, four sites, and eight time points with nine samples taken per site per time point (three per channel). Whisker bars show the standard deviation. Lines are the fitted values from a generalized linear mixed effects model. Lines and point data were normalized after fitting the statistical model. Colors represent unique species (D. magna, E. danica, A. anguilla) for each stream replicate (three per stream)
Fig. 4
Fig. 4
Acidic effects on eDNA detection. Barplot showing eDNA quantification (log copy numbers: y-axis) vs. pH (x-axis). Each bar depicts the mean quantification value (with accompanying standard deviation) across all samples for a given site/channel, which corresponds to a mean pH value for the given sampling location. The experiment consisted of 864 data points evenly distributed across three species, four sites, and eight time points with nine samples taken per site per time point (three per channel). The different color bars depict different time points including 0, 1, 3, 7, 19, 29, and 43 h from the start of the experiment

References

    1. Barnes MA, Turner CR. The ecology of environmental DNA and implications for conservation genetics. Conserv. Genet. 2016;17:1–17. doi: 10.1007/s10592-015-0775-4. - DOI
    1. Jerde CL, Mahon AR, Chadderton WL, Lodge DM. ‘Sight-unseen’ detection of rare aquatic species using environmental DNA. Conserv. Lett. 2011;4:150–157. doi: 10.1111/j.1755-263X.2010.00158.x. - DOI
    1. Biggs J, et al. Using eDNA to develop a national citizen science-based monitoring programme for the great crested newt (Triturus cristatus) Biol. Conserv. 2015;183:19–28. doi: 10.1016/j.biocon.2014.11.029. - DOI
    1. Dejean T, et al. Persistence of environmental DNA in freshwater ecosystems. PLoS ONE. 2011;6:e23398. doi: 10.1371/journal.pone.0023398. - DOI - PMC - PubMed
    1. Thomsen PF, Willerslev E. Environmental DNA – an emerging tool in conservation for monitoring past and present biodiversity. Biol. Conserv. 2015;183:4–18. doi: 10.1016/j.biocon.2014.11.019. - DOI