. 2018 Apr 5:1:30.
doi: 10.1038/s42003-018-0024-8. eCollection 2018.

Caloric restriction increases lifespan but affects brain integrity in grey mouse lemur primates

Affiliations

Caloric restriction increases lifespan but affects brain integrity in grey mouse lemur primates

Fabien Pifferi et al. Commun Biol. .

Abstract

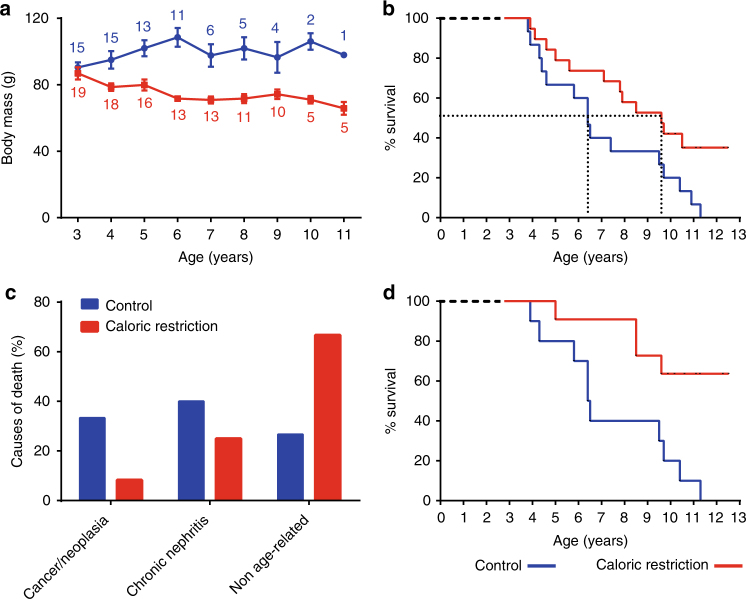
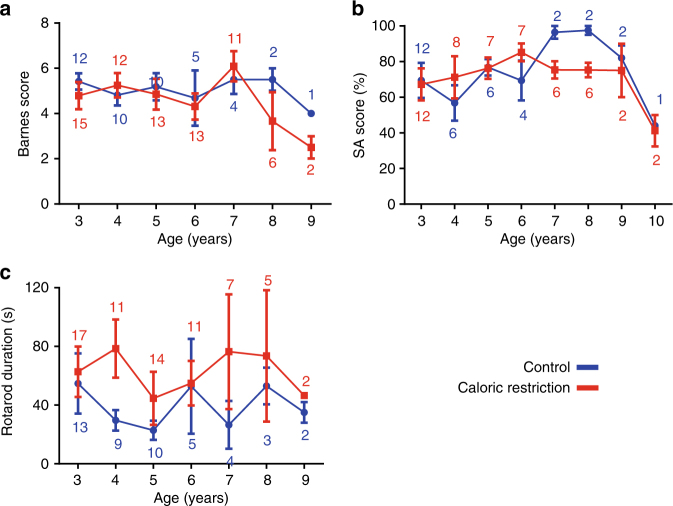
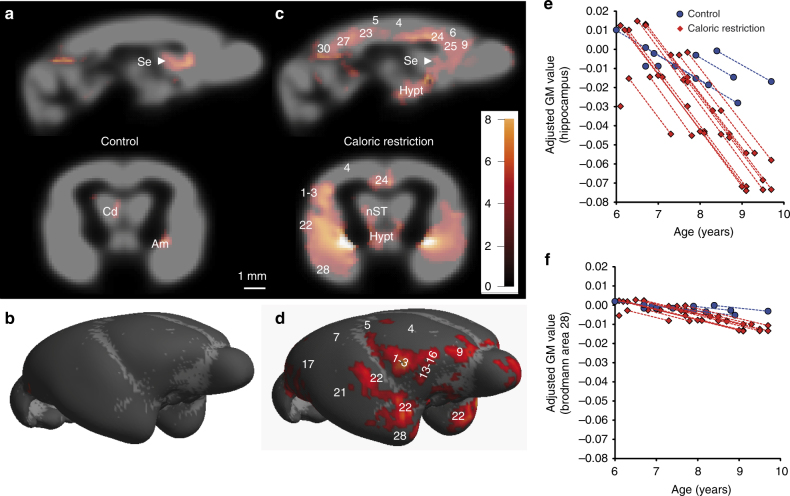
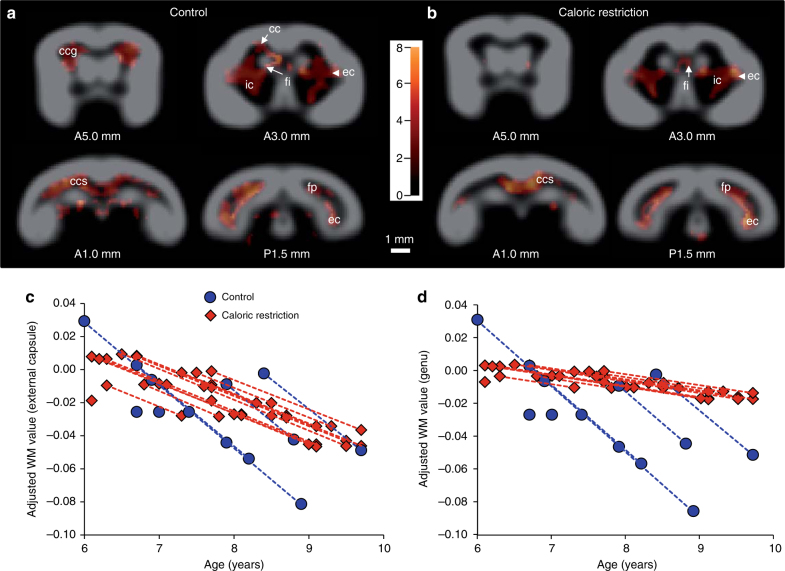
The health benefits of chronic caloric restriction resulting in lifespan extension are well established in many short-lived species, but the effects in humans and other primates remain controversial. Here we report the most advanced survival data and the associated follow-up to our knowledge of age-related alterations in a cohort of grey mouse lemurs (Microcebus murinus, lemurid primate) exposed to a chronic moderate (30%) caloric restriction. Compared to control animals, caloric restriction extended lifespan by 50% (from 6.4 to 9.6 years, median survival), reduced aging-associated diseases and preserved loss of brain white matter in several brain regions. However, caloric restriction accelerated loss of grey matter throughout much of the cerebrum. Cognitive and behavioural performances were, however, not modulated by caloric restriction. Thus chronic moderate caloric restriction can extend lifespan and enhance health of a primate, but it affects brain grey matter integrity without affecting cognitive performances.


Conflict of interest statement

The authors declare no competing interests.

Figures

Fig. 1
Fig. 1
Effect of moderate caloric restriction on body mass, lifespan and age-associated pathologies in mouse lemurs. a Mean body mass of male mouse lemurs (M. murinus) at the indicated times on a chronic 30% calorie-restricted diet (n = 19, red) or a control diet (n = 15, blue). Values shown are mean ± standard error of the mean (SEM); numbers indicate the number of animals in caloric restriction and control groups. b Kaplan–Meier survival curves for overall mortality of the same animals shown in A (p-logrank = 0.02). Vertical dotted lines indicate the median survival in control (6.4 years) and calorie-restricted animals (9.6 years). c Incidence of the indicated age-related diseases (including cancer and nephritis) and other non-age-related causes of death (from accidents—fall with cranial trauma, MRI anesthesia incident—infections or undetermined causes) in the caloric restriction and control cohorts. The data were obtained after pathophysiological analysis of post-mortem tissues. d Kaplan–Meier survival curves for age-related disease mortality (p-logrank < 0.01)
Fig. 2
Fig. 2
Effect of moderate caloric restriction on cognitive and motor performances in mouse lemurs. Cognitive and motor performances were tested in mouse lemurs either on a chronic 30% calorie-restricted (red) diet or on a control (blue) diet. Values shown are mean ± standard error of the mean (SEM); numbers indicate the number of animals in the calorie-restricted and control groups. a Barnes maze score was calculated using the following formula: Score = (10−number of errors), higher scores thus reflect better spatial memory. No significant difference in Barnes maze score was observed between control and calorie-restricted animals (p = 0.82). b The alternation score was obtained by calculating the ratio of actual alternation to possible alternation and was expressed as percentage (%), higher scores reflecting better working memory. No significant difference was observed between control and calorie-restricted animals (p = 0.22). c Motor performance during the rotarod task. No significant difference was observed between control and calorie-restricted animals (p = 0.54)
Fig. 3
Fig. 3
Increased grey matter atrophy in calorie-restricted compared to control mouse lemurs. Data shown at initial imaging time, i.e., after 4 years of treatment (ac) and during the longitudinal follow-up from 7 to 10 years of age (df). a Sagittal, b coronal (A1.0 mm, referring to antero-posterior coordinates) and c surface rendering representation highlighting the regions that showed stronger grey matter loss at initial imaging time in calorie-restricted compared to control animals (voxel-based morphometric analysis of serial MR images, p < 0.005). d Sagittal, e coronal (A1.0 mm, referring to antero-posterior coordinates) and f surface rendering representation highlighting the regions that showed stronger age-related grey matter loss in caloric-restricted compared to control animals from 7 to 10 years of age, i.e., between 4 and 8 years after the initiation of the treatments (voxel-based morphometric analysis of time of treatment×diet group interaction, p < 0.005, n = 7 control and 13 calorie-restricted animals). The colour bars represent the value of the t-statistic (no unit). Numbers represent Brodmann areas of mouse lemur brain according to Brodmann and Le Gros Clark classification, . Hip hippocampus, Se septum
Fig. 4
Fig. 4
Age-associated atrophy of brain grey matter in control and caloric restricted mouse lemurs. a, c Sagittal (top) and coronal (bottom) brain representations (A3.5 mm, referring to antero-posterior coordinates) views of the brains of control (a) and calorie-restricted (c) mouse lemurs showing regions with statistically significant age-related decline in grey matter volume obtained by voxel-based morphometric analysis of serial MR images (p < 0.005, n = 7 control and 13 calorie-restricted animals). Unlike control animals, calorie-restricted individuals displayed a widespread decline in grey matter throughout much of the brain. b, d Surface rendering of the data in a, showing regions of control (b) and caloric restriction brains (d) with age-related decline in grey matter volume. e, f Scatterplots showing changes in grey matter volume of the hippocampus (e) and entorhinal cortex (BA28) (f) during aging of control (blue, 7 contributing animals) or calorie-restricted (red, 13 contributing animals) animals. Values shown are the relative adjusted MRI grey matter values, with the values of the 6–7-year-old animals centred at 0. Dots from individual animals are connected with curves. As the data were adjusted to the general linear model after removal of confounding effects (i.e., repetition of the measures), curves from control or caloric restriction groups appear parallel. Indeed, the model estimates that the slope of the grey matter evolution is similar in control or calorie-restricted animals. It is the term ϵjk corresponding to the error of the measure for each animal that is adjusted to fit the model (see Methods). The colour bar in a, c represents the value of the t-statistic (no unit). Numbers represent Brodmann areas (BA) of mouse lemur brain according to Brodmann and Le Gros Clark classification, . Am medial nucleus of the amygdala, Hypt hypothalamus, nST nucleus stria terminalis, Se septum
Fig. 5
Fig. 5
Age-associated atrophy of brain white matter in control and caloric-restricted mouse lemurs. a, b Coronal views of control (a) and calorie-restricted (b) mouse lemurs showing regions with statistically significant age-related decline in white matter volume obtained by voxel-based morphometric analysis of serial MR images (p < 0.005, n = 7 control and 13 calorie-restricted animals, brain levels refer to antero-posterior coordinates). c Scatterplot showing changes in white matter volume of the external capsule during aging in control or calorie-restricted animals. Values shown are the relative adjusted MRI white matter values, with the values of the 6–7-year-old animals centred at 0. d Similar plot of white matter volumes in the genu of the corpus callosum during aging. In c, d, dots from individual animals are connected with curves. As the data were adjusted to the general linear model after removal of confounding effects (i.e., repetition of the measures), curves from the control or caloric restriction groups appear parallel. Indeed, the model estimates that the slope of the white matter evolution is similar in control or calorie-restricted animals. It is the term ϵjk corresponding to the error of the measure for each animal that is adjusted to fit the model (see Methods). The colour bar represents the value of the t-statistic (no unit). ccg genu of the corpus callosum, cc body of the corpus callosum, ec external capsule, ic internal capsule, fi fimbria hippocampi, ccs splenium of the corpus callosum, fp posterior forceps of the corpus callosum

References

    1. McCay CM, Crowell MF, Maynard LA. The effect of retarded growth upon the length of life span and upon the ultimate body size: one figure. J. Nutr. 1935;10:63–79. doi: 10.1093/jn/10.1.63. - DOI - PubMed
    1. Fontana L, Partridge L, Longo VD. Extending healthy life span--from yeast to humans. Science. 2010;328:321–326. doi: 10.1126/science.1172539. - DOI - PMC - PubMed
    1. Colman RJ, et al. Caloric restriction delays disease onset and mortality in rhesus monkeys. Science. 2009;325:201–204. doi: 10.1126/science.1173635. - DOI - PMC - PubMed
    1. Colman RJ, et al. Caloric restriction reduces age-related and all-cause mortality in rhesus monkeys. Nat. Commun. 2014;5:3557. doi: 10.1038/ncomms4557. - DOI - PMC - PubMed
    1. Mattison JA, et al. Impact of caloric restriction on health and survival in rhesus monkeys from the NIA study. Nature. 2012;489:318–321. doi: 10.1038/nature11432. - DOI - PMC - PubMed