. 2018 May 3:1:37.
doi: 10.1038/s42003-018-0037-3. eCollection 2018.

The GTPase domain of gamma-tubulin is required for normal mitochondrial function and spatial organization

Affiliations

The GTPase domain of gamma-tubulin is required for normal mitochondrial function and spatial organization

Lisa Lindström et al. Commun Biol. .

Abstract

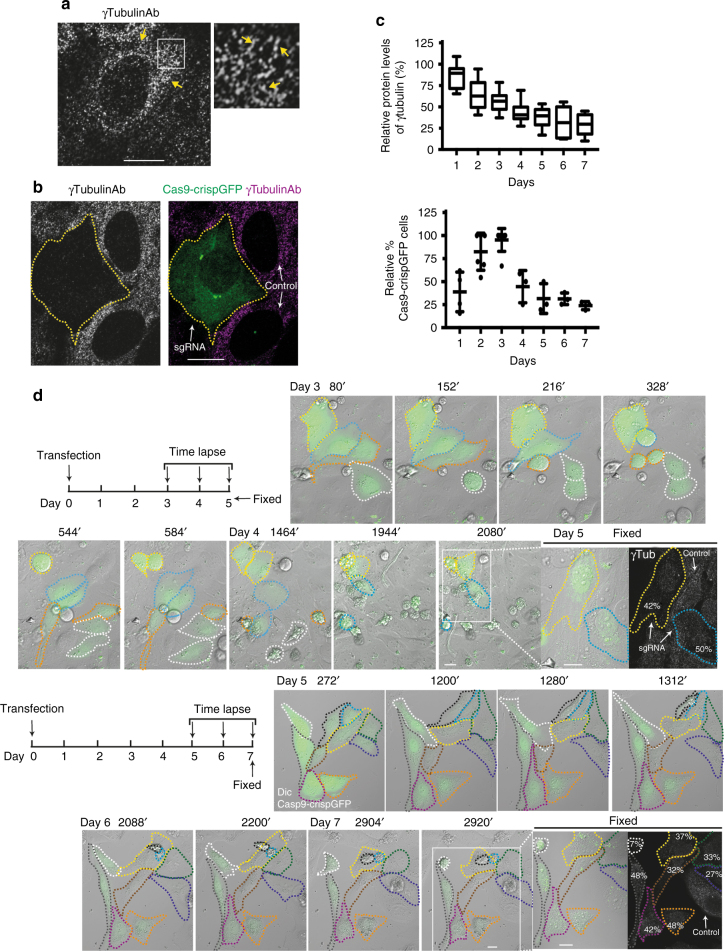
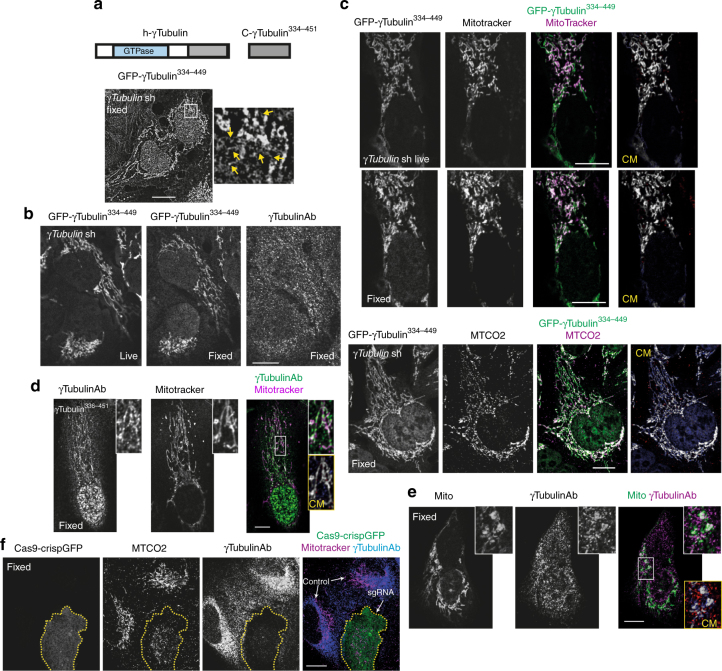
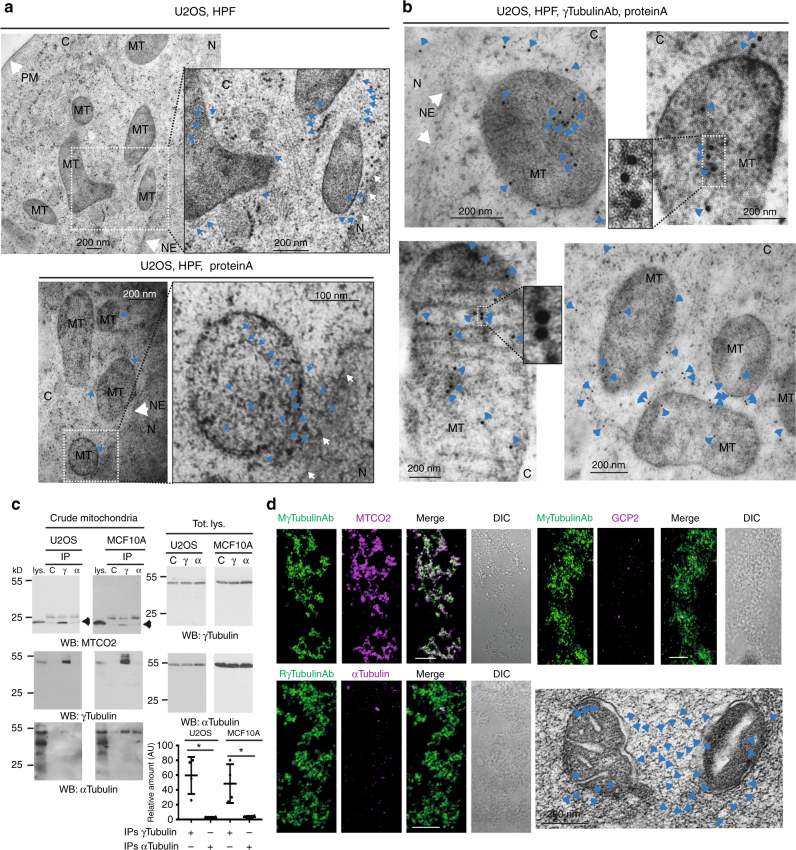
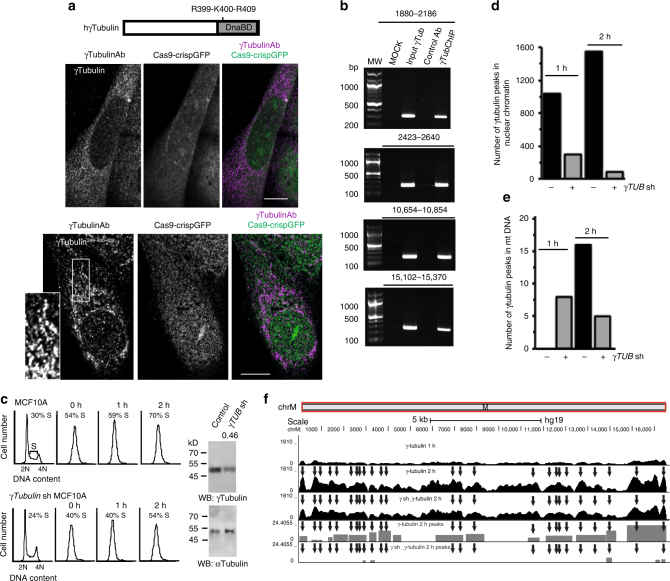
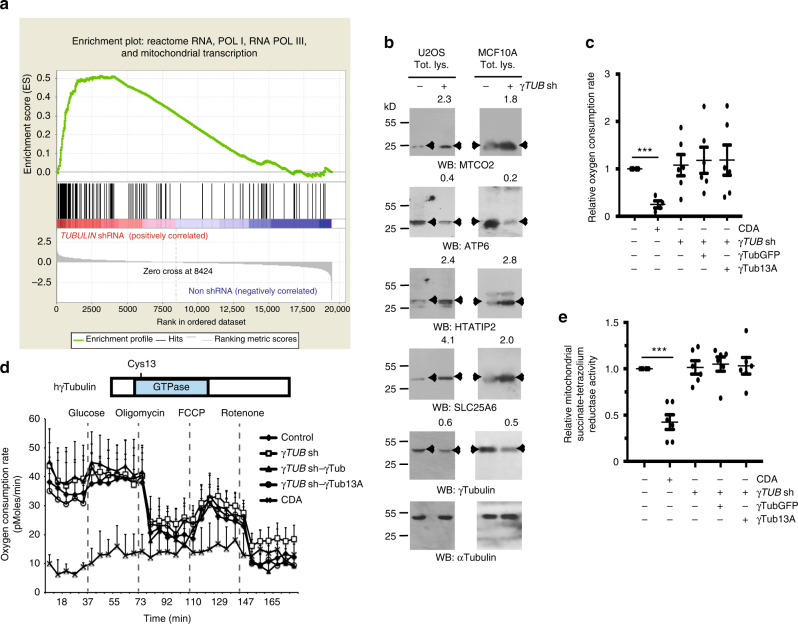
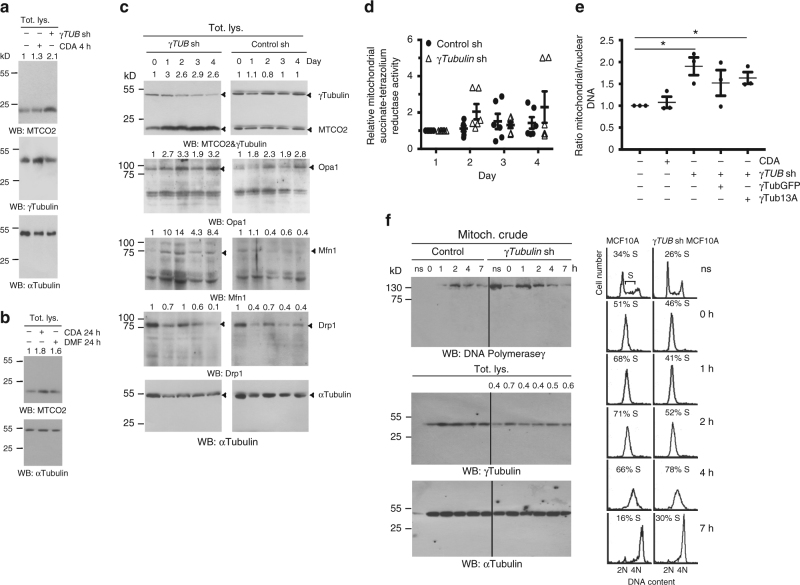
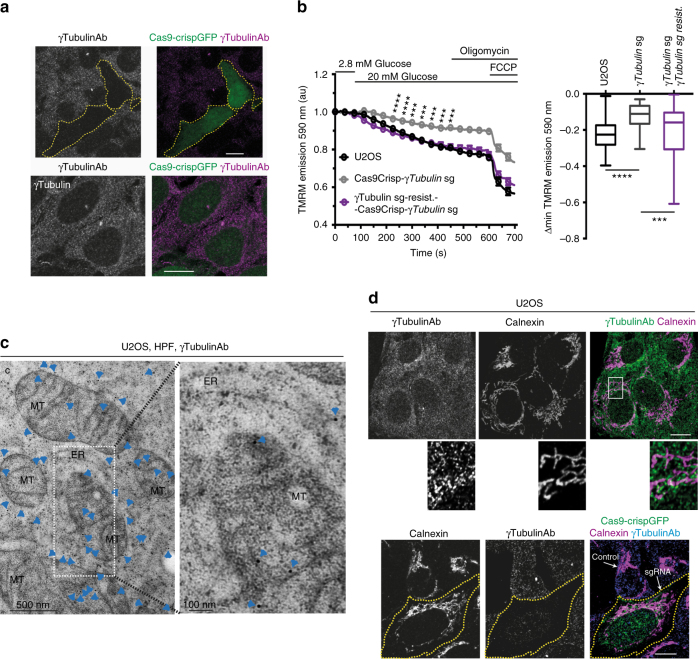
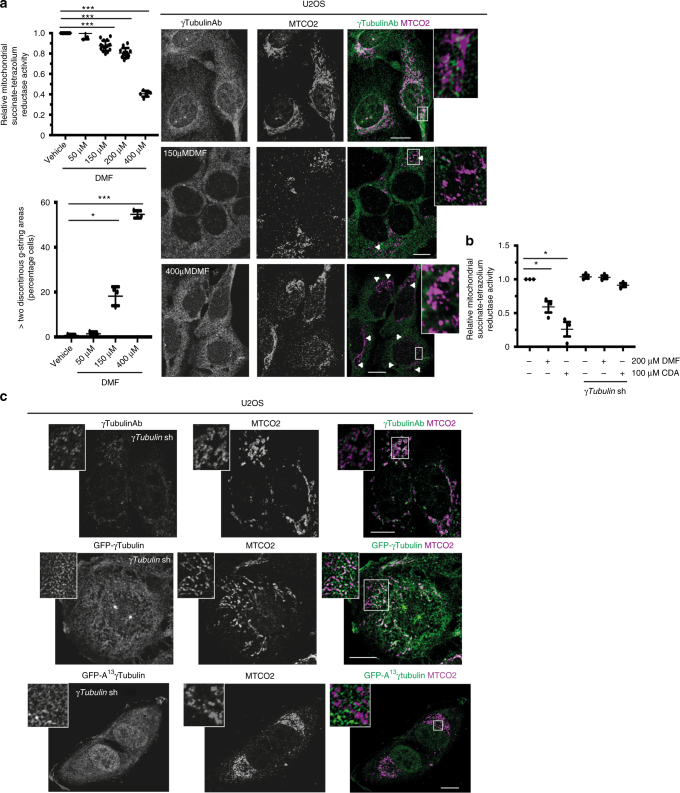
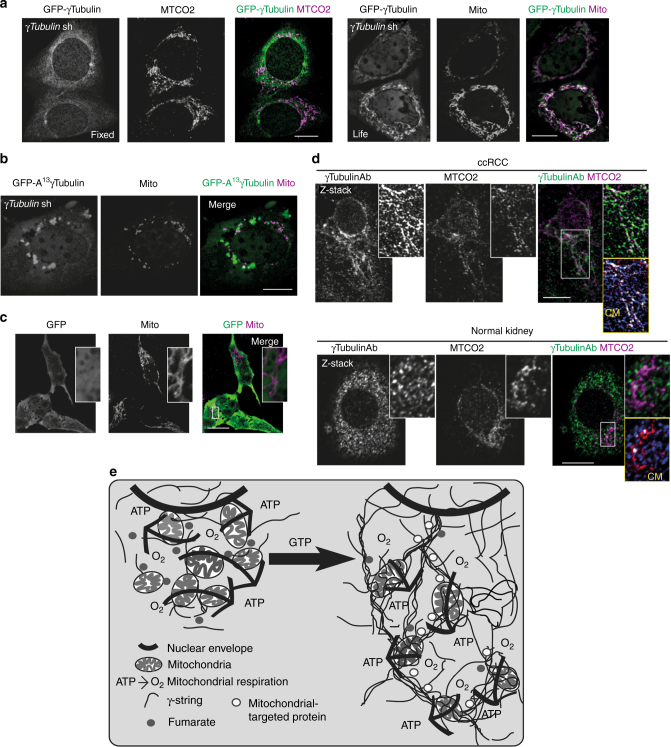
In the cell, γ-tubulin establishes a cellular network of threads named the γ-string meshwork. However, the functions of this meshwork remain to be determined. We investigated the traits of the meshwork and show that γ-strings have the ability to connect the cytoplasm and the mitochondrial DNA together. We also show that γ-tubulin has a role in the maintenance of the mitochondrial network and functions as reduced levels of γ-tubulin or impairment of its GTPase domain disrupts the mitochondrial network and alters both their respiratory capacity and the expression of mitochondrial-related genes. By contrast, reduced mitochondrial number or increased protein levels of γ-tubulin DNA-binding domain enhanced the association of γ-tubulin with mitochondria. Our results demonstrate that γ-tubulin is an important mitochondrial structural component that maintains the mitochondrial network, providing mitochondria with a cellular infrastructure. We propose that γ-tubulin provides a cytoskeletal element that gives form to the mitochondrial network.


Conflict of interest statement

The authors declare no competing interests.

Figures

Fig. 1
Fig. 1
γ-Tubulin forms protein strings and γ-tubulin knockdown is cytotoxic. a, b Confocal images of fixed U2OS or U2OS expressing γTubulin sgRNA (Cas9-crispGFP; green) that were immunostained with an anti-γ-tubulin (γTubulinAb) antibody originated in mouse. a The white box shows the magnified area displayed in the inset. a, b Yellow and white arrows show γ-strings or the indicated cell, respectively (N = 5). c U2OS expressing γTubulin sgRNA (Cas9-crispGFP) at day 0 were incubated for the indicated time before fixation. Cells were stained as in a. Within samples, quantification of γ-tubulin was done with ImageJ software by comparison of immunofluorescently labelled γ-tubulin in cells expressing Cas9-crispGFP with non-expressing cells (control; N = 7–11 cells). Graph represents the relative percentage of cells that expressed Cas9-crispGFP at the indicated period of time. To adjust for differences in transfection efficiency, the sample containing the largest number of cells expressing Cas9-crispGFP was defined as 100% and values at other time points were compared with that sample (N = 3–7). d Schematic representation of the time-lapse experiments. Cells were transfected (day 0) and experiments started three or five days after, as indicated. Cell populations were monitored for three days before fixation and subsequently immunostained with an anti-γ-tubulin (γTub) antibody that originated in mouse. The levels of endogenous γ-tubulin were determined as in c. The differential interference contrast (DIC)/fluorescence images show time-lapse series from U2OS cells expressing Cas9-crispGFP (green; dashed lines). Images were collected every 8 min. Top images show four cells and their respective daughter cells (yellow, blue, orange and white) before dying (white, orange, yellow and blue). Bottom images show ten cells that either remained in interphase (yellow, light blue, dark blue, orange, black, grey, brown, magenta, green, and white) or died (black, light blue, and white) during the course of the experiment. White boxes show the live cells displayed in the insets. Insets show γ-tubulin in fixed cells (Fixed) expressing Cas9-crispGFP. Numbers in images indicate the remaining protein levels of γ-tubulin relative to control in the indicated cells (N = 3). Scale bars are 10 μm in images. Please, see Supplementary Fig. 1
Fig. 2
Fig. 2
Endogenous cytosolic γ-tubulin associates with mitochondria. a Structure of human wild-type γ-tubulin (h-γTubulin) and the γ-tubulin C terminus (C-γTubulin336–451), depicting the GTPase domain and the C-terminal region of γ-tubulin. U2OS cells stably expressing γTubulin shRNA and sh-resistant GFP-γ-tubulinresist334-449 fragment were imaged by structured illumination microscopy. The yellow arrows show γ-strings. b, c Confocal fluorescence images of fixed or live U2OS cells stably expressing γTubulin shRNA and GFP-γ-tubulinresist334–449. Mitochondria were stained with the fluorescent dye MitoTracker or with the mitochondrial marker cytochrome c oxidase subunit II (MTCO2) and the total pool of γ-tubulin was immunofluorescence stained with an anti-γ-tubulin (γTubulinAb) antibody originated in rabbit. c Co-localization pixel maps (CM) of the red and green (blue) channels of images are shown. White areas denote colocalized pixels between channels (MitoTracker (life), Person’s R = 0.7, fraction of red (MitoTracker) overlapping blue (GFP-γ-tubulinresist334–449) M1 = 1.0, fraction of blue overlapping red M2 = 0.9; MTCO2, Person’s R = 0.5, fraction of red (MTCO2) overlapping blue (GFP-γ-tubulinresist334–449) M1 = 1.0, fraction of blue overlapping red M2 = 0.8). d Confocal fluorescence images of U2OS cells stably expressing γ-tubulin336–451. The mitochondria were stained with MitoTracker and the total pool of γ-tubulin with a γTubulinAb originated in rabbit. e Immunofluorescent staining of endogenous γ-tubulin in U2OS cells transiently expressing pmTurquoise2-mito (mito) with a γTubulinAb originated in rabbit. d, e Co-localization pixel maps (CM) of the red and green (blue) channels of the magnified areas displayed in the inset (the yellow box). White areas denote colocalized pixels between channels (d, MitoTracker, Person’s R = 0.7, fraction of red (MitoTracker) overlapping blue (γTubulinAb) M1 = 1.0, fraction of blue overlapping red M2 = 0.9; e, Mito, Person’s R = 0.5, fraction of red (γTubulinAb) overlapping blue (Mito) M1 = 0.9, fraction of blue overlapping red M2 = 1.0). a, d, e The white box shows the magnified areas displayed in the inset. f Fixed U2OS cells transiently expressing γTubulin sgRNA (Cas9-crispGFP) were immunofluorescence stained with an anti-MTCO2 antibody and a γTubulinAb originated in mouse. (af) The figure shows representative images from at least six experiments. Scale bars are 10 μm in images. Please, see Supplementary Fig. 2
Fig. 3
Fig. 3
γ-Strings are associated with mitochondria. a, b Immunoelectron microscopy detection of endogenous γ-tubulin using three different conditions in high-pressure frozen (HPF) U2OS cells: first, no antibody (a), second, gold conjugated protein A (a) and third, an anti-γ-tubulin antibody originated in rabbit, and gold conjugated protein A (b, γTubulinAb). Images show the plasma membrane (PM), the nuclear envelope (NE), cytosol (C), mitochondria (MT) and nucleus (N) of a U2OS cell. Blue arrows show γ-strings and arrowheads show immunolabelled γ-strings. White arrows show the nuclear envelope or the plasma membrane, as indicated. White dashed boxes show the magnified areas displayed in the inset (N = 5). c The crude mitochondria fraction from U2OS and MCF10A cells was biochemically prepared. Each sample was subjected to immunoprecipitation (IP) with a control (C), an anti-γ-tubulin (γ; originated in mouse) or an anti-α-tubulin (α) antibody, as indicated, and developed by Western blotting (WB) with an anti-MTCO2 antibody (top, arrowhead), and then reprobed with γ-tubulin (originated in rabbit) and α-tubulin. Aliquots of the cytosolic lysates used in the immunoprecipitations were run as loading controls (lys. and Total lys.) and analyzed by Western blotting. Graph shows the mean content of γ-tubulin and α-tubulin found in their respective immunoprecipitates in the mitochondrial crude fraction. To adjust for differences between WBs, the protein content in control immunoprecipitates was defined as 1 and values of the other immunoprecipitates were compared with that level (mean ± SD; N= 4, *P < 0.05). d The biochemically isolated crude mitochondria fraction from a MCF10A cell population was fixed and immunostained with anti-γ-tubulin originating in mouse (M) or rabbit (R) and anti-MTCO2, anti-α-tubulin or anti-GCP2 antibody, as indicated. Scale bars are 10 μm in images. The electron microscopy image shows mitochondria in the crude mitochondria fraction. Arrowheads show γ-strings between and in mitochondria (N = 4). Please, see Supplementary Fig. 3
Fig. 4
Fig. 4
γ-Tubulin binds to mitochondrial DNA. a Structure of human wild-type γ-tubulin and the γ-tubulin DNA-binding domain (DnaBD), depicting residues R399, K400 and R409 in the nuclear localization signal of γ-tubulin. Confocal fluorescence microscopy of fixed U2OS stably expressing γTubulin sgRNA (Cas9-crispGFP) and co-expressing a γTubulin sgRNA resistant transcript (γTubulin) or a mutant form, γTubulinR399A-K400A-R409A (γTubulin399-400-409). The recombinant proteins were immunostained with an anti-γ-tubulin antibody (γTubulinAb) that originated in mouse. b U2OS cells were analyzed by ChIP using an anti-γ-tubulin antibody (γTubChIP) that originated in rabbit. PCR primers amplified the indicated regions of the mitochondrial DNA (N = 3). c MCF10A and γTubulin shRNA stably expressing MCF10A (γTubulin sh MCF10A) cells were synchronized in early S-phase (0 h) by double thymidine block and released for 1 h and 2 h. Cell cycle progression was monitored by determining the DNA content of cells with a nucleocounter (graphs; N = 3). Total lysate from MCF10A (Control) and MCF10A cells stably expressing γTubulin shRNA (γTub sh) were analyzed by Western blot (WB) for the expression of endogenous γ-tubulin. An α-tubulin loading control is shown (N = 3). The number on the WB indicates the level of depletion of γ-tubulin relative to control. To adjust for differences in protein loading, the protein concentration of γ-tubulin was determined by its ratio with endogenous α-tubulin. The protein ratio in control extracts was set to 1. d, e To map the location of γ-tubulin in the chromatin of MCF10A and of MCF10A cells stably expressing γTubulin shRNA (γ sh), we sequenced the DNA associated with chromatin immunoprecipitates from γ-tubulin. Immunoprecipitations were performed in early S-phase synchronized cell populations using an anti-γ-tubulin antibody. Graphs show the number of binding sites (peaks called) found in the human genome (d) or mitochondrial chromosome (e) to which γ-tubulin binds at the indicated period of time. f The graphs show ChIP-seq analysis of γ-tubulin distribution on mitochondrial chromosome (ChrM). The entire chromosome M is presented. Black arrows indicate areas loaded with γ-tubulin. In grey is the schematic representation of the called peaks (N = 2). Please, see Supplementary Fig. 4
Fig. 5
Fig. 5
The γ-tubulin meshwork controls mitochondrial activity. a GSEA of mitochondrial-upregulated gene set performed on a ranked gene list of differentially expressed genes between synchronized MCF10A (non shRNA) and γTubulinsh-MCF10A (Tubulin shRNA) cells. b Western blots (WB) show total lysates (Tot. lys.) of U2OS or MCF10A cells that stably expressed γTubulin shRNA (γTUB sh) using the indicated antibodies. Anti-α-tubulin antibody was used as loading control (N = 3). Arrowheads indicate proteins whose expression is affected by the expression of γTubulin shRNA. The numbers on the WBs indicate variations in MTCO2, ATP6, HTATIP2, SLC25A6, and γ-tubulin expression relative to γTubulin shRNA non-expressing cells, as indicated. To adjust for differences in protein loading, the protein concentration of the various proteins was determined by their ratio with α-tubulin for each sample. The protein ratio in control extracts was set to 1. c The mean values of the relative basal oxygen consumption was determined using Seahorse analyser in U2OS cells, U2OS cells stably expressing γTUB sh and stably co-expressing GFP-γ-tubulinresist (γTubGFP) or GFP-A13γ-tubulinresist (γTub13A) and U2OS cells pre-treated with CDA for 2 h. Note that CDA is present during the Seahorse assay, which takes 3 h. The data were normalized to the total number of cells. The oxygen consumption rate activity of U2OS cells was set as 1, and relative activities were calculated (mean ± SEM; N = 4–6, ***P < 0.001). d Structure of human wild-type γ-tubulin (h-γTubulin), depicting residue Cys13 in the GTPase domain of γ-tubulin. Graph shows seahorse assay of the respiratory capacity after addition of glucose mixture (20 mM glucose, 20 μg/ml insulin), 4 μg/ml oligomycin, 1 μM FCCP and 0.5 μM Rotenone in 28 × 103 of the indicated cells. Note the very low basal oxygen consumption rate of CDA-treated U2OS cells (mean ± SEM; N= 4–6). e WST-1 assay showing the metabolic activity of U2OS cells transfected with the indicated construct or after 4 h CDA pre-treatment (mean ± SEM; N = 6, ***P < 0.001)
Fig. 6
Fig. 6
Reduced protein levels of γ-tubulin increase mitochondrial mass. a, b Total lysate (Tot. lys.) of U2OS cells, U2OS cells stably expressing γTubulin shRNA (γTUB sh) and U2OS treated with CDA or DMF for 4 h (a) or 24 h (b) before harvested. Protein levels of the mitochondrial marker MTCO2 and γ-tubulin were analyzed by Western blotting (WB) with an anti-MTCO2 and anti-γ-tubulin antibody, both originated in rabbit. Anti-α-tubulin was used as loading control (N = 4). c U2OS cells were transiently transfected with γTUB sh (day 0) or control shRNA (control sh) and changes in the protein levels of γ-tubulin, MTCO2, Drp1, Opa1 and Mfn1 and in the metabolic activity were analyzed by Western blotting (N = 3). ac Anti-α-tubulin antibody was used as loading control. Numbers on the WBs indicate variations in MTCO2, Drp1, Opa1 and Mfn1 expression relative to day 0, as indicated. To adjust for differences in protein loading, the protein concentration of the various proteins was determined by their ratio with α-tubulin for each sample. The protein ratio in control extracts was set to 1. d WST-1 assay showing the metabolic activity of U2OS cells transfected with the indicated construct and treated as in c (mean ± SEM; N = 6). e Ratio between mitochondrial and nuclear DNA content measured by quantitative PCR in U2OS and U2OS cells stably expressing γTub sh and stably co-expressing GFP-γ-tubulinresist (γTubGFP) or GFP-A13γ-tubulinresist (γTub13A) and U2OS cells pre-treated with CDA for 4 h (mean ± SEM; N = 3, *P < 0.05; each sample the qPCR reaction was performed in triplicates). f Extracts from the mitochondria crude fraction from synchronous and non-synchronous (ns) MCF10A and MCF10A cells stably expressing γTUB sh were examined by WB using an antibody against DNA polymerase gamma (N = 3). DNA content was determined with a nuclear counter (percentage of S-phase cells indicated). The remaining mitochondrial crude depleted lysate (Tot. lys.) was run as loading control and examined with an anti-α-tubulin antibody. Numbers on the WBs indicate variations in γ-tubulin expression and are calculated as in a. Please see Supplementary Fig. 5
Fig. 7
Fig. 7
Sg-mediated knockdown of γ-Tubulin affects the activity of the mitochondria, but not the structure of the endoplasmic reticulum. a Confocal fluorescence microscopy of fixed U2OS stably expressing γTubulin sgRNA (Cas9-crispGFP) along or with a γTubulin sgRNA resistant gene (γTubulin). The protein levels of γ-tubulin in γTubulin sgRNA expressing cells were immunostained with an anti-γ-tubulin antibody (γTubulinAb) originating in mouse (N = 5). b U2OS were transfected with γTubulin sgRNA (Cas9Crisp-γTubulin sg) at day 0 and incubated for 7 days. Graphs show the mitochondrial membrane potential changes and the maximal hyperpolarization (maximal drop in emission) before oligomycin treatment (Δmin TMRM emission 590 nm) of single U2OS cells or single U2OS cells transiently expressing γTubulin sgRNA alone or with a γTubulin sgRNA resistant gene (γTubulin sg-resist.). The mitochondrial membrane potential was analyzed after addition of 20 mM glucose, 4 μg/ml oligomycin and 1 μM FCCP by recording the mitochondrial accumulation of the cell-permeant dye tetramethylrhodamine methyl ester (TMRM; mean ± SEM; unpaired two tailed Student’s t-test, Cas9Crisp-γTubulinsg vs. Cas9Crisp-γTubulinsg-γTubulin sg-resist, ***P < 0.001, ****P < 0.0001; U2OS, N = 107 cells; Cas9Crisp-γTubulinsg N = 46 cells; Cas9Crisp-γTubulinsg-γTubulin sg-resist. N = 128 cells). c Immunoelectron microscopy detection of endogenous γ-tubulin using an anti-γ-tubulin antibody that originated in rabbit, and gold conjugated protein A (γTubulinAb) in high-pressure frozen (HPF) U2OS cells. Images show the cytosol (C), mitochondria (MT) and endoplasmic reticulum (ER) of a U2OS cell. White dashed box shows the magnified area displayed in the inset (N = 5). d Confocal fluorescent microscopy of fixed U2OS or fixed U2OS transiently expressing γTubulin sgRNA (Cas9-crispGFP) that were immunostained with an anti-γ-tubulin (γTubulinAb) antibody that originated in rabbit, and with an antibody that recognized the ER marker calnexin (N = 5). Please, see Supplementary Fig. 4
Fig. 8
Fig. 8
The cellular metabolite fumarate and γ-tubulin controls the shape of the mitochondrial network. a Confocal fluorescence images of fixed U2OS cells treated for 4 h with the indicated concentrations of DMF. The images show immunofluorescence stained endogenous γ-tubulin and MTCO2 using an anti-γ-tubulin (γTubulinAb) that originated in mouse, and an anti-MTCO2 antibody. Arrowheads and white boxes show cytosolic areas with discontinuous γ-strings and the magnified areas are displayed in the insets, respectively. WST-1 assay (relative mitochondrial succinate-tetrazolium reductase activity) showing the metabolic activity of DMF-treated U2OS cells (mean ± SD; N= 4–16, ***P < 0.001). The graph shows the percentage of cells with more than two areas containing discontinuous cytosolic γ-strings. A minimum of 100 cells was counted in each sample, and the percentage of cells was calculated (bottom; mean ± SD; N = 3, *P < 0.05, ***P < 0.001). b WST-1 assay showing the metabolic activity of DMF and CDA-treated U2OS and U2OS cells stably expressing γTubulin shRNA (mean ± SD; N = 3, *P < 0.05). c Confocal fluorescent microscopy of fixed U2OS cells that stably expressed γTubulin shRNA and co-expressed GFP-γ-tubulinresist or GFP-A13γ-tubulinresist. The fluorescent images show representative areas of immunostained cells with an anti-γ-tubulin antibody, which recognized endogenous γ-tubulin and an endogenous anti-MTCO2, as indicated (N = 5). a, c The white boxes show the magnified areas displayed in the insets. Scale bars are 10 μm in images. Please, see Supplementary Figs. 5 and 6
Fig. 9
Fig. 9
Increased mitochondria protein transport and low cellular mitochondria content affect the γ-tubulin meshwork. ac Confocal fluorescent microscopy of fixed and live U2OS cells that stably expressed γTubulin shRNA and co-expressed the sh-resistant GFP-γ-tubulinresist (a), the Cyst to Ala GFP-A13γ-tubulinresist (b) or GFP (c) and transiently expressed pmTurquoise2-mito (mito), as indicated. Endogenous MTCO2 was stained with an anti-MTCO2 antibody (N = 3). d Average intensity projection of three Z-stack images (Z-stack) of fixed human clear cell renal carcinoma (ccRCC) and human normal kidney cells. Cells were imaged by confocal immunofluorescent staining with an anti-γ-tubulin antibody (γTubulinAb) that originated in mouse, and anti-MTCO2 antibody (N = 3). The yellow box shows co-localization pixel-map (CM) of the red and green (blue) channels of the magnified area displayed in the inset. White areas denote colocalized pixels between channels (ccRCC, Person’s R = 0.3, fraction of red (MTCO2) overlapping blue (γTubulinAb) M1 = 0.9, fraction of blue overlapping red M2 = 0.8; normal kidney, Person’s R = 0.12, M1 = 0.9, M2 = 0.7. ad Scale bars 10 μm. e The GTPase domain of γ-tubulin is necessary for organizing a meshwork of mitochondria-associated strings that regulates mitochondrial respiratory capacity and gene expression and connects these organelles to the nuclear envelope. The metabolite fumarate and mitochondrial-targeted protein transport regulate the γ-tubulin meshwork. Please, see Supplementary Fig. 2

References

    1. Bornens M. Organelle positioning and cell polarity. Nat. Rev. Mol. Cell. Biol. 2008;9:874–886. doi: 10.1038/nrm2524. - DOI - PubMed
    1. Ananthakrishnan R, Ehrlicher A. The forces behind cell movement. Int. J. Biol. Sci. 2007;3:303–317. doi: 10.7150/ijbs.3.303. - DOI - PMC - PubMed
    1. Kollman JM, Merdes A, Mourey L, Agard DA. Microtubule nucleation by gamma-tubulin complexes. Nat. Rev. Mol. Cell. Biol. 2011;12:709–721. doi: 10.1038/nrm3209. - DOI - PMC - PubMed
    1. Alvarado-Kristensson M, Rodriguez MJ, Silio V, Valpuesta JM, Carrera AC. SADB phosphorylation of gamma-tubulin regulates centrosome duplication. Nat. Cell Biol. 2009;11:1081–1092. doi: 10.1038/ncb1921. - DOI - PubMed
    1. Rossello CA, Lindstrom L, Glindre J, Eklund G, Alvarado-Kristensson M. Gamma-tubulin coordinates nuclear envelope assembly around chromatin. Heliyon. 2016;2:e00166. doi: 10.1016/j.heliyon.2016.e00166. - DOI - PMC - PubMed