. 2018 Jun 7:1:63.
doi: 10.1038/s42003-018-0059-x. eCollection 2018.

Sea turtle fibropapilloma tumors share genomic drivers and therapeutic vulnerabilities with human cancers

Affiliations

Sea turtle fibropapilloma tumors share genomic drivers and therapeutic vulnerabilities with human cancers

David J Duffy et al. Commun Biol. .

Abstract

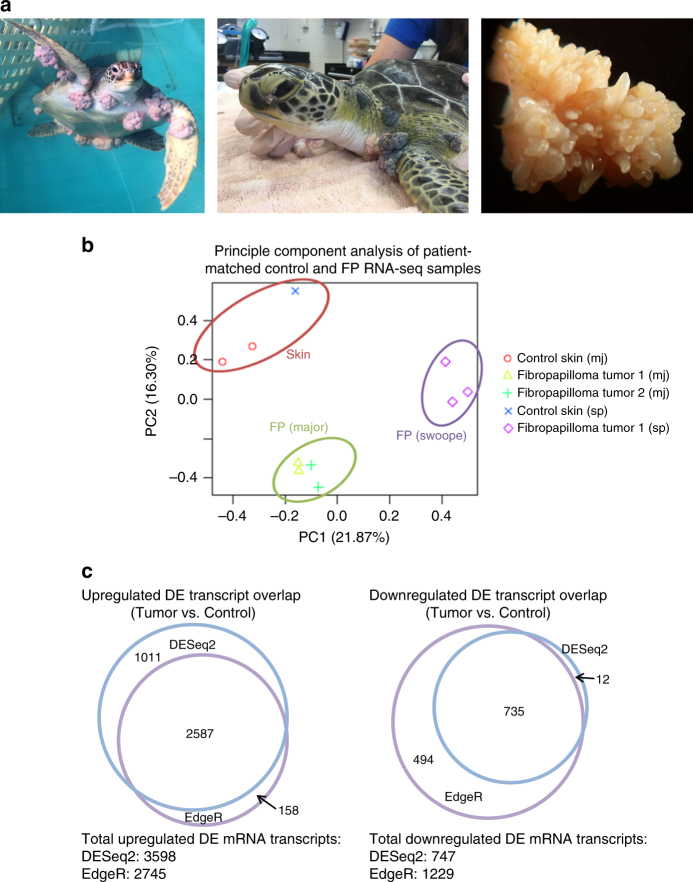
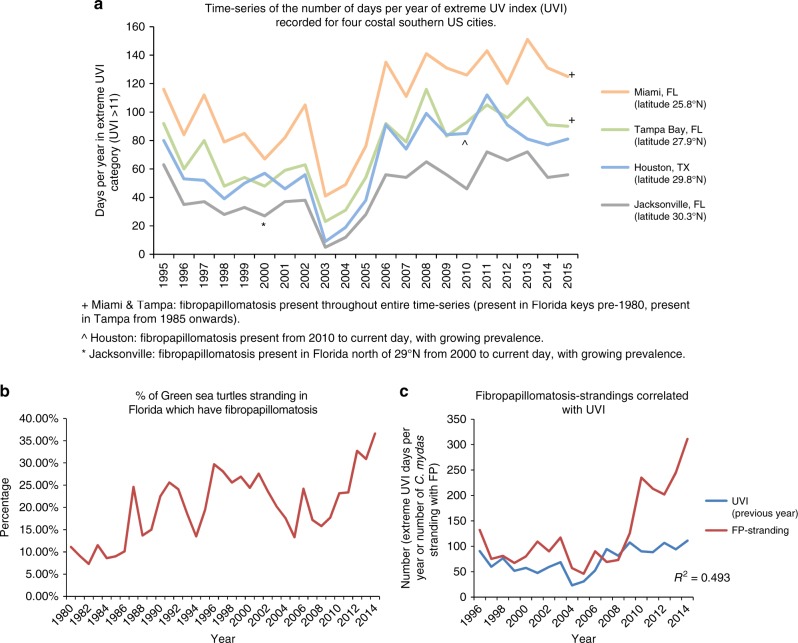
Wildlife populations are under intense anthropogenic pressures, with the geographic range of many species shrinking, dramatic reductions in population numbers and undisturbed habitats, and biodiversity loss. It is postulated that we are in the midst of a sixth (Anthropocene) mass extinction event, the first to be induced by human activity. Further, threatening vulnerable species is the increased rate of emerging diseases, another consequence of anthropogenic activities. Innovative approaches are required to help maintain healthy populations until the chronic underlying causes of these issues can be addressed. Fibropapillomatosis in sea turtles is one such wildlife disease. Here, we applied precision-medicine-based approaches to profile fibropapillomatosis tumors to better understand their biology, identify novel therapeutics, and gain insights into viral and environmental triggers for fibropapillomatosis. We show that fibropapillomatosis tumors share genetic vulnerabilities with human cancer types, revealing that they are amenable to treatment with human anti-cancer therapeutics.


Conflict of interest statement

The authors declare no competing interests.

Figures

Fig. 1
Fig. 1
Fibropapillomatosis tumors and differential transcript expression. a Fibropapillomatosis-afflicted green sea turtles (Chelonia mydas). Left and center: Turtles at the Whitney Sea Turtle Hospital, FL, prior to tumor removal surgery. Right: High magnification image of a fibropapilloma tumor, which was profiled by RNA-seq. b Principle component analysis of patient-matched control and fibropapillomatosis RNA-seq samples. Upon admittance to the hospital, Swoope (sp) had a tumor score of class 3 (Hawaii classification system), and severe (FPI > 185.5) (Southwest Atlantic classification system), while Major (mj) had a tumor score of class 2, and moderate (FPI = 81.5). c Overlap of transcripts differentially expressed in fibropapillomatosis tumors, independently called by DESeq2 and EdgeR from the RNA-seq data. Area-proportional Venn diagrams were generated using BioVenn (http://www.biovenn.nl/). Transcripts were considered to be DE if passing the following cut-offs: false discovery rate (EdgeR) or adjusted p-value (DESeq2) of <0.05 and log2 fold change of >2 or <−2
Fig. 2
Fig. 2
Differentially expressed host (C. mydas) and viral (ChHV5) transcripts. a Top ten statistically significant upregulated and top ten downregulated transcripts in fibropapillomatosis tumors compared with control tissue. Transcript expression values underlying the differential expression analysis are provided in Supplementary Table 4. Differential expression p-values reported are adjusted p-values, generated by DESeq2 by a Wald test followed by Benjamini–Hochberg correction. b Relative expression of Fndc1 mRNA in fibropapillomatosis tumor and control samples, as detected by RT-qPCR. Data for 66 tumor samples and 14 control samples. The p-value was calculated by t-test. c Expression levels (trimmed mean of M values, TMM) of ChHV5 viral RNA de novo transcripts across the ten RNA-seq samples. Related transcript variants are denoted by t.1, t.2, or t.3
Fig. 3
Fig. 3
Transcripts differentially expressed in fibropapillomatosis are associated with nervous system development. a Protein–protein interaction map of the top differentially expressed transcripts (RNA-seq) with homology to characterized human genes. Generated from the top 600 (300 per direction of regulation) differentially expressed transcripts. Nervous system development-related nodes are highlighted by red shading. Network generated by the STRING database (v10.5, http://www.stringdb.org), with the inbuilt KEGG pathway enrichment analysis tool applied to this network. b Fold change in expression of the differentially expressed transcripts (RNA-seq) related to nervous system development (KEGG), listed in order of false discovery rate (FDR, KEGG pathway enrichment analysis tool). Transcript expression values underlying the differential expression analysis are provided in Supplementary Table 4
Fig. 4
Fig. 4
Pathway, disease gene ontology (GO) term, and transcriptional regulator analysis of the top 600 transcripts differentially expressed in fibropapillomatosis tumors. a Top 50 canonical pathways of the fibropapillomatosis tumor differentially expressed transcripts (RNA-seq), as detected by IPA, ranked by p-value (calculated by right-tailed Fisher’s Exact Test, with Benjamini–Hochberg correction). b Activation/inhibition z-scores of the canonical pathways of the fibropapillomatosis tumor differentially expressed transcripts, as detected by IPA. c Activation z-scores of the top 25 disease-associated GO terms of the fibropapillomatosis tumor differentially expressed transcripts (RNA-seq), as detected by IPA, ranked by p-value (calculated by right-tailed Fisher’s Exact Test, with Benjamini–Hochberg correction). d Activation/inhibition z-scores of the inferred transcriptional regulators (ITRs) of the fibropapillomatosis tumor differentially expressed transcripts (RNA-seq), as detected by IPA, ranked by p-value (calculated by right-tailed Fisher’s Exact Test, with Benjamini–Hochberg correction). Legend of x-axis labels for Fig. 3a–c is also provided in Supplementary Table 5
Fig. 5
Fig. 5
Wnt, SHH, and BMP pathways in fibropapillomatosis tumors. a Left: Activation/inhibition z-scores of Wnt- and SHH-related IPA pathway analysis findings of the fibropapillomatosis tumor differentially expressed transcripts (RNA-seq), p-values calculated by right-tailed Fisher’s Exact Test, with Benjamini–Hochberg correction. Right: Interaction map of the 43 Wnt, SHH, and BMP pathway component and target genes differentially expressed in fibropapillomatosis tumors (RNA-seq). Image generated using GeneMANIA (v3.5.0, http://genemania.org/). In addition to the 43 DE genes (nodes with stripped shading), 20 closely functionally-related network components are also shown (nodes with uniform shading). Basal Cell Carcinoma KEGG pathway score of the DE components of the network is shown below the network. b Fold change in expression of the differentially expressed transcripts (RNA-seq) of Wnt, SHH, and BMP pathway-related genes. When more than one transcript of a gene was present in the top 600 DE genes (300 per direction), each transcript is denoted by t1, t2, t3, etc. Differential expression p-values reported are adjusted p-values, generated by DESeq2, by a Wald test followed by Benjamini–Hochberg correction. Transcript expression values underlying the differential expression analysis are provided in Supplementary Table 4. c Relative expression of Wnt5a mRNA in a panel fibropapillomatosis tumor and control samples, as detected by RT-qPCR. Data for 66 tumor samples and 13 control samples. The p-value was calculated by t-test
Fig. 6
Fig. 6
Putative fibropapillomatosis prevalence and ultraviolet (UV) radiation exposure link. a Number of days annually in the extreme UV index (UVI) category recorded in Miami, Tampa Bay, Houston, and Jacksonville (data obtained from: http://www.ftp.cpc.ncep.noaa.gov/long/uv/cities/). Dates for the occurrence of fibropapillomatosis in the vicinity of each UVI sampling site obtained from Hargrove et al.. b Annual percentage of green sea turtles stranding in FL afflicted with fibropapillomatosis, obtained from Foley et al.. c Yearly averages of Jacksonville, Miami, and Tampa Bay UVI extreme days annually, vs. annual fibropapillomatosis-afflicted green turtle strandings in FL. Correlation between fibropapillomatosis strandings and UVI conducted using R2 linear regression analysis
Fig. 7
Fig. 7
Fibropapillomatosis eye tumor regrowth rates in the presence and absence of adjunct 5FU treatment. a Green sea turtles afflicted with fibropapillomatosis eye tumors. b Fibropapilloma eye tumor regrowth rates, when treatment consists of surgical removal only, or surgical removal followed by 8 weeks of topical 5-FU treatment. Total n = 121 turtles, with the number of turtles per condition inserted within the relevant section of each bar

References

    1. Smith GC, Coates CW. Fibro-epithelial growths of the skin in large marine turtles Chelonia mydas. Zoologica. 1938;23:93–98.
    1. Lucke B. Studies on tumors in cold-blooded vertebrates. Annual Report of the Tortugas Laboratory of the Camegie Institute. 1938;1937:92–94.
    1. Cruz Sr, E. (1985). Saga of the sea turtle. FL, USA: Privately-published.
    1. Whilde J, Martindale MQ, Duffy DJ. Precision wildlife medicine: applications of the human-centred precision medicine revolution to species conservation. Global Change Biology. 2017;23:1792–1805. doi: 10.1111/gcb.13548. - DOI - PubMed
    1. Jones K, Ariel E, Burgess G, Read M. A review of fibropapillomatosis in green turtles (Chelonia mydas) Veterinary Journal. 2016;212:48–57. doi: 10.1016/j.tvjl.2015.10.041. - DOI - PubMed