. 2018 Jun 21:1:73.
doi: 10.1038/s42003-018-0079-6. eCollection 2018.

Rapid and gentle hydrogel encapsulation of living organisms enables long-term microscopy over multiple hours

Affiliations

Rapid and gentle hydrogel encapsulation of living organisms enables long-term microscopy over multiple hours

Kyra Burnett et al. Commun Biol. .

Abstract

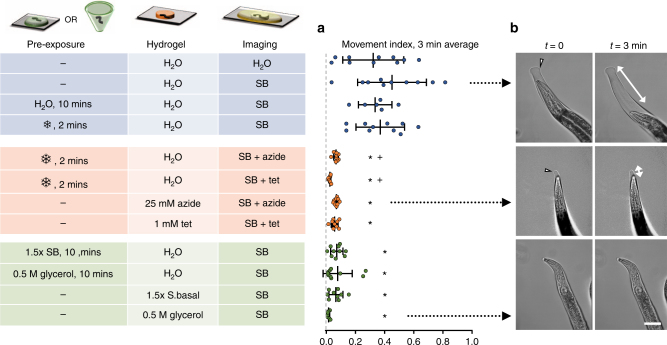
Imaging living organisms at high spatial resolution requires effective and innocuous immobilization. Long-term imaging places further demands on sample mounting with minimal perturbation of the organism. Here we present a simple, inexpensive method for rapid encapsulation of small animals of any developmental stage within a photo-crosslinked polyethylene glycol (PEG) hydrogel, gently restricting movement within their confined spaces. Immobilized animals maintain their original morphology in a hydrated environment compatible with chemical treatment, optical stimulation, and light-sheet microscopy. We demonstrate prolonged three-dimensional imaging of neural responses in the nematode Caenorhabditis elegans, recovery of viable organisms after 24 h, and imaging of larger squid hatchlings. We characterize a range of hydrogel and illumination conditions for immobilization quality, and identify paralytic-free conditions suitable for high-resolution single-cell imaging. Overall, PEG hydrogel encapsulation provides fast, versatile, and gentle mounting of small living organisms, from yeast to zebrafish, for continuous observation over hours.


Conflict of interest statement

WPI has filed a provisional patent application based in part on the results included in this manuscript. The authors declare no competing interests.

Figures

Fig. 1
Fig. 1
Mounting live C. elegans in hydrogels and on agarose pads for microscopy. a Schematic of worm mounting procedures by PEG hydrogel encapsulation or on agar pads. bd Images taken over 9 h in a 10% PEG hydrogel (b) or on agarose pads with 25 mM sodium azide (c) or with 100 nm polystyrene beads (d). Red vertical line indicates a pharyngeal landmark position at each time point, blue lines indicate the initial landmark position, and white arrow indicates displacement relative to time t = 0 h. Arrowheads indicate morphological changes such as necrotic cell death after prolonged azide exposure. Scale bar, 10 µm. e Multiple larval and adult stages embedded in the same hydrogel. The hydrogel edge is indicated by a faint line (arrow), surrounded by about 100–200 µm of uncrosslinked polymer. Scale bar, 100 µm. f Worms embedded in a 20% PEG hydrogel were imaged immediately after crosslinking and after release 12 h later. Arrowheads indicate cavities in the hydrogel formerly occupied by worms. Scale bars, 200 and 100 µm (inset)
Fig. 2
Fig. 2
Characterization of PEG hydrogel crosslinking rates. a Crosslinking time determined by immobilization of young adult animals in 10–20% PEG-DA exposed with 365, 312, and 308 nm ultraviolet sources. Each point represents the mean of n = 10 independent trials, with each trial averaging measurements from two to five worms. Error bars represent standard deviation. Statistics were performed using ordinary two-way ANOVA with Bonferroni’s post hoc tests for pairwise comparisons: *P < 0.001 for each concentration compared to 10% PEG-DA, and +P < 0.001 or (+)P < 0.05 for each source compared to 308 nm UV. b Absorbance spectrum of 0.001% I2959 (gray, left axis), and emission spectra for each ultraviolet exposure source (right axis). Emission spectra were normalized such that area under each curve matched total output power
Fig. 3
Fig. 3
Buffer conditions before, during, and after hydrogel crosslinking influence immobilization for microscopy. Pre-exposure to hypo- or hyper-osmotic solutions for 10 min, or cooling pretreatment (snowflake symbol represents on ice or in a –20 °C freezer for 2 min), occurred in a droplet or microtube. Hydrogel solutions (20%) were prepared in water (H2O), S-Basal buffer (SB), 25 mM sodium azide (azide) or 1 mM tetramisole (tet) in water, 500 mM glycerol in water, or 1.5× S-Basal buffer. a Each dot represents the mean movement index over 3 min (Supplementary Figs. 4, 5), n= 7–10 worms per condition. Vertical and error bars represent mean and standard deviation. b Images represent typical movement under the conditions indicated by black arrows. Arrowheads indicate the edge of the hydrogel; animal movement can occur within this confined space (white arrows). Scale bar, 30 μm. Statistics were performed using ordinary two-way ANOVA with Bonferroni’s post hoc tests for pairwise comparisons: *P < 0.0001 compared with the hydrogel control with SB, and +P < 0.0001 compared with the hydrogel cooling control with SB
Fig. 4
Fig. 4
Long-term volumetric imaging of optogenetically stimulated neurons in living C. elegans. Animals expressing Chrimson and GCaMP2.2b in AWA sensory neurons were stimulated by red light and imaged using a diSPIM light-sheet microscope. a Schematic of diSPIM objectives, hydrogel, and red light exposure. b Three-dimensional volumetric view of AWA neurons. ce Maximum intensity projections highlighting ROIs of AWAL and AWR cell bodies and AWAR dendrite, at t = 0 h (c), 6 h (d), and 13.5 h (e) time points. Scale bars, 20 μm. fh Time-lapse recordings of GCaMP signal in each ROI beginning at each time point. The stimulation LED was pulsed for 10 s, once per minute. Continuous recordings lasted for 1 h per time point; here, 30 min are shown for clarity. ik Mean fluorescence (ΔF/F0) is calculated for the 30 stimulation pulses indicated in fh, with shading indicating s.e.m., and red bars above indicating 10-s red light exposure
Fig. 5
Fig. 5
Encapsulation of a living pygmy squid hatchling in PEG hydrogel for light-sheet imaging. a Three-day-old squid hatchling was stained with 1 µM BODIPY C3 succinimidyl ester and embedded in a 1.2 mm thick, 4 mm diameter hydrogel disk and viewed in brightfield (a, b) and on a fluorescent dissecting microscope (c). d Raw light-sheet image slices of one squid arm indicated in panel c (box) are shown at 5 µm increments. Scale bars: 1 mm (a), 250 µm (b, c), 50 µm (d)

References

    1. Chalfie M, Tu Y, Euskirchen G, Ward WW, Prasher DC. Green fluorescent protein as a marker for gene expression. Science. 1994;263:802–805. doi: 10.1126/science.8303295. - DOI - PubMed
    1. Knöpfel T. Genetically encoded optical indicators for the analysis of neuronal circuits. Nat. Rev. Neurosci. 2012;13:687–700. doi: 10.1038/nrn3293. - DOI - PubMed
    1. Laissue PP, Alghamdi RA, Tomancak P, Reynaud EG, Shroff H. Assessing phototoxicity in live fluorescence imaging. Nat. Methods. 2017;14:657–661. doi: 10.1038/nmeth.4344. - DOI - PubMed
    1. Shaham, S., ed., WormBook: Methods in Cell Biology (January 02, 2006), WormBook, ed. The C. elegans Research Community, WormBook, doi/10.1895/wormbook.1.49.1, http://www.wormbook.org.
    1. Kim E, Sun L, Gabel CV, Fang-Yen C. Long-term imaging of Caenorhabditis elegans using nanoparticle-mediated immobilization. PLoS ONE. 2013;8:e53419. doi: 10.1371/journal.pone.0053419. - DOI - PMC - PubMed