. 2018 Jun 27:1:79.
doi: 10.1038/s42003-018-0085-8. eCollection 2018.

RAiSD detects positive selection based on multiple signatures of a selective sweep and SNP vectors

Affiliations

RAiSD detects positive selection based on multiple signatures of a selective sweep and SNP vectors

Nikolaos Alachiotis et al. Commun Biol. .

Abstract

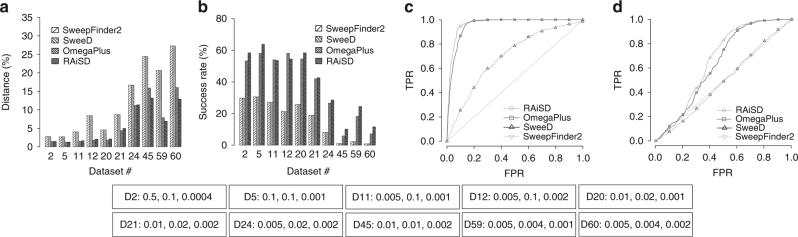
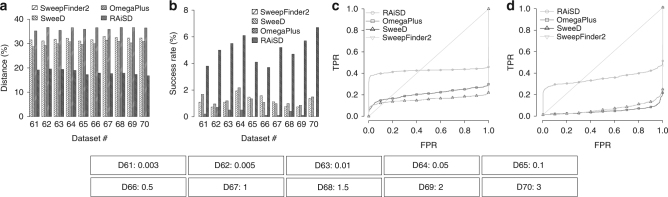
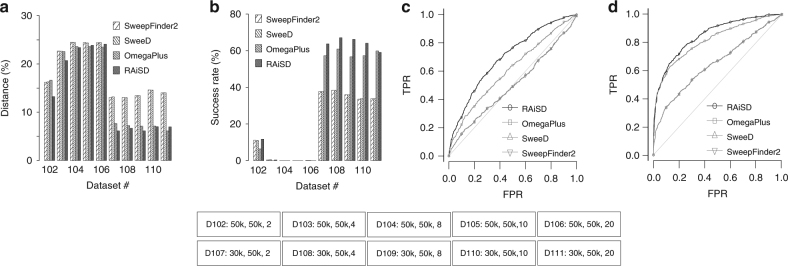
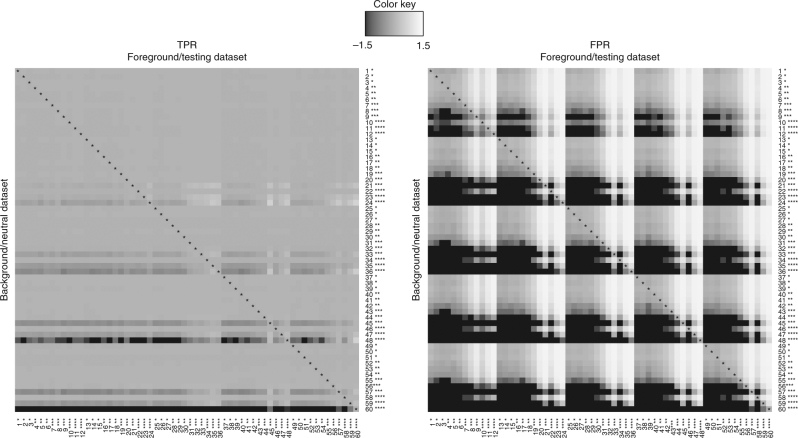
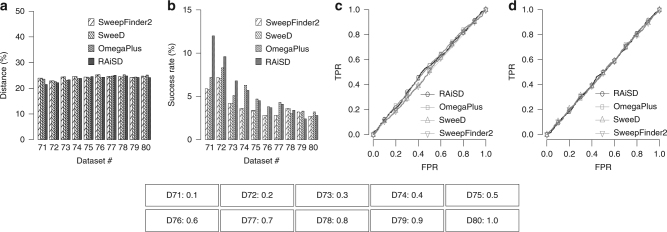
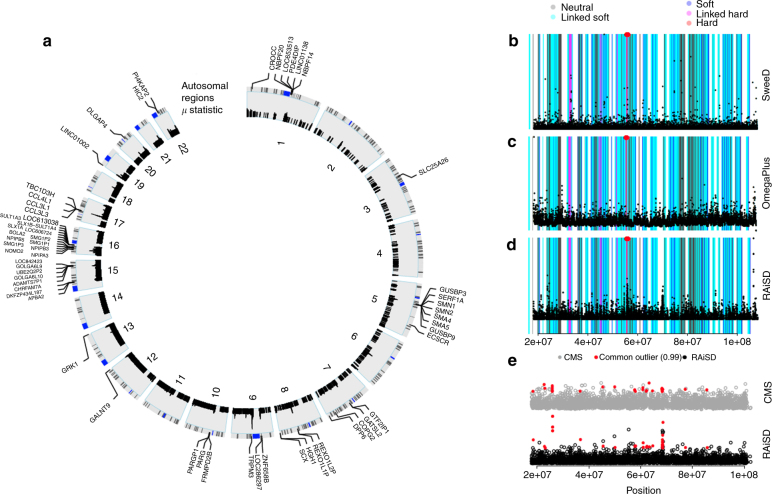
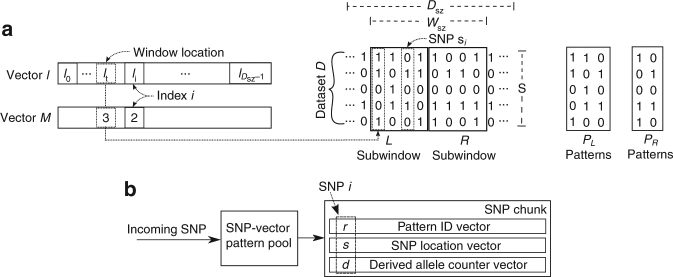
Selective sweeps leave distinct signatures locally in genomes, enabling the detection of loci that have undergone recent positive selection. Multiple signatures of a selective sweep are known, yet each neutrality test only identifies a single signature. We present RAiSD (Raised Accuracy in Sweep Detection), an open-source software that implements a novel, to our knowledge, and parameter-free detection mechanism that relies on multiple signatures of a selective sweep via the enumeration of SNP vectors. RAiSD achieves higher sensitivity and accuracy than the current state of the art, while the computational complexity is greatly reduced, allowing up to 1000 times faster processing than widely used tools, and negligible memory requirements.


Conflict of interest statement

The authors declare no competing interests.

Figures

Fig. 1
Fig. 1
RAiSD evaluation and comparison with SweepFinder2, SweeD, and OmegaPlus, for a subset of the bottleneck models. a Detection accuracy, measured as the average distance between the reported locations and the known target of selection (reported as a percentage over the region length). b Success rate, reported as the percentage of the runs with best-score location in the proximity (closer than 1% of the region length) of the known target of selection. c ROC curve for bottleneck model 45. d ROC curve for bottleneck model 60. The parameters that vary per model are provided below the plots in the form: “D[#]: [severity], [begin time], [duration]”
Fig. 2
Fig. 2
RAiSD evaluation and comparison with SweepFinder2, SweeD, and OmegaPlus, for the migration models. a Detection accuracy, measured as the average distance between the reported locations and the known target of selection (reported as a percentage over the region length). b Success rate, reported as the percentage of the runs with best-score location in the proximity (closer than 1% of the region length) of the known target of selection. c ROC curve for migration model 61. d ROC curve for migration model 70. The parameter that varies per model is provided below the plots in the form: “D[#]: [population join time]”
Fig. 3
Fig. 3
RAiSD evaluation and comparison with SweepFinder2, SweeD, and OmegaPlus, for the models with a recombination hotspot and a selective sweep. a Detection accuracy, measured as the average distance between the reported locations and the known target of selection (reported as a percentage over the region length). b Success rate, reported as the percentage of the runs with best-score location in the proximity (closer than 1% of the region length) of the known target of selection. c ROC curve for recombination model 102 (sweep location: 50 kb, center of recombination hotspot: 50 kb). d ROC curve for recombination model 107 (sweep location: 30 kb, center of recombination hotspot: 50 kb). The parameters that vary per model are provided below the plots in the form: “D[#]: [sweep location], [center of hotspot], [recombination intensity]”
Fig. 4
Fig. 4
Evaluation of RAiSD performance in terms of TPR (left panel) and FPR (right panel) when the background/neutral (or base) model for the 60 bottleneck models is misspecified. The number of ‘*’ characters next to the dataset number represents the reduction of the population size during the bottleneck phase. The colors of the tiles in the TPR heatmap represent the log10(PTTPTA), where PTT is the TPR when the foreground and background models match (diagonal), and PTA is the measured TPR for the foreground model. In the FPR heatmap, the colors represent the log10(PFTPFA), where PFT is the FPR when the foreground and background models match, and PFA is the measured FPR for the foreground model. Thus, darker/lighter tiles than the one on the diagonal indicate the effect of model misspecification toward smaller/larger rates than the one calculated when the demographic model is correctly inferred. The TPR heatmap reveals that, when a bottleneck is assumed as the null model, the TPR is not greatly affected, even if a bottleneck is not present in the evaluation dataset. The FPR heatmap, however, suggests that bottlenecks generate a high number of false positives when not taken into account
Fig. 5
Fig. 5
Soft sweeps cannot be detected with hard-sweep detection methods. Even if a mutation starts to be beneficial at frequency 0.1, hard selective sweep methods behave as random classifiers and are unable to accurately detect the sweep location. a Detection accuracy, measured as the average distance between the reported locations and the known target of selection (reported as a percentage over the region length). b Success rate, reported as the percentage of the runs with best-score location in the proximity (closer than 1% of the region length) of the known target of selection. c ROC curve for dataset 71. d ROC curve for dataset 75. The parameter that varies per model is provided below the plots in the form: “D[#]: [frequency at which mutation starts being beneficial]”
Fig. 6
Fig. 6
Detection of selective sweeps in the YRI population. a Selected top genes (threshold set to 99.95%) identified as targets of positive selection for all chromosomes in the YRI population (full list provided in Supplementary Table 1). b-d The results of SweeD, OmegaPlus, and RAiSD for chromosome 14, in comparison with the results of S/HIC. S/HIC is a machine learning tool, thus each region is classified as neutral (dark-gray), linked soft (light blue), soft (purple), linked hard (pink), and hard (red). For clarity, hard-sweep regions are also denoted by a red dot at the top of each plot. e Common outliers between CMS and RAiSD for chromosome 14
Fig. 7
Fig. 7
μ statistic computation example and the SNP-loading mechanism. a A window W of Wsz SNPs as considered for the calculation of the μ statistic. The location vector l and the derived-allele vector M correspond to the entire genomic region that is scanned, whereas the SNP window W is applied locally on Wsz SNPs following a sliding-window approach with a step of 1 SNP. b Schematic representation of the SNP-loading mechanism, as well as the SNP representation and the data structure on which RAiSD computes the μ statistic. Each SNP is matched in the SNP-vector pattern pool and a triplet of values (the pattern ID, the SNP location, and the number of derived alleles) is returned to the SNP-chunk data structure

References

    1. Schaffner, S. & Sabeti, P. Evolutionary adaptation in the human lineage. Nat. Educ.1, 14 (2008).
    1. De Groot NG, Bontrop RE. The hiv-1 pandemic: does the selective sweep in chimpanzees mirror humankinds future? Retrovirology. 2013;10:53. doi: 10.1186/1742-4690-10-53. - DOI - PMC - PubMed
    1. Alam MT, et al. Selective sweeps and genetic lineages of plasmodium falciparum drug-resistant alleles in ghana. J. Infect. Dis. 2011;203:220–227. doi: 10.1093/infdis/jiq038. - DOI - PMC - PubMed
    1. Smith JM, Haigh J. The hitch-hiking effect of a favourable gene. Genet. Res. 1974;23:23–35. doi: 10.1017/S0016672300014634. - DOI - PubMed
    1. Braverman JM, Hudson RR, Kaplan NL, Langley CH, Stephan W. The hitchhiking effect on the site frequency spectrum of dna polymorphisms. Genetics. 1995;140:783–796. - PMC - PubMed