. 2018 Sep 3:1:128.
doi: 10.1038/s42003-018-0134-3. eCollection 2018.

Conformational signatures in β-arrestin2 reveal natural biased agonism at a G-protein-coupled receptor

Affiliations

Conformational signatures in β-arrestin2 reveal natural biased agonism at a G-protein-coupled receptor

Arfaxad Reyes-Alcaraz et al. Commun Biol. .

Abstract

Discovery of biased ligands and receptor mutants allows characterization of G-protein- and β-arrestin-mediated signaling mechanisms of G-protein-coupled receptors (GPCRs). However, the structural mechanisms underlying biased agonism remain unclear for many GPCRs. We show that while Galanin induces the activation of the galanin receptor 2 (Galr2) that leads to a robust stimulation toward Gαq-protein and β-arrestin1/2, an alternative ligand Spexin and its analog have biased agonism toward G-protein signaling relative to Galanin. We used intramolecular fluorescein arsenical hairpin bioluminescence resonance energy transfer-based biosensors of β-arrestin2 combined with NanoBit technology to measure β-arrestin2-Galr2 interactions in real-time living systems. We found that Spexin and Galanin induce specific active conformations of Galr2, which may lead to different internalization rates of the receptor as well as different signaling outputs. This work represents an additional pharmacological evidence of endogenous G-protein-biased agonism at a GPCR.


Conflict of interest statement

The authors declare no competing interests.

Figures

Fig. 1
Fig. 1
Amino acid sequence alignment of human Galanin, Spexin, and the Galr2-selective agonist Fmoc-dA4-dQ14. Galanin and Spexin residues are shown in pink and green, respectively. Conserved amino acids are highlighted in yellow. N-terminus modifications and d-amino acids are marked in red and blue, respectively
Fig. 2
Fig. 2
The effect of different endogenous ligands in β-arrestin1/2 recruitment. a Schematic representation of the structural complementation assay used to monitor β-arrestin1/2–Galr2 interactions. Kinetic traces of β-arrestin1 (b) and β-arrestin2 (c) recruitment after Galr2 activation with 1 μM of three different agonists. Dose–response curves for recruitment of β-arrestin1 (d), and β-arrestin2 (e). Luminescence signal intensity obtained at 5 min after agonist stimulation was measured. The data were normalized to the maximal response induced by Galanin and were fit using a three-parameter model of agonism (Eq. 1). The results are expressed as mean ± s.e.m. of three experiments performed in triplicate; each triplicate was averaged before calculating the s.e.m. The arrows indicate the time at which the cells were treated with the different ligands
Fig. 3
Fig. 3
Differential β-arrestin2–clathrin interactions induced by endogenous ligands. a Schematic representation of the experimental design used to monitor agonist-promoted luminescence after Galr2 stimulation. b Time course and dose–response of β-arrestin2–clathrin interactions by 10 μM Galanin, Spexin, and Fmoc-dA4-dQ14 in the presence or absence of 30 μM of Cmpd101, a GRK2/3 inhibitor. The arrows indicate the time when the cells were treated with different ligands. For dose–response curve, the data obtained at 5 min after agonist stimulation were normalized to the maximal response induced by Galanin. The results are expressed as mean ± s.e.m. of three experiments performed in triplicate. Each triplicate was averaged before calculating the s.e.m.
Fig. 4
Fig. 4
Internalization of Galr2. a Schematic representation of the internalization assay. Only the SmBiT-High-affinity:Galr2 remained in the cell surface after ligand stimulation can bind to LgBit to produce the luminescent signal. b HEK293 cells transiently transfected with 0.5 ng/well of Galr2 containing the SmBiT-High-affinity tag at the N termini. Before ligand stimulation, cells were pretreated with 30 μM Cmpd101 (a GRK2/3 inhibitor) for 30 min, 25 μM PitStop 2 (a Clathrin inhibitor) for 15 min, and 80 μM Dynasore (a Dynamin inhibitor) for 40 min. Cells were then treated with different concentrations of Galanin, Spexin, and Fmoc-dA4-dQ14 for 30 min. Remaining cell surface receptors were determined by measuring the luminescent signal produced by the binding between LgBiT and the Galr2-SmBiT-High affinity. Each data point represents mean ± s. e. m. of two independent experiments performed in triplicate
Fig. 5
Fig. 5
Galr2 agonists display different Gαq-protein-dependent signaling and pErk1/2. The ability of increasing concentrations of agonists to induce a SRE-Luc activity and b total inositol phosphate production. c Representative western blot showing ligand-induced phosphorylation of Erk1/2 from wild-type (HEK293 WT), Gαq/11-, and β-arrestin1/2-knockout HEK293 cells expressing Galr2 (original blots are presented in Supplementary Figure 4). pErk1/2 and total Erk levels were determined at 5 min after stimulation of different concentrations of three ligands. Western blot band intensities corresponding to each concentration were quantified using Image studio TM Software. The data shown in the dose–response curve were normalized to the maximal response induced by Galanin and were fit using a three-parameter model (Eq. 1). Data are the mean ± s.e.m. values of two independent experiments
Fig. 6
Fig. 6
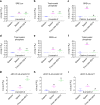
Biased factors across different β-arrestins and G-protein signaling pathways at Galr2. The dose–response curves for G-protein- and β-arrestin-dependent signaling were analyzed using an operational model of agonism (Eq. 2) to obtain transduction coefficients (Log(τ/KA)). These coefficients were normalized to the corresponding value obtained for the reference agonist Galanin (ΔLog(τ/KA)). The normalized values obtained for one agonist at two different pathways were subtracted to obtain bias factor values (ΔΔLog(τ/KA). These bias factor values for different agonists a SRE-Luc activity and β-arrestin2 recruitment, b total inositol phosphate production and β-arrestin2 recruitment, c SRE-Luc activity and Galr2 internalization, d total inositol phosphate and β-arrestin1 recruitment, e SRE-Luc activity and β-arrestin1 recruitment, f total inositol phosphate production and β-arrestin2:clathrin interaction, g pErk1/2-Δβ-arrestin1/2 and β-arrestin2, h pErk1/2-Δβ-arrestin1/2 and β-arrestin1, and i pErk1/2-ΔGαq/11 and β-arrestin1 in reference to Galanin are represented in the graphs. The results are expressed as the mean ± s.e.m. values of three independent experiments. *P < 0.05; **P < 0.005 statistically significant differences versus Galanin as determined by a one-way analysis of variance (ANOVA). #Means not determined. a P = 0.0083, b P = 0.0023, c P = 0.0023, d P = 0.0043, e P = 0.0002, f P < 0.0001, g P < .0.0001, h P < 0.0001, i P = 0.0081
Fig. 7
Fig. 7
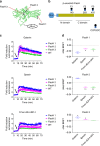
Design of Nluc–β-arrestin2–FlasH BRET conformational biosensors and β-arrestin2 conformational hallmarks imposed by different conformations of Galr2. a, b Three Nluc–β-arrestin2–FlasH BRET conformational biosensors were constructed by inserting the amino acid motif CCPGCC after amino acid residues 140, 263, and 410 of human β-arrestin2; the location of each motif is shown in relation to the globular N and C domains of β-arrestin2. c Functionality assay based on NanoBit technology demonstrating ligand-dependent recruitment of β-arrestin2-FlasH1-3 to human Galr2. The arrows indicate the time for treatment with the corresponding agonist. d Nluc–β-arrestin2–FlasH1-3 “conformational hallmarks” of β-arrestin2 by binding to Galr2. The bar graphs depict mean ± s.e.m. values of independent biological replicates (n = 3). *P < 0.05, **P < 0.005, statistically significant differences versus Galanin-stimulated control as determined by a one-way analysis of variance (ANOVA). PFlasH1 = 0.0284, PFlasH2 = 0.0039, PFlasH3 = 0.0357
Fig. 8
Fig. 8
Reversal assay approach used to estimate agonist-receptor dissociation rate. a Schematic representation describing that the recruitment of β-arrestin2 to Galr2 is dependent on ligand–receptor dissociation after ligand removal. b Cells were incubated with 10 μM agonist to permit a stable β-arrestin2 response. Ligand removal was performed by simply changing the medium containing no ligand and then immediately continue measuring luminescence. Samples with no ligand removal were used as a control. In Spexin- and Fmoc-dA-dQ14-treated cells, ligand removal caused a rapid decrease in luminescence signal back to basal levels. In Galanin-treated cells, decrease in luminescence signal after ligand removal was not such rapid. The results are expressed as the mean ± s.e.m. values of two independent experiments

Similar articles

Cited by

References

    1. Pierce KL, Premont RT, Lefkowitz RJ. Seven-transmembrane receptors. Nat. Rev. Mol. Cell Biol. 2007;9:639–650. - PubMed
    1. Violin JD, Lefkowitz RJ. B-arrestin-biased ligands at seven-transmembrane receptors. Trends Pharmacol. Sci. 2007;28:416–422. doi: 10.1016/j.tips.2007.06.006. - DOI - PubMed
    1. Raehal KM, Walker JK, Bohn LM. Morphine side effects in beta-arrestin 2 knockout mice. J. Pharmacol. Exp. Ther. 2005;314:1195–1201. doi: 10.1124/jpet.105.087254. - DOI - PubMed
    1. Herenbrink CK, et al. The role of kinetic context in apparent biased agonism at GPCRs. Nat. Commun. 2016;7:10842. doi: 10.1038/ncomms10842. - DOI - PMC - PubMed
    1. Saulière A, et al. Deciphering biased-agonism complexity reveals a new active AT1 receptor entity. Nat. Chem. Biol. 2012;8:622–630. doi: 10.1038/nchembio.961. - DOI - PubMed