. 2018 Sep 6:1:136.
doi: 10.1038/s42003-018-0139-y. eCollection 2018.

Streamlining volumetric multi-channel image cytometry using hue-saturation-brightness-based surface creation

Affiliations

Streamlining volumetric multi-channel image cytometry using hue-saturation-brightness-based surface creation

Yingrou Tan et al. Commun Biol. .

Abstract

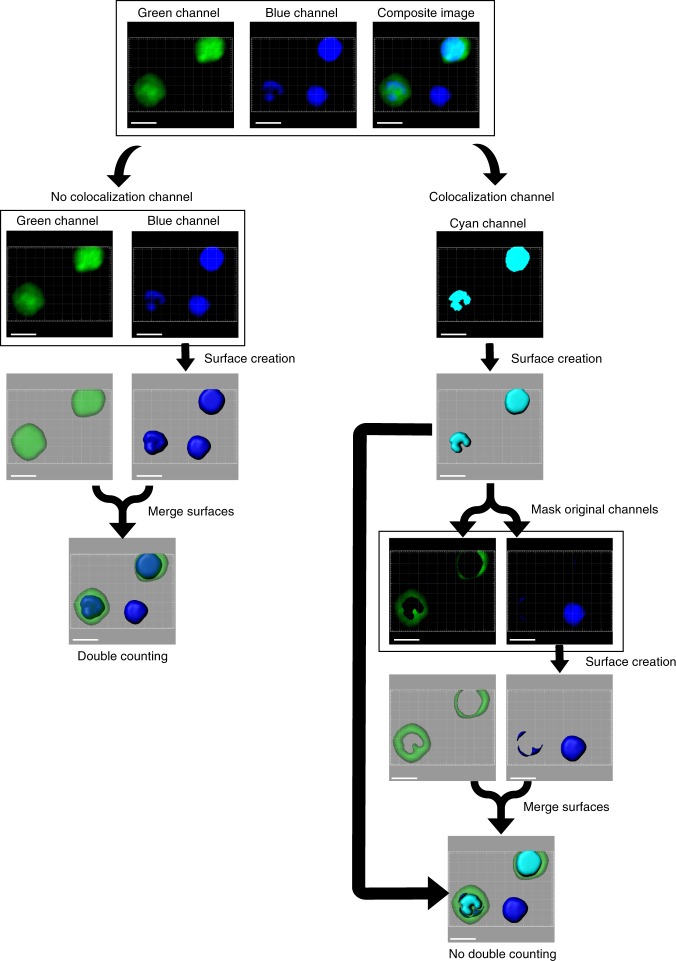
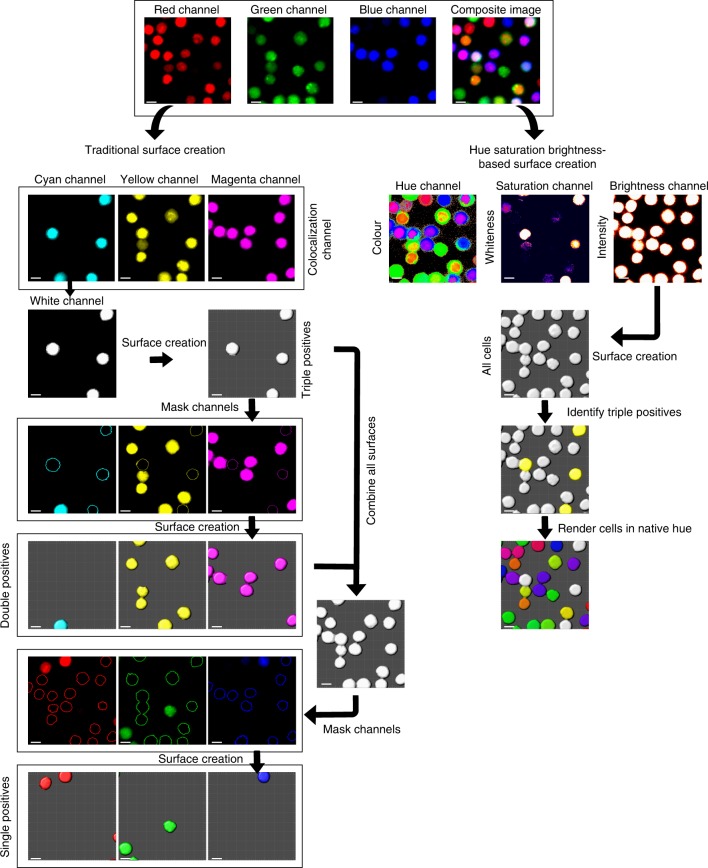
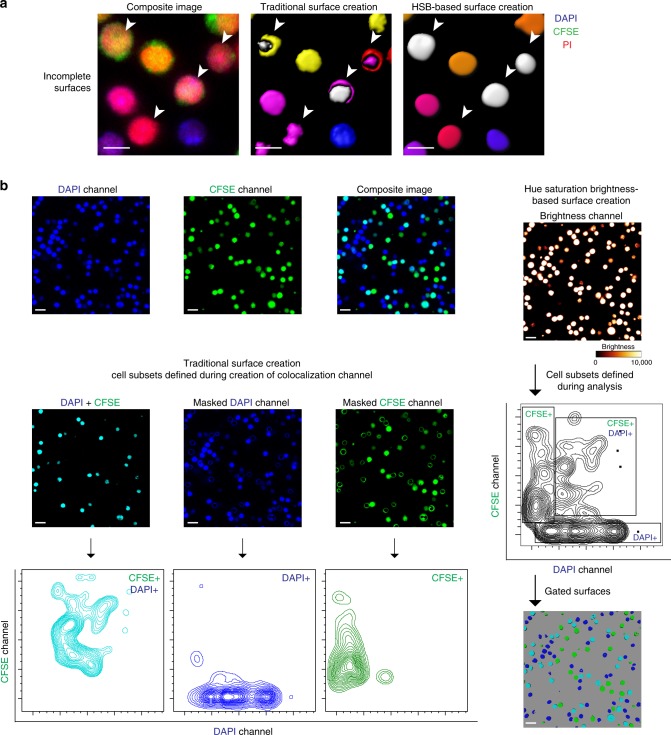
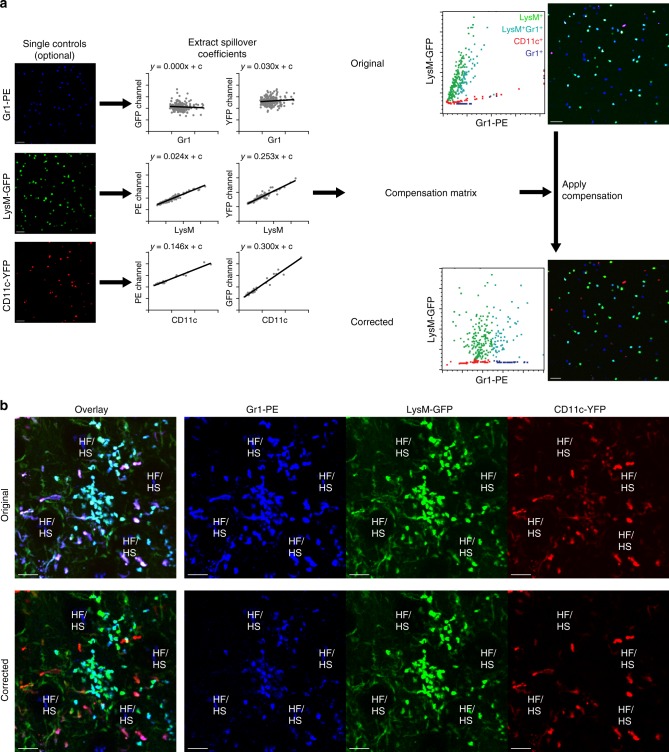
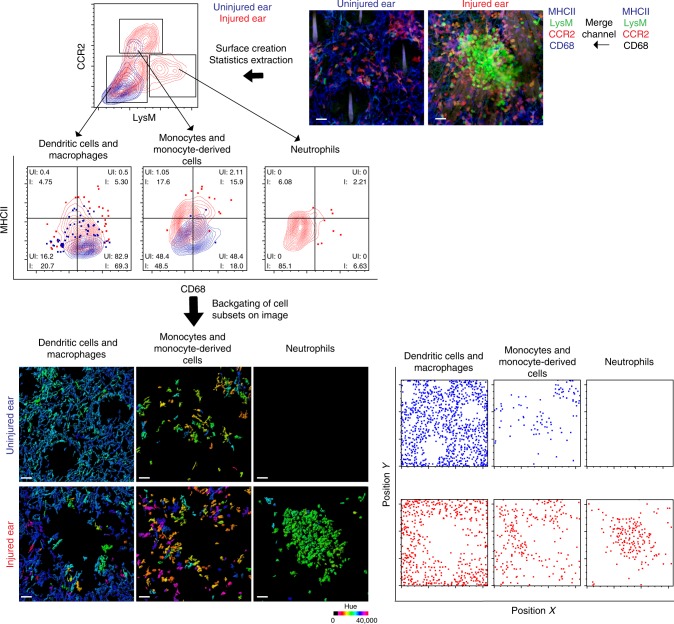
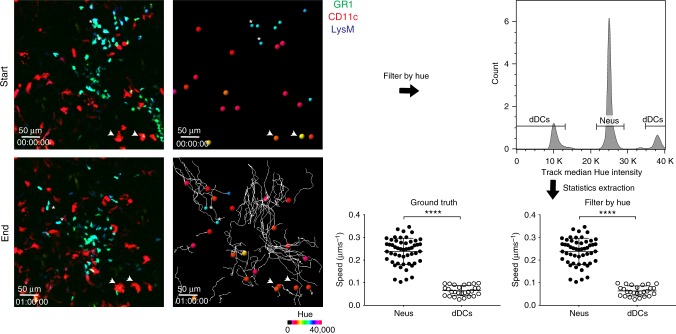
Image cytometry is the process of converting image data to flow cytometry-style plots, and it usually requires computer-aided surface creation to extract out statistics for cells or structures. One way of dealing with structures stained with multiple markers in three-dimensional images, is carrying out multiple rounds of channel co-localization and image masking before surface creation, which is cumbersome and laborious. We propose the application of the hue-saturation-brightness color space to streamline this process, which produces complete surfaces, and allows the user to have a global view of the data before flexibly defining cell subsets. Spectral compensation can also be performed after surface creation to accurately resolve different signals. We demonstrate the utility of this workflow in static and dynamic imaging datasets of a needlestick injury on the mouse ear, and we believe this scalable and intuitive approach will improve the ease of performing histocytometry on biological samples.


Conflict of interest statement

The authors declare no competing interests.

Figures

Fig. 1
Fig. 1
Illustration of masking using the co-localization channel. Surface creation using individual channels for a two-color image consisting of green and blue channels results in two surfaces being created for each double-positive cyan cell as it exists in both channels, thus the wrong number of surfaces are created. In order to achieve the right number of surfaces, a co-localization channel for double-positive cyan cells is built. The channel is then used to create three-dimensional surfaces, which is applied to the individual green and blue channels to remove the signal belonging to the cyan cell. This leads to the isolation of only single-positive cells in the masked channels. However, partial surfaces may be generated due to incomplete co-localization. Scale bar, 5 µm
Fig. 2
Fig. 2
Comparison of traditional surface creation with hue-saturation-brightness surface creation. Traditional surface creation: For a three color image acquired in the red, green, and channels, it is necessary to first identify the different possible combinations of triple positive and double-positive cells using the co-localization channel for each combination. Cell surfaces of the triple and double-positive cells are created using image analysis software, surfaces are merged and used to mask the relevant cells in the original red, green, and blue channels to generate single-positive cells. Each of the individual channels is then used for surface creation and statistics extraction. Hue-saturation brightness surface creation: Hue, saturation, and brightness channels will be generated from the original image using the HSB algorithm. Any cell that expresses a marker will be captured in the brightness channel, thus making it possible to generate cell surfaces for all the cells in one channel. Triple positive cells can be identified using the saturation channel, and information from the hue channel can then be used to render the surfaces in their native hue. Scale bar, 5 µm
Fig. 3
Fig. 3
Surface quality and surface identity differs using traditional surface creation and HSB surface creation workflows. a Incomplete surfaces are generated with traditional surface creation, while the HSB surface creation workflow generates complete surfaces. Splenocytes stained with different combinations of DAPI, CFSE, and propidium iodide were mixed and imaged. The composite image of all three channels was compared with surfaces generated using the traditional surface creation and the HSB surface creation workflow. Surfaces from traditional surface creation are rendered as a composite of the different subsets, while surfaces from the HSB surface creation workflow are rendered in the median hue with triple-positive cells colored as white. Traditional surface creation results in a cell with surfaces belonging to two different subsets as the three markers do not fully overlap, while HSB surface creation results in a complete surface. Scale bar, 10 µm. b Cell subsets are defined early in the traditional surface creation workflow, but are only defined during the analysis step using the HSB surface creation workflow. Splenocytes stained with different combinations of DAPI and CFSE were mixed and imaged. Using the traditional surface creation workflow, the DAPI+ CFSE+ cell subset is defined during the creation of the co-localization channel. The co-localization channel is used to mask the original DAPI and CSFE channels, thus defining the single-positive DAPI+ and CSFE+ subsets. Using the HSB surface creation workflow, surfaces of any cell is created in a one step process, allowing for cell subsets to be defined during analysis in flow cytometry plots. Scale bar, 20 µm. Abbreviations: DAPI 4’,6-Diamidino-2-Phenylindole Dihydrochloride, CFSE carboxyfluorescein succinimidyl ester
Fig. 4
Fig. 4
Spectral compensation using the HSB surface creation workflow. a Spectral compensation process. Spillover coefficients are extracted from the single stain controls and entered into a compensation matrix. Single stain controls may not be required if single-positive cells are available in the image. Values from the matrix can then be applied to the histocytometry plots as well as the original image to generate a corrected image. b Spectral compensation applied to the individual channels of a snapshot of an injured transgenic LysM GFP—CD11c YFP mouse ear injected with GR1-PE. Abbreviations: LysM GFP Lysozyme M green fluorescent protein, CD11c YFP CD11c yellow fluorescent protein, GR1-PE anti-granulocyte receptor-1 tagged with phycoerythrin, HF/HS hair follicle/hair shaft. Scale bar, 50 µm
Fig. 5
Fig. 5
Application of HSB surface creation to whole-mount immunostaining. Application of the HSB surface creation workflow to a whole-mount immunostaining of a LysM GFP-CCR2 RFP mouse ear 180 min after injury with a needle stick. Mouse ear was immunostained with MHCII and CD68. The MHCII and CD68 channels were merged, followed by processing with the HSB surface creation workflow for surface creation and statistics extraction. Statistics from the cell surfaces were then exported to FlowJo for population gating. Gates for MHCII and CD68 were defined using the neutrophil population, and numbers in each quadrant represent the percentage of the total cell population existing in the respective quadrant. Cell subsets were then backgated onto the surfaces and rendered in their native hue. The relative X and Y positions of each subset are also demonstrated. Results are representative of two mice. Abbreviations: LysM GFP Lysozyme M green fluorescent protein, CCR2 RFP C-C chemokine receptor type 2 red fluorescent protein, MHCII major histocompatibility complex class II, UI uninjured, I injured. Scale bar, 30 µm
Fig. 6
Fig. 6
Application of HSB surface creation workflow to dynamic imaging. Application of HSB surface creation workflow to a dynamic image of a LysMGFP-CD11cYFP mouse injected with anti-GR1 antibody. The ear was injured with a needle stick, and LysM+ GR1+ neutrophils (asterisk) and CD11c+ or CD11c+ LysM+ dendritic cells (arrowhead) recruited to the injured region 30 min after the injury are tracked. Spots are rendered in the median hue of the cell. Tracks of the neutrophils and dendritic cells were gated based on the track median hue intensity, and the velocities of the different cell subsets plotted and compared to ground truth. Results are representative of two mice; ****p < 0.0001 using the two-tailed unpaired t-test. Difference in cell speed for ground truth dataset, p = 2.72 × 10−24, 95% confidence interval = 0.15–0.1965 µm s−1; difference in cell speed for test dataset, p = 6.14 × 10−24, 95% CI = 0.1509–0.1981 µm s−1. Abbreviations: LysM GFP Lysozyme M green fluorescent protein, CD11c YFP CD11c yellow fluorescent protein, GR-1 granulocyte receptor-1

Similar articles

Cited by

References

    1. Ecker RC, Steiner GE. Microscopy-based multicolor tissue cytometry at the single-cell level. Cytom. A. 2004;59:182–190. doi: 10.1002/cyto.a.20052. - DOI - PubMed
    1. Walter T, et al. Visualization of image data from cells to organisms. Nat. Methods. 2010;7:S26–S41. doi: 10.1038/nmeth.1431. - DOI - PMC - PubMed
    1. Carpenter AE, et al. CellProfiler: image analysis software for identifying and quantifying cell phenotypes. Genome Biol. 2006;7:R100. doi: 10.1186/gb-2006-7-10-r100. - DOI - PMC - PubMed
    1. Boland MV, Markey MK, Murphy RF. Automated recognition of patterns characteristic of subcellular structures in fluorescence microscopy images. Cytometry. 1998;33:366–375. doi: 10.1002/(SICI)1097-0320(19981101)33:3<366::AID-CYTO12>3.0.CO;2-R. - DOI - PubMed
    1. Gerner MY, Kastenmuller W, Ifrim I, Kabat J, Germain RN. Histo-cytometry: a method for highly multiplex quantitative tissue imaging analysis applied to dendritic cell subset microanatomy in lymph nodes. Immunity. 2012;37:364–376. doi: 10.1016/j.immuni.2012.07.011. - DOI - PMC - PubMed