. 2018 Sep 21:1:148.
doi: 10.1038/s42003-018-0151-2. eCollection 2018.

Coordination between binocular field and spontaneous self-motion specifies the efficiency of planarians' photo-response orientation behavior

Affiliations

Coordination between binocular field and spontaneous self-motion specifies the efficiency of planarians' photo-response orientation behavior

Yoshitaro Akiyama et al. Commun Biol. .

Abstract

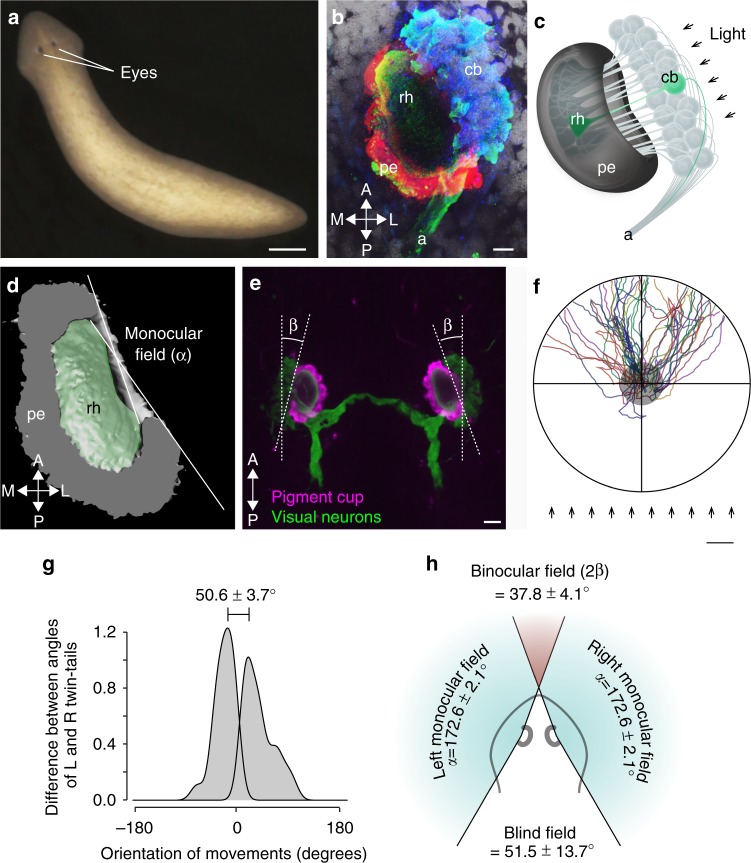
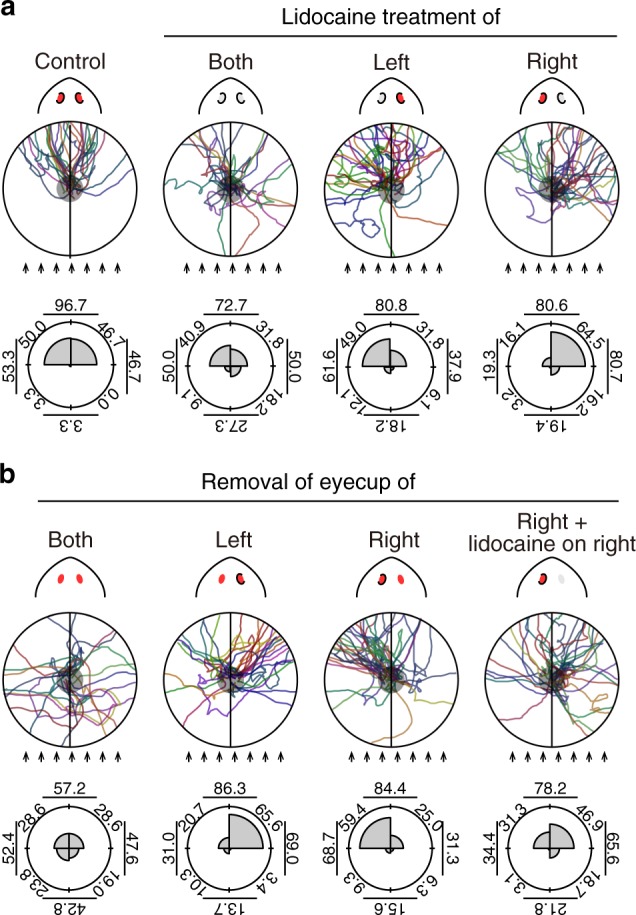
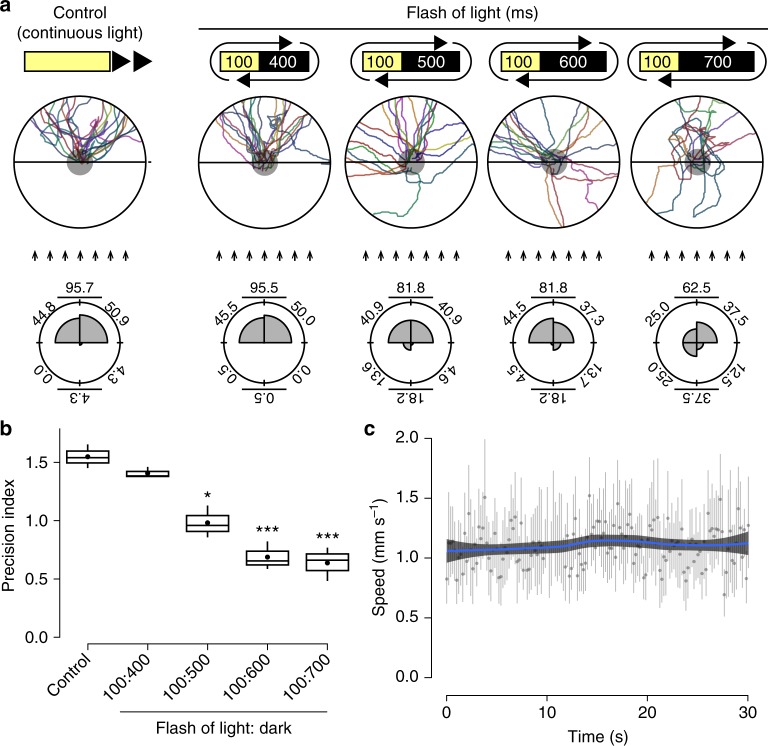
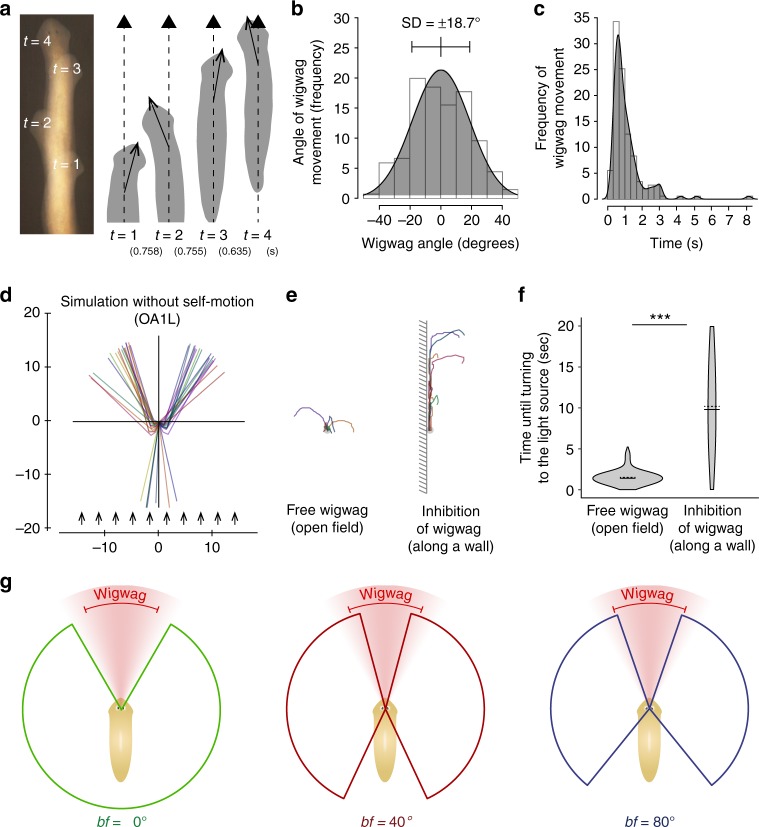
Eyes show remarkable diversity in morphology among creatures. However, little is known about how morphological traits of eyes affect behaviors. Here, we investigate the mechanisms responsible for the establishment of efficient photo-response orientation behavior using the planarian Dugesia japonica as a model. Our behavioral assays reveal the functional angle of the visual field and show that the binocular field formed by paired eyes in D. japonica has an impact on the accurate recognition of the direction of a light source. Furthermore, we find that the binocular field in coordination with spontaneous wigwag self-motion of the head specifies the efficiency of photo-responsive evasive behavior in planarians. Our findings suggest that the linkage between the architecture of the sensory organs and spontaneous self-motion is a platform that serves for efficient and adaptive outcomes of planarian and potentially other animal behaviors.


Conflict of interest statement

The authors declare no competing interests.

Figures

Fig. 1
Fig. 1
Eye morphology and photo-response orientation behavior of the planarian D. japonica. a Live D. japonica. Scale bar, 500 µm. b Magnified view of a right eye in D. japonica. Blue, cell bodies of visual neurons (cb) visualized by in situ hybridization with opsin gene probe; green, axons and rhabdomeres (rh) visualized by immunostaining using anti-arrestin antibody; red, pigment eyecup cells (pe) visualized by immunostaining using anti-TPH antibody; white, nuclei visualized by staining with Hoechst. A, anterior; P, posterior; M, medial; L, lateral. Scale bar, 10 µm. c Schematic drawing of architecture of planarian eye indicated in b. d Ventral semiellipsoid of a 3D reconstruction of the right eye based on confocal microscopic sections with the indication of a monocular field. D. japonica has a visual field of 172.6 ± 2.1° in one eye. n = 6. e The eyes of D. japonica are oblique (with an angle ≈ β). The angle of the obliqueness is approximately 20° (β = 19.4 ± 2.0°) on average. n = 28. Scale bar, 25 µm. f Distribution of traced trajectories of movements in the orientation assay with one light source (OA1L). Each colored line indicates the trajectory of an individual. The center of the assay field indicated by a gray circle shows the start area. Arrows indicate rays of light. Although animals show evasive movement away from the light source, a plot of this movement for a large number of animals shows a wide fan-shape composite plot. The 300 lux in the assay field was used. Scale bar, 1 cm. g Distribution of the difference between angles of trajectories toward the left and toward the right shown by a density plot. The difference was 50.6 ± 3.7° wide. n = 41. h Schematic drawing of planarian visual field. Binocular field on the anterior side of planarian Dugesia japonica is approximately 40° (2β = 37.4 ± 4.1°), Blind field on the posterior side is approximately 50°, and the planarian visual field in one eye is greater than 170°
Fig. 2
Fig. 2
Planarian recognizes the light direction by comparing the difference of the input from the two eyes. a Trajectories of lidocaine-treated planarians. The control group was treated with anesthesia just below the right eye. The trajectories of the group administered lidocaine to both eyes were perturbed (Both), indicating that the lidocaine treatment efficiently inhibits the activity of visual neurons. Trajectories of the group administered lidocaine to the left eye was biased toward the left (Left), while that of the group administered lidocaine to the right eye was biased toward the right (Right). Rose plots in the lower panels show the histogram of the orientation (angle) distribution of movement of lidocaine-treated planarians, determined as the average for individuals used for this assay. The angle of the direction of each individual was calculated and the data were binned into 90° intervals. The percentage of oriented movements in the range of four every 90° interval, half angle against the light source, half angle toward the light source, the half angle on the right side, and half angle on the left side are shown in each plot. b Trajectories of eyecup-removed planarians. The trajectories of the group with the removal of both eyecups (Both) were strongly perturbed and more random than those of the control. The trajectory of the left eyecup-removed group was significantly biased in the right direction (Left), while that of the right eyecup-removed group was significantly biased in the left direction (Right). Furthermore, this biased behavior was rescued when lidocaine anesthesia was applied to the right eye (Right + lidocaine), indicating that the operated visual neurons functioned properly. Rose plots in the lower panels show the histogram of the orientation (angle) distribution of movement of eyecup-removed planarians, determined as the average for individuals used for this assay. p Values were less than 0.005 in the lidocaine-treated and eyecup-removed planarian groups, but not in the right eyecup-removed and lidocaine-treated group, relative to the control. Arrows indicate rays of light. n = 22–32
Fig. 3
Fig. 3
Integration of input signals in the brain for the induction of body responses. a Scatter plot of turn angles caused by incident light from different directions. 0° corresponds to anterior end, and ±180° corresponds to posterior end, respectively. All points are classified into two colors (black or red) at the dividing line of 130°. The coefficient of determination indicated by the blue solid line calculated from all dots (red and black) showed low correlation (r2 = 0.25). The coefficient of determination indicated by the red solid line calculated from the red dots showed a significant correlation (r2 = 0.56) that corresponded to a light angle of ±130° when the difference in the signal input value between the L and R eyes exceeded the response threshold to induce precise turning (vertical black solid line at 130°). b Input value to the left and right eyes (top) and subtractive difference in the left and right eyes (bottom) with a change in the light direction. The response threshold calculated using the subtractive formula |L(θt) − R(θt)| corresponding to the light angle of ±130° is 0.5 (red shaded) between the light input received by the two eyes. Maximum input is assumed to be 1.0. c The trajectories of control (GFP-dsRNA injected), syt(RNAi), chat(RNAi), snap25(RNAi), gad(RNAi), tbh(RNAi), and th(RNAi) planarians and their histograms of the orientation (angle) distribution indicated by rose plots. Percentage of oriented movements in the range of four for every 90° interval on the rose plots. d Fluorescence immunohistochemistry of GAD proteins combined with fluorescence in situ hybridization of syt, snap25, chat, tbh, th genes. Percentages (mean ± SEM) of GAD-positive neurons co-expressing neurotransmitter-related genes are shown in the lower left corners. Scale bars, 50 µm. Inset scale bars, 5 µm. e Expression patterns of the planarian gad, GABAA-RBa, and GABAB-Ra genes in the eyes. Arrows indicate visual neurons expressing GABAA-RBa. Asterisks indicate pigment eyecups. Scale bar, 20 µm. f The trajectories of control (GFP-dsRNA injected), GABAA-RBa(RNAi), and GABAB-Ra(RNAi) planarians and their histograms of the orientation (angle) distribution indicated by rose plots. Arrows indicate rays of light
Fig. 4
Fig. 4
Time resolution of light exposure required for photo-response orientation behavior. a Distribution of traced trajectories of movements in OA1L using 100-ms flashes of light with several different intervals between flashes. Control, continuous light exposure from one direction. “100:400”: 100-ms light exposure and 400-ms dark interval; “100:500”: 100-ms light exposure and 500-ms dark interval; “100:600”: 100-ms light exposure and 600-ms dark interval; “100:700”: 100-ms light exposure and 700-ms dark interval. Arrows indicate rays of light. As the dark interval increased from 400 to 700 ms, the trajectories of movement became wider and more randomly oriented. n = 22. Rose plots in the bottom panels show the histogram of the orientation (angle) distribution in the range of 90° intervals of movement during the assay for several values of the interval between flashes. Percentage of oriented movements in the range of four per every 90° interval, half angle against the light source, and half angle toward the light source are shown on each plot. The movements of control planarians exposed continuously to light from a particular direction, and of planarians exposed to flashes of light with long dark intervals, showed no particular orientation. (b) Precision index of the orientation of movements. Precision indexes are expressed as the inverse of the circular standard deviation of the orientation of trajectories. n = 22. *p < 0.05, ***p < 0.005. c Planarian speed during movement. Gray graphs show the mean speed and standard deviation of speed at each time point, and blue lines show the polynomial trend line. D. japonica recognizes the light direction within a period of less than 500 ms or within a distance of less than 500 µm
Fig. 5
Fig. 5
A binocular field of 40° is optimally tuned to achieve maximal efficiency of photo-response orientation behavior. a Subtractive difference of inputs from the two eyes with a change in the light direction and binocular field parameters (bf) of 0° (green), 40° (red), and 80° (blue) (upper panel). The value of the response threshold caused an angle that could not be distinguished from the light direction on the anterior side (front blind-like spot), and the angle of front blind-like spot differed depending on the angle of the binocular field. Filled colored areas of the graph indicate the angle greater than the response threshold. Lower panel shows higher magnification of the front blind-like spot. Double-headed arrows indicate the angle of the front blind-like spot for different angles of binocular field of 0°, 40°, and 80°. b Simulated trajectories of photo-response orientation behavior in planarians with bf of 0°, 40°, and 80°. n = 60. Arrows indicate rays of light. c The “escape value” was defined as the relative distance from the start line from which ideal planarians showed an escape value of 1, moving straight away from a light source. d The simulated escape value was plotted versus different angles of the binocular field. The actual angle of the binocular field of D. japonica is shown by a dashed line. n = 1000. (e) Head and eyes of S. mediterranea visualized by immunohistochemistry of TPH (magenta) and arrestin (green). Scale bars, 100 µm. f Violin plot showing the comparison of the angle of the binocular field between D. japonica and S. mediterranea. n = 21. g Actual trajectories of S. mediterranea in OA1L showing broader twin-tailed trajectories. Arrows indicate rays of light. n = 16. Scale bar: 1 cm. h Difference in the twin-tail angles of D. japonica and S. mediterranea. i Escape values of actual trajectories of D. japonica and S. mediterranea. Horizontal solid lines indicate median value, and horizontal dashed lines indicate average value in violin plots in fh, and i, respectively. ***p < 0.005
Fig. 6
Fig. 6
Wigwag spontaneous self-motion acts as symmetry breaking of the inputs from the two eyes. a Planarians show wigwag self-motion of the head even when they are moving straight ahead. Overlapped images of a time-lapse movie of movement (left). Traced drawings of wigwag self-motions of the head shown in the left panel (right). Numbers in parentheses in the bottom indicate the time between two wigwag self-motions. b The distribution of the wigwag angle fit follows a normal distribution with mean: 0, SD = 18.7°. n = 25 (143 turns). c The frequency of wigwag self-motions during movement follows a log-normal distribution with a log-mean of −0.15 s and log-standard deviation of 0.44. d Simulated trajectories without the wigwag parameter. n = 40. The simulation showed that some individuals go toward the light because the difference in the input signal between the two eyes may become as small when light comes from the anterior direction as when it comes from the posterior direction. Arrows, light source. e Turning assay using light irradiated from the anterior end in the open field and in the field partially obstructing wigwag self-motions along the wall. f Violin plot showing the time from the illumination by light source until movement in the opposite direction. Horizontal solid lines indicate median value, and horizontal dashed lines indicate average value in violin plots. n = 6–8. ***p < 0.005. g Schematic drawings of the relationship between the visual field and spontaneous self-motion. Colored sectors show the angles for which planarians can recognize the asymmetry between left and right inputs when the light comes from them (greater than the response threshold). Depending on the angle of the binocular field, planarians had a posterior blind field at different angles and a front blind-like spot at different angles, respectively. Sectors of red color gradation indicate the probability density distribution of the angles of wigwag motion, and red brackets indicate the standard deviation of the wigwag angle (±18.7°, total 37.4°)

Similar articles

Cited by

References

    1. Kobayashi H, Kohshima S. Unique morphology of the human eye. Nature. 1997;387:767–768. doi: 10.1038/42842. - DOI - PubMed
    1. Land Michael F., Nilsson Dan-Eric. Animal Eyes. 2012. Lens eyes on land; pp. 94–129.
    1. Hays GC. A review of the adaptive significance and ecosystem consequences of zooplankton diel vertical migrations. Hydrobiologia. 2003;503:163–170. doi: 10.1023/B:HYDR.0000008476.23617.b0. - DOI
    1. Pearre S. Eat and run? The hunger/satiation hypothesis in vertical migration: history, evidence and consequences. Biol. Rev. Camb. Philos. Soc. 2003;78:1–79. doi: 10.1017/S146479310200595X. - DOI - PubMed
    1. Togashi T, Cox PA. Phototaxis and the evolution of isogamy and “slight anisogamy” in marine green algae: insights from laboratory observations and numerical experiments. Bot. J. Linn. Soc. 2004;144:321–327. doi: 10.1111/j.1095-8339.2003.00255.x. - DOI