. 2018 Oct 1:10.1038/nbt.4262.
doi: 10.1038/nbt.4262. Online ahead of print.

On-demand manufacturing of clinical-quality biopharmaceuticals

Affiliations

On-demand manufacturing of clinical-quality biopharmaceuticals

Laura E Crowell et al. Nat Biotechnol. .

Abstract

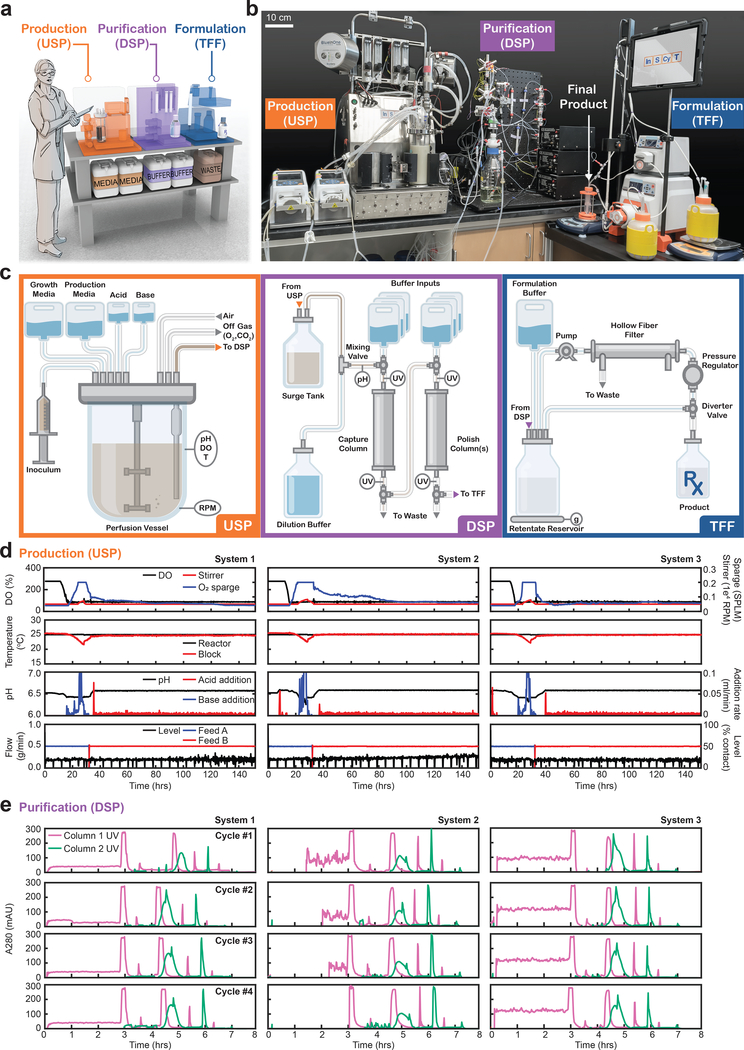
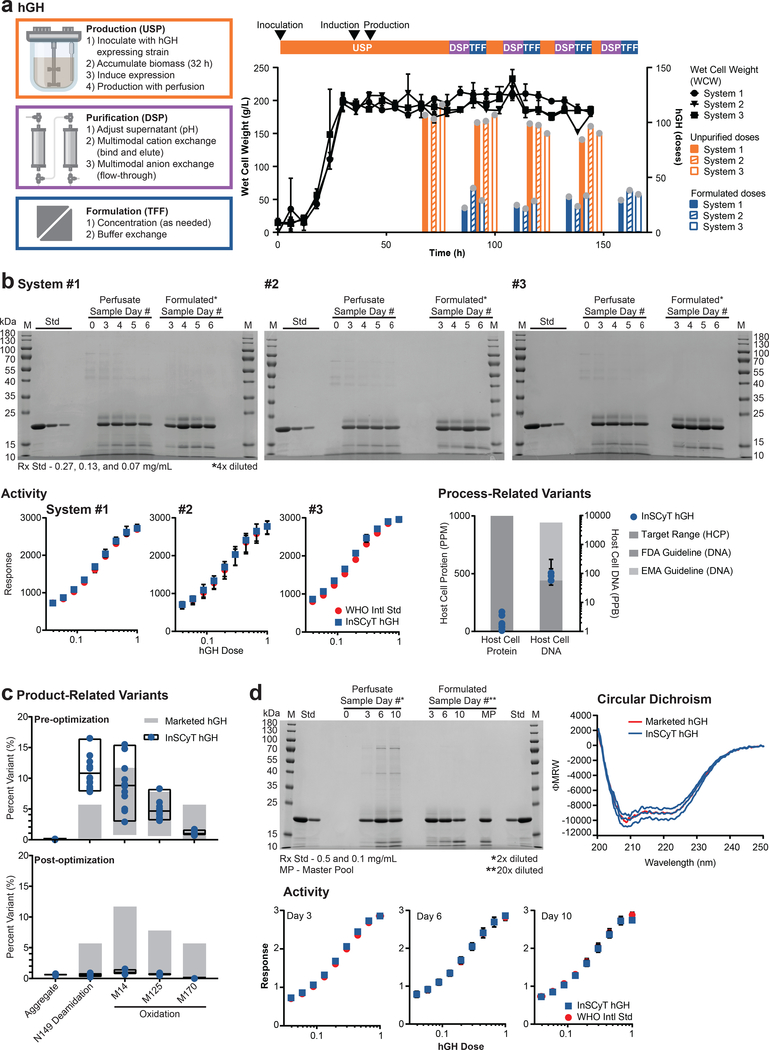
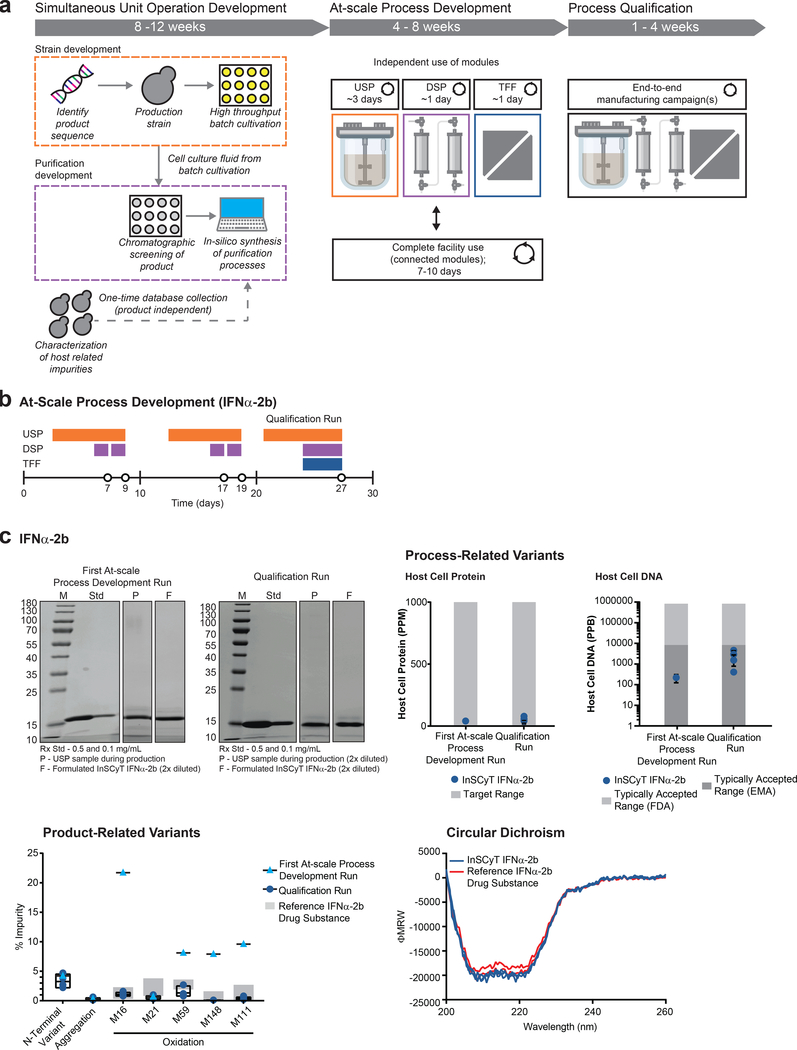
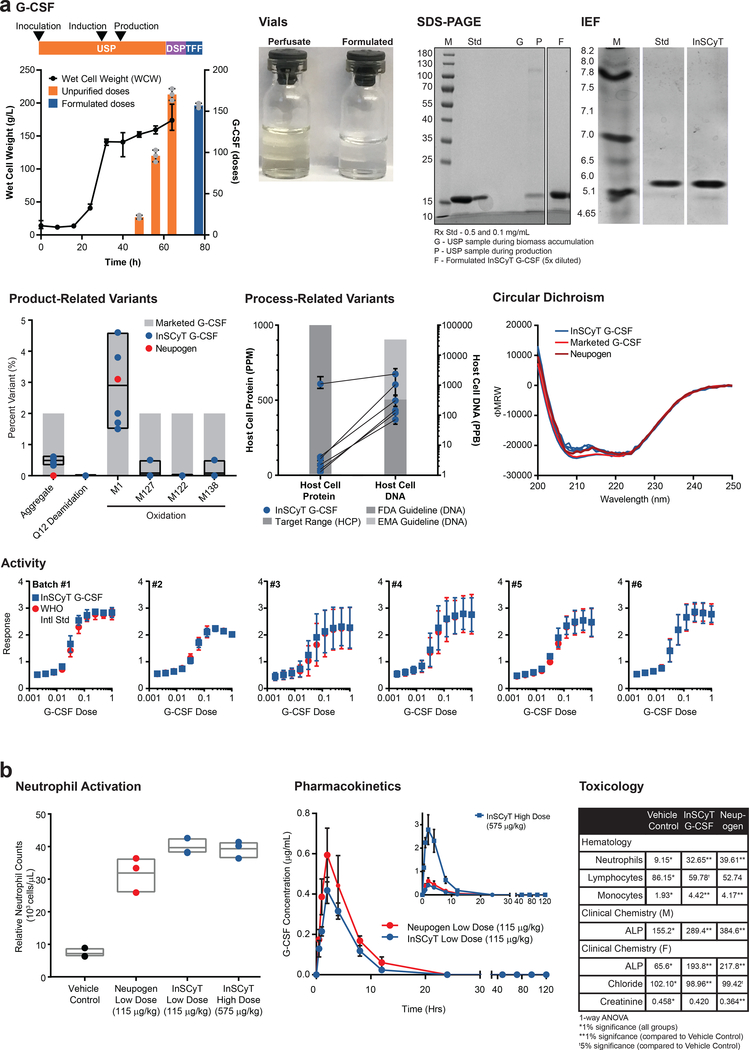
Conventional manufacturing of protein biopharmaceuticals in centralized, large-scale, single-product facilities is not well-suited to the agile production of drugs for small patient populations or individuals. Previous solutions for small-scale manufacturing are limited in both process reproducibility and product quality, owing to their complicated means of protein expression and purification. We describe an automated, benchtop, multiproduct manufacturing system, called Integrated Scalable Cyto-Technology (InSCyT), for the end-to-end production of hundreds to thousands of doses of clinical-quality protein biologics in about 3 d. Unlike previous systems, InSCyT includes fully integrated modules for sustained production, efficient purification without the use of affinity tags, and formulation to a final dosage form of recombinant biopharmaceuticals. We demonstrate that InSCyT can accelerate process development from sequence to purified drug in 12 weeks. We used integrated design to produce human growth hormone, interferon α-2b and granulocyte colony-stimulating factor with highly similar processes on this system and show that their purity and potency are comparable to those of marketed reference products.


Conflict of interest statement

Competing Financial Interests

The authors have filed patents related to this work.

Figures

Figure 1
Figure 1
Schematic of the InSCyT system for on-demand biomanufacturing and demonstration of consistent operation across three distinct InSCyT systems. (a) To-scale rendering of the InSCyT system. Human figure is approximately 5’7”. (b) Photograph of an operational InSCyT system. (c) Detailed schematic of the InSCyT system including interactions between modules and key control points for the production (upstream processing, USP), purification (downstream processing, DSP) and formulation (tangential flow filtration, TFF) modules. Process parameter profiles collected by the control software from (d) the production (USP) module and (e) the purification (DSP) module of three separate InSCyT systems during hGH fermentation.
Figure 2
Figure 2
Production of hGH on the InSCyT system. Dose size used was 1.75 mg. Center values and error bars represent the mean and range, respectively, of technical triplicates unless otherwise indicated. (a) Process flow chart (left), timeline and yields (right) for production of hGH using InSCyT. Wet cell weight (WCW) (black), unpurified (orange) and formulated (blue) doses of hGH produced are shown. Grey circles represent individual data points. (b) Product quality analyses for InSCyT-produced hGH pre-optimization alongside a reference drug substance from a licensed hGH product produced in E. coli. SDS-PAGE (12% tris-glycine) analysis of samples from the USP during biomass accumulation and production (perfusate samples), final, formulated samples (formulated samples) and the reference (Std). Activity of InSCyT hGH alongside the WHO international standard (NIBSC 98/574). The final formulated sample (day 6) was analyzed from each system. Quantification of host-cell protein and host-cell DNA impurities in formulated InSCyT hGH. Host-cell protein limits are shown as a target range,. Host-cell DNA guidelines are based on 100 pg/dose (FDA) and 10 ng/dose (EMA),. For host-cell protein data, each point represents a unique sample (12 points total; 4 time points from each of three InSCyT systems). For host-cell DNA, data each point represents a single pooled sample from each system comprising equal volumes of samples from each time point (3 points total; 1 per system). (c) Analysis of product-related variants in formulated InSCyT hGH pre-optimization (top) and post-optimization (bottom) alongside levels typically found in marketed products (Supplementary Fig. 5). Each data point represents a unique sample; there are 12 data points for pre-optimization runs (four time points from each of three InSCyT systems) and 3 data points for post-optimization runs (three time points from a single InSCyT system). Black boxes represent the range of InSCyT hGH samples with an additional line at the mean. (d) Product quality analyses for InSCyT produced hGH post-optimization alongside reference drug substance from a licensed hGH product. SDS-PAGE (12% tris-glycine) analysis of samples from the USP during biomass accumulation and production (perfusate samples), final, formulated samples (formulated samples) and the reference (Std). Activity of InSCyT hGH alongside the WHO international standard (NIBSC 98/574). Secondary structure analysis of InSCyT hGH (individual formulated samples from days 3, 6, and 10) and the reference hGH standard using circular dichroism (CD).
Figure 3
Figure 3
Accelerated process development using the InSCyT system and production of IFNα-2b. Dose size was 12 μg. Center values and error bars represent the mean and range, respectively, of technical triplicates unless otherwise noted. (a) Process development timeline for new manufacturing processes using the InSCyT system, including simultaneous unit operation development (comprised of strain development and purification development), at-scale process development (comprised of simultaneous experiments on individual modules and on the fully integrated system), and process qualification. (b) Timeline for at-scale process development for IFNα-2b. Horizontal colored bars represent the modules that were used in each experiment (USP – orange, DSP – purple, TFF – blue). Each new bar represents a new set of experimental conditions on that module. (c) Product quality for InSCyT-produced IFNα-2b from the first at-scale run after initial unit operation development (first at-scale process development run) and the final qualification run alongside a reference drug substance produced in E. coli. SDS-PAGE (12% tris-glycine) analysis of samples from the USP during production (P), a final, formulated sample (F) and a reference drug substance (Std). Analysis of process-related variants in formulated InSCyT IFNα-2b (per Fig. 2b). Each data point represents a unique sample, there is 1 data point from the first at-scale process development run and 4 data points from the qualification run (four time points from a single InSCyT system). Product-related variants detected in formulated InSCyT IFNα-2b alongside levels typically found in a reference drug substance (Supplementary Fig. 5). Black boxes represent the range of InSCyT IFNα-2b samples with an additional line at the mean. Secondary structure analysis of InSCyT IFNα-2b (triplicate analyses of an individual sample from the qualification run) and reference drug substance (duplicate analyses of an individual sample) using circular dichroism (CD).
Figure 4
Figure 4
Production of G-CSF on three identical InSCyT systems. Dose size 300 μg. Center values and error bars represent the mean and range, respectively, of technical triplicates unless otherwise noted. (a) Timeline and yields for production of G-CSF using the InSCyT system for a single representative sample (Batch #1). Wet cell weight (WCW) (black circles) and cumulative unpurified (orange) and formulated (blue) doses of G-CSF are shown. Grey circles represent individual data points. Product quality for InSCyT-produced G-CSF alongside drug substance from a licensed product produced in E. coli and Neupogen® (produced by Amgen in E. coli). A photo of vials comparing material sampled from the USP (perfusate) to final formulated material (formulated). SDS-PAGE (12% tris-glycine) analysis of Batch #1 from the USP during biomass accumulation (G) and production (P), and a final, formulated InSCyT sample (F) alongside drug substance from a licensed product (Std). Analysis of product purity by isoelectric focusing (IEF) for formulated Batch #1. Gel analyses of Batch #1 are representative of all six batches (Supplementary Fig. 9). Analysis of product-related variants and process-related variants. Each data point represents a unique batch (2 time points from each of 3 distinct systems). Paired data points indicate analyses from a single batch. Product-related variants are shown alongside levels typically found in marketed products (Supplementary Fig. 5). Black boxes represent the range of InSCyT G-CSF samples with an additional line at the mean. Process-related variants are shown alongside common guidelines (per Fig. 2b). Analysis of the secondary structures of InSCyT G-CSF (Batches 1–6) and a reference drug substance from a licensed product using circular dichroism (CD). Activity of InSCyT G-CSF alongside that of the WHO International standard (NIBSC 09/136). (b) Analysis of pharmacokinetics (PK), pharmacodynamics (PD), and toxicology of InSCyT-produced G-CSF and a licensed product (Neupogen®) in a rat model. Neutrophil activation and pharmacokinetic profile of low dose (115 μg/kg, n=3 animals, t1/2 = 2.1 h) and high dose (575 μg/kg, n=3 animals, t1/2 = 4.6 h) InSCyT G-CSF in rats compared to Neupogen (115 μg/kg, n=3 animals, t1/2 = 1.4 h) (PK: p=0.9963, Kolmogorov-Smirnov test). For neutrophil activation, grey boxes represent the range of three individual animals with an additional line at the mean. For PK center points and error bars represent the mean and range, respectively, of three individual animals. Summary of statistically significant results comparing the toxicology of InSCyT G-CSF and Neupogen® to a vehicle control. Values represent the mean; standard deviation and sample size can be found in Supplementary Fig. 11. Statistical significance was determined by one-way ANOVA. ALP – alkaline phosphatase

References

    1. Adiga R et al. Point-of-care production of therapeutic proteins of good-manufacturing-practice quality. Nat. Biomed. Eng (2018). doi:10.1038/s41551-018-0259-1 - DOI - PubMed
    1. Boles KS et al. Digital-to-biological converter for on-demand production of biologics. Nat. Biotechnol 35, 672–675 (2017). - PubMed
    1. Pardee K et al. Portable, on-demand biomolecular manufacturing. Cell 167, 248–259 (2016). - PubMed
    1. Perez-Pinera P et al. Synthetic biology and microbioreactor platforms for programmable production of biologics at the point-of-care. Nat. Commun 7, 12211 (2016). - PMC - PubMed
    1. Dolsten M & Søgaard M Precision medicine: an approach to R&D for delivering superior medicines to patients. Clin. Transl. Med 1, (2012). - PMC - PubMed