. 2018 Oct 1;14(10):e1007338.
doi: 10.1371/journal.ppat.1007338. eCollection 2018 Oct.

Klebsiella pneumoniae infection of murine neutrophils impairs their efferocytic clearance by modulating cell death machinery

Affiliations

Klebsiella pneumoniae infection of murine neutrophils impairs their efferocytic clearance by modulating cell death machinery

Christopher N Jondle et al. PLoS Pathog. .

Abstract

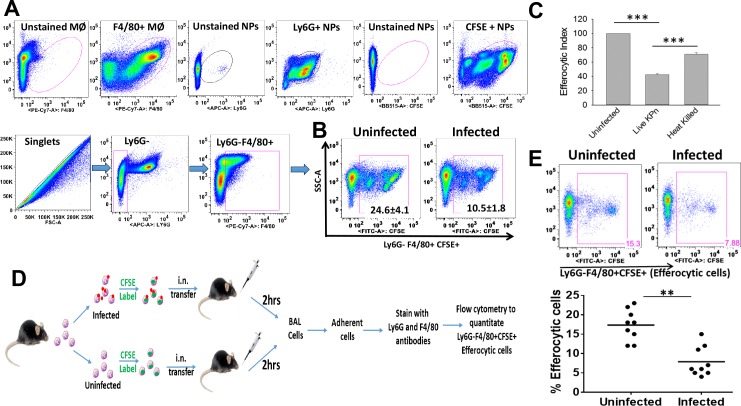
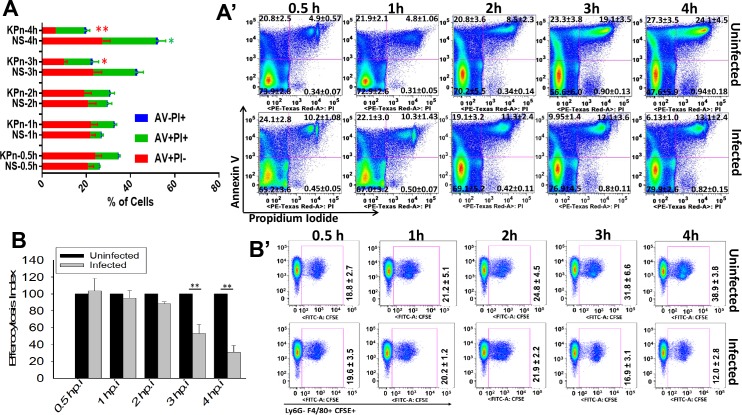
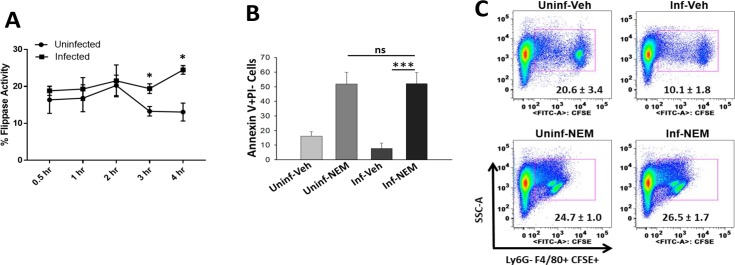
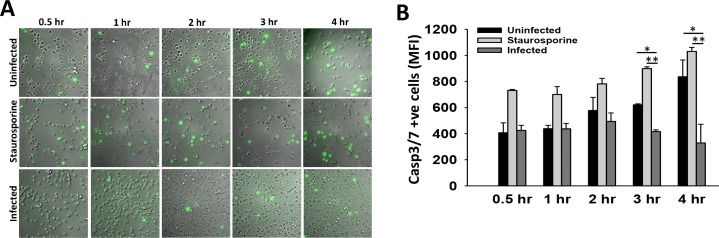
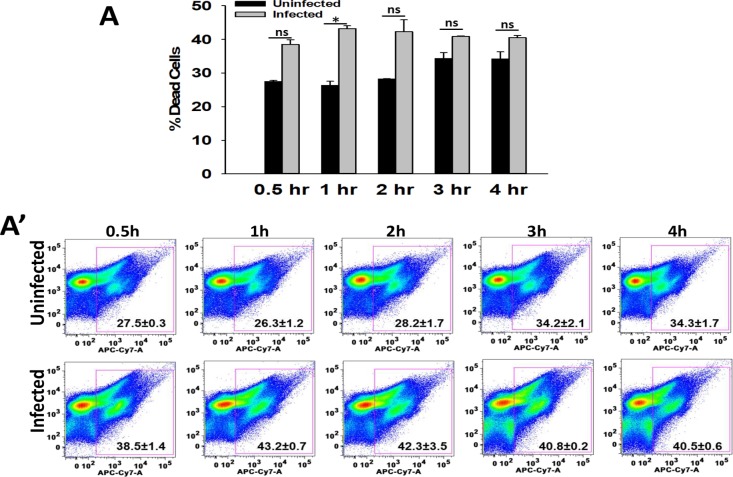
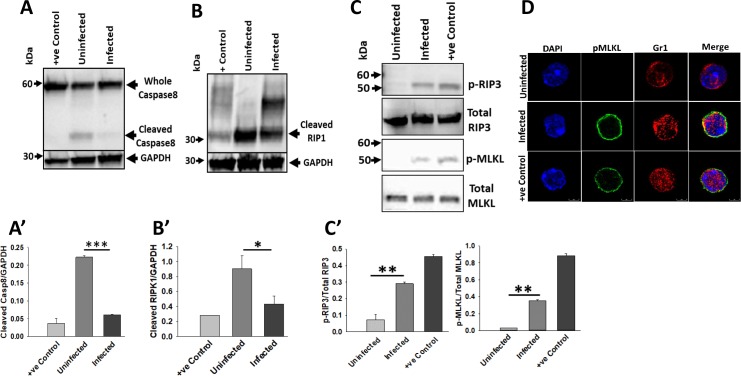
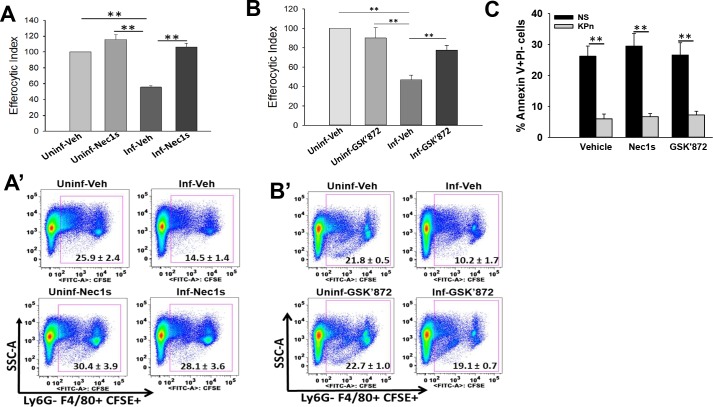
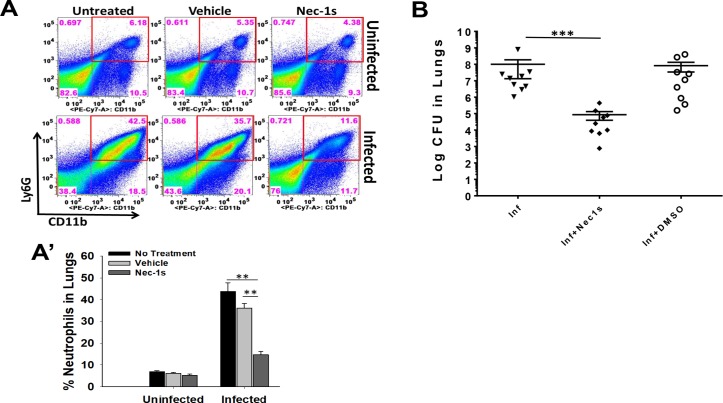
Neutrophils are the first infiltrating cell type essential for combating pneumoseptic infections by bacterial pathogens including Klebsiella pneumoniae (KPn). Following an infection or injury, removal of apoptotic infiltrates via a highly regulated process called efferocytosis is required for restoration of homeostasis, but little is known regarding the effect of bacterial infection on this process. Here we demonstrate that KPn infection impedes the efferocytic uptake of neutrophils in-vitro and in-vivo in lungs by macrophages. This impaired efferocytosis of infected neutrophils coincides with drastic reduction in the neutrophil surface exposure of apoptosis signature phospholipid phosphatidyserine (PS); and increased activity of phospholipid transporter flippases, which maintain PS in the inner leaflet of plasma membrane. Concomitantly, pharmacological inhibition of flippase activity enhanced PS externalization and restored the efferocytosis of KPn infected neutrophils. We further show that KPn infection interferes with apoptosis activation and instead activates non-apoptotic programmed cell death via activation of necroptosis machinery in neutrophils. Accordingly, pharmacological inhibition of necroptosis by RIPK1 and RIPK3 inhibitors restored the efferocytic uptake of KPn infected neutrophils in-vitro. Importantly, treatment of KPn infected mice with necroptosis inhibitor improved the disease outcome in-vivo in preclinical mouse model of KPn pneumonia. To our knowledge, this is the first report of neutrophil efferocytosis impairment by KPn via modulation of cell death pathway, which may provide novel targets for therapeutic intervention of this infection.


Conflict of interest statement

The authors have declared that no competing interests exist.

Figures

Fig 1
Fig 1. Live KPn infection impairs efferocytosis of neutrophils.
(A) Schematic for gating F4/80+ macrophages that have internalized (hence are Ly6G-) CFSE labelled neutrophils (thus become CFSE+). Upper panel shows unstained and single stained cells. NP; Neutrophils, MØ, Macrophages. (B) Neutrophils left uninfected or infected with live or heat-killed KPn at MOI 10 for 3 hours, followed by labelling with the DNA dye CFSE and incubated with macrophages at 5:1 ratio for 2hrs. Macrophages were then processed for flow-cytometry by staining with anti-F4/80 and anti- Ly6G antibodies. Representative plot from one out of five independent experiments is shown. The numbers on pseudocolor plots show percent (average ± SEM) of Ly6G-F4/80+CFSE+ cells calculated from 5 independent experiments (3 technical replicates for each samples per experiment). The statistical analysis was done by Student’s t test (p<0.001). (C) Efferocytic Index shown as percent efferocytosis of infected neutrophils normalized to that of uninfected cells taken as 100%. Data shown is average ± SEM from 3–5 independent experiments. Statistics was done by ANOVA with Dunn’s post hoc analysis (***, p<0.001). (D). Schematic for in-vivo efferocytosis in the lungs of mice. CFSE labelled uninfected or KPn infected neutrophils were instilled intranasally in anaesthetized mice and lungs were lavaged 2 hrs later. Adherent cells were stained with F4/80 and Ly6G antibodies for flow cytometry. (E). Representative flow cytometry dot plots showing percent of Ly6G-F4/80+CFSE+ efferocytic macrophages from mice instilled with uninfected or KPn infected neutrophils. The scatter plot shows percent efferocytic cells in each group of mice where each dot represents an animal. n = 9 from 3 independent experiments (**, p<0.005).
Fig 2
Fig 2. KPn infection decreases the level of surface exposed phosphatidylserine (PS) and reduces efferocytosis of infected neutrophils.
(A) Neutrophils were left uninfected (NS) or were infected with KPn (MOI 10). The level of PS was monitored by over time post-infection by Annexin V (AV) staining using an Annexin V Apoptosis Detection followed by flow cytometry analysis. Propidium iodide (PI) was used to exclude necrotic cells. Percent of AV+PI- (red bars), AV+PI+ (green bars) and AV-PI+ (blue bars) cells at indicated times is shown (mean ± SEM from 8 independent experiments. Statistical analysis was done by Student’s t test. Red asterisks indicate statistical significance between NS and KPn infected AV+PI- cells and green asterisks indicate statistical significance between NS and KPn infected AV+PI+ cells (*, p<0.05; p**<0.005). (A’) shows the representative flow cytometry quadrant plots at each time point. (B). Neutrophils infected for indicated times post-infection were labelled with CFSE and incubated with macrophages for 2hrs followed by flow cytometry to enumerate efferocytic Ly6G-F4/80+CFSE+ macrophages. Efferocytic index was calculated as described above. Data shown are mean ± SEM from 5 independent experiments with 2–3 replicates of each sample per experiments. Student’s t test was used for statistical analysis (p**<0.005). (B’) shows representative dot plots at each time point.
Fig 3
Fig 3. Inhibition of Flippase activity by N-ethylmaleimide (NEM) treatment rescues surface exposed “eat me” signal PS in KPn infected cells and restores efferocytosis.
(A). KPn infection increases flippase activity in neutrophils. Flippase activity in uninfected and KPn infected neutrophils was calculated at indicated time points using NBD-PS fluorescence before and after exofacial bleaching with sodium dithionite treatment as described in methods. Data shown is mean ± SEM from 3 independent experiments. Student’s t test was used for two group comparisons. (*p<0.05). (B). The level of surface exposed PS in uninfected or KPn infected neutrophils with or without NEM treatment (5mM for 30 min) was measured by Annexin V staining followed by flow cytometry. Percent of Annexin V+ PI- cells at 3 hrs post-infection is shown (mean ± SEM from 3 independent experiments. Non-parametric ANOVA with Dunn’s post hoc test was used for statistical analysis (***, p<0.001). (C) Uninfected and KPn infected neutrophils were treated with vehicle (ultrapure water) or NEM (5mM for 30 min) as described in Methods, followed by in-vitro efferocytosis. Flow cytometry was performed to enumerate percent of Ly6G- F4/80+ CFSE+ efferocytic cells. Representative dot plots from one experiment out of 3 independent experiments is shown. The numbers on dot plots are mean ± SEM from 3 independent experiments with 3–4 replicates per experiment for each sample. No statistically significant difference was found between efferocytosis of uninfected and KPn infected neutrophils upon NEM treatment. Uninf; Uninfected, Inf; KPn infected, Veh; Vehicle, NEM; N-ethylmaleimide.
Fig 4
Fig 4. Reduced Caspase3/7 activation in KPn infected neutrophils.
(A). Representative images of uninfected, KPn infected or Staurosporine treated cells showing Caspse3/7 activation (green) by using CellEvent Caspase-3/7 Green Detection Reagent as described in methods. (B). Mean Fluorescence intensity (MFI) of cells with activated Caspase3/7 over time as measured by flow cytometry using Caspase3/7 activation kit. Data shown are mean ± SEM from 3 independent experiments with 2–3 replicates per group. Statistical analysis was done by ANOVA with Dunn’s post hoc analysis (*p<0.05, p**<0.005).
Fig 5
Fig 5. KPn infection causes cell death.
Peritoneal neutrophils uninfected or infected with KPn (MOI 10). At indicated times, dead cells were enumerated by staining with LIVE/DEADFixable Near-IR Dead Cell Stain Kit (Invitrogen) per manufacturer’s instructions. Cells were then washed and analyzed by flow cytometry. Data in (A) is mean ± SEM from 2 independent experiments with 3–5 replicates each time. Representative dot plots are shown in (A’). Student’s t test was used for statistical analysis (p*<0.05). ns, not significant.
Fig 6
Fig 6. KPn infection activates necroptosis in neutrophils.
Representative immunoblots for cleaved caspase-8 (A) and RIPK1 (B), as well as phosphorylated RIPK3 and MLKL (C) in whole cell lysates from uninfected and KPn infected neutrophils (3hp.i.) are shown. Lysate from primary neutrophils treated with TNF-α with SMAC mimetic and pan-caspase inhibitor Q‐VD-OPh were used as positive control for necroptosis activation. Densitometry analysis of the blots was preformed using Image J software and band intensities were represented as (A’ and B’) ratio of the protein of interest and the internal control levels; and (C’) ratio of phosphorylated protein and the total protein. Data shown are mean ± SEM from 3–4 independent experiments. Statistical analysis was done by ANOVA with Dunn’s post hoc analysis (*, p<0.05; p**<0.005***, p<0.001). (D). Representative confocal microscopy images of uninfected, KPn infected (MOI 10 for 3 hrs) and neutrophils treated with TNF-α with SMAC mimetic and pan-caspase inhibitor Q‐VD-OPh (necroptosis activation). The cells were imaged for translocation of phosphorylated MLKL (green) to neutrophil membrane. Gr1 (red) was used as neutrophil membrane marker. Nuclei were stained with DAPI. Scale bar 5μM. The experiment was repeated twice with same results.
Fig 7
Fig 7. Necroptosis blockage restores the efferocytosis of KPn infected neutrophils independent of PS exposure.
(A). Efferocytosis was performed with CFSE-labelled uninfected or KPn infected neutrophils treated with RIPK-1 inhibitor Necrostatin-1s or vehicle alone as described in methods. Efferocytic index was calculated as percent efferocytotic cells (Ly6G- F4/80+ CFSE+ macrophages) with infected neutrophils normalized to those with uninfected cells taken as 100%. (A’) shows representative dot plots from one of these experiments. The numbers shown are average percentage ± SEM from 3–5 independent experiments with 3–4 replicates. (B & B’) show similar experiment with RIPK3 inhibitor GSK’872 treatment. (C). Uninfected or KPn infected neutrophils were treated with vehicle alone (DMSO) or Nec1s or GSK’872 as described in methods followed by flow cytometry analysis of PS levels (Annexin V+PI- cells) at 3hp.i. using an Annexin V Apoptosis Detection kit. Statistical analysis was done by ANOVA with Dunn’s post hoc analysis (**, p<0.005).
Fig 8
Fig 8. Necroptosis blockage improves the disease outcome in KPn pneumonia.
(A). C57BL/6 mice infected intranasally with 3.0x10⁴ CFUs of KPn received intraperitoneally 100μl of 100μM necrostatin-1s or vehicle (DMSO) 2hrs prior to infection and then every 4hrs for 12hrs post-infection. Mice were sacrificed at 3 days post infection, lungs were isolated and were processed for flow cytometry analysis of neutrophils by staining with anti-Ly6G-APC and anti-CD11b-Pacific Blue antibodies. Representative dot plots from one out of 3 independent experiments is shown. (A’) shows percent neutrophils (Ly6G+CD11b+) as mean ± SEM from three independent experiments with 3–5 mice per group in each experiment. Statistical analysis was done by ANOVA with Dunn’s post hoc analysis (**, p<0.005). (B). In separate set of experiments performed similarly as in (A), lungs were homogenized aseptically and plated to enumerate bacterial burden. Each dot represents one mouse. n = 9 in each group in 3 independent experiments. (***, p<0.001).

References

    1. Eddens T, Kolls JK. Host defenses against bacterial lower respiratory tract infection. Current opinion in immunology. 2012;24(4):424–30. Epub 2012/07/31. 10.1016/j.coi.2012.07.005 . - DOI - PMC - PubMed
    1. Kang CI, Song JH, Chung DR, Peck KR, Ko KS, Yeom JS, et al. Risk factors and pathogenic significance of severe sepsis and septic shock in 2286 patients with gram-negative bacteremia. The Journal of infection. 2011;62(1):26–33. Epub 2010/11/09. 10.1016/j.jinf.2010.10.010 . - DOI - PubMed
    1. Nordmann P, Cuzon G, Naas T. The real threat of Klebsiella pneumoniae carbapenemase-producing bacteria. The Lancet infectious diseases. 2009;9(4):228–36. Epub 2009/03/28. 10.1016/S1473-3099(09)70054-4 . - DOI - PubMed
    1. van der Poll T, van de Veerdonk FL, Scicluna BP, Netea MG. The immunopathology of sepsis and potential therapeutic targets. Nature reviews Immunology. 2017. 10.1038/nri.2017.36 . - DOI - PubMed
    1. Angus DC, Linde-Zwirble WT, Lidicker J, Clermont G, Carcillo J, Pinsky MR. Epidemiology of severe sepsis in the United States: analysis of incidence, outcome, and associated costs of care. Critical care medicine. 2001;29(7):1303–10. Epub 2001/07/11. . - PubMed

Publication types

MeSH terms

Substances