. 2019 Jan;156(1):145-159.e19.
doi: 10.1053/j.gastro.2018.09.047. Epub 2018 Sep 28.

Epithelial RNase H2 Maintains Genome Integrity and Prevents Intestinal Tumorigenesis in Mice

Affiliations

Epithelial RNase H2 Maintains Genome Integrity and Prevents Intestinal Tumorigenesis in Mice

Konrad Aden et al. Gastroenterology. 2019 Jan.

Abstract

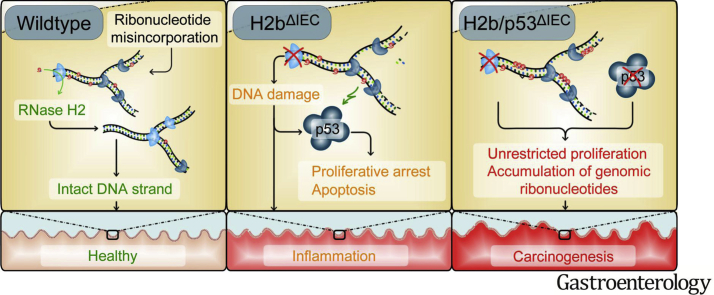
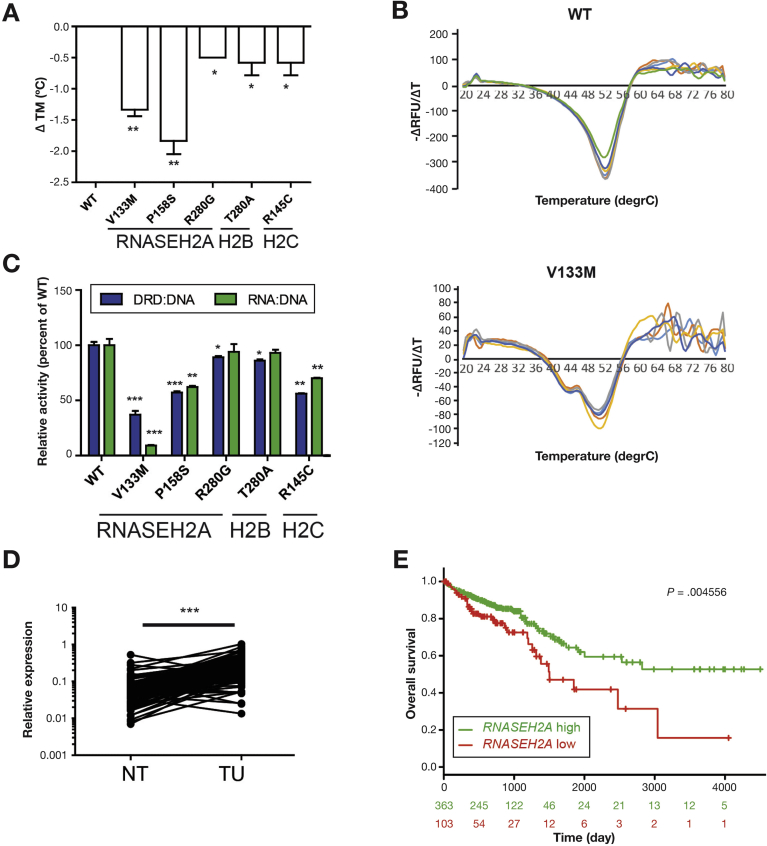
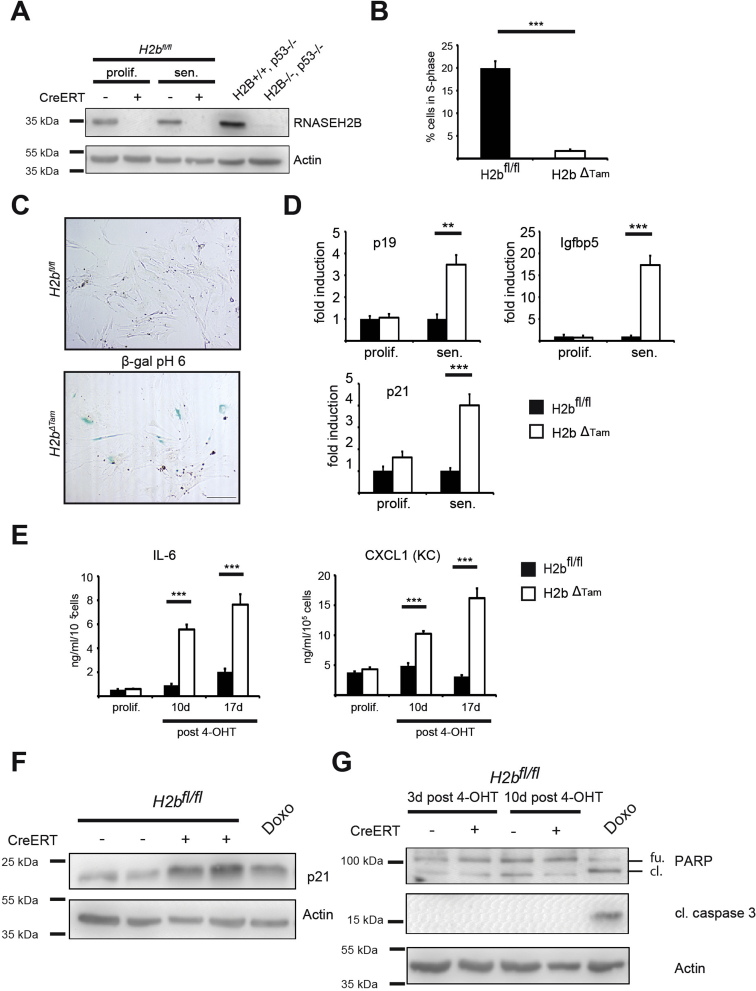
Background & aims: RNase H2 is a holoenzyme, composed of 3 subunits (ribonuclease H2 subunits A, B, and C), that cleaves RNA:DNA hybrids and removes mis-incorporated ribonucleotides from genomic DNA through ribonucleotide excision repair. Ribonucleotide incorporation by eukaryotic DNA polymerases occurs during every round of genome duplication and produces the most frequent type of naturally occurring DNA lesion. We investigated whether intestinal epithelial proliferation requires RNase H2 function and whether RNase H2 activity is disrupted during intestinal carcinogenesis.

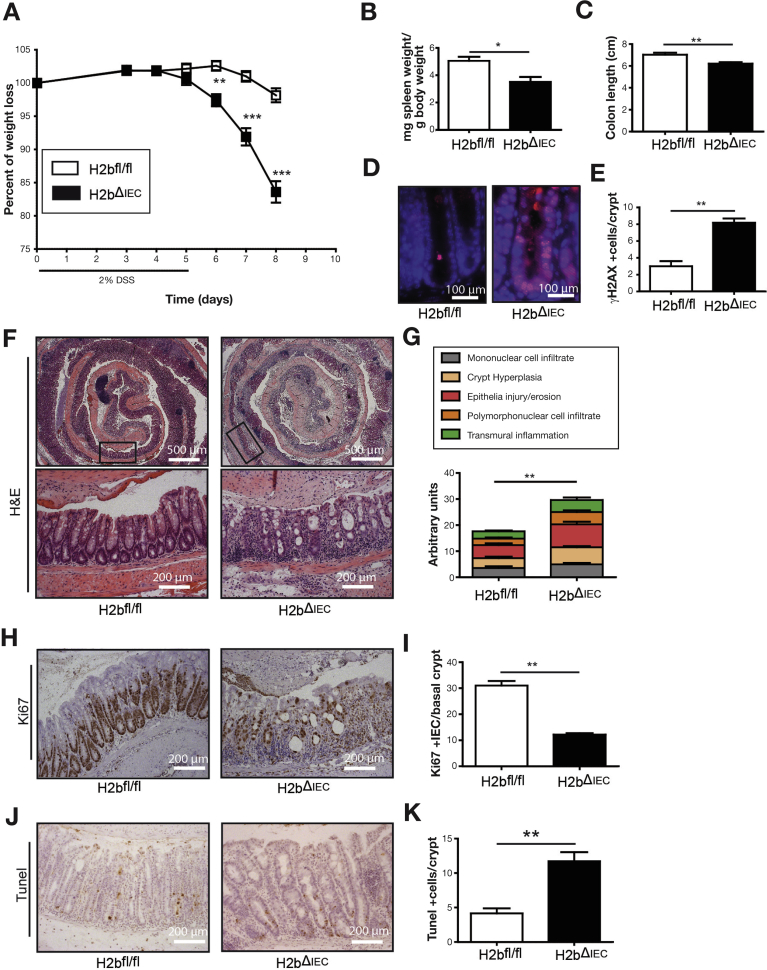
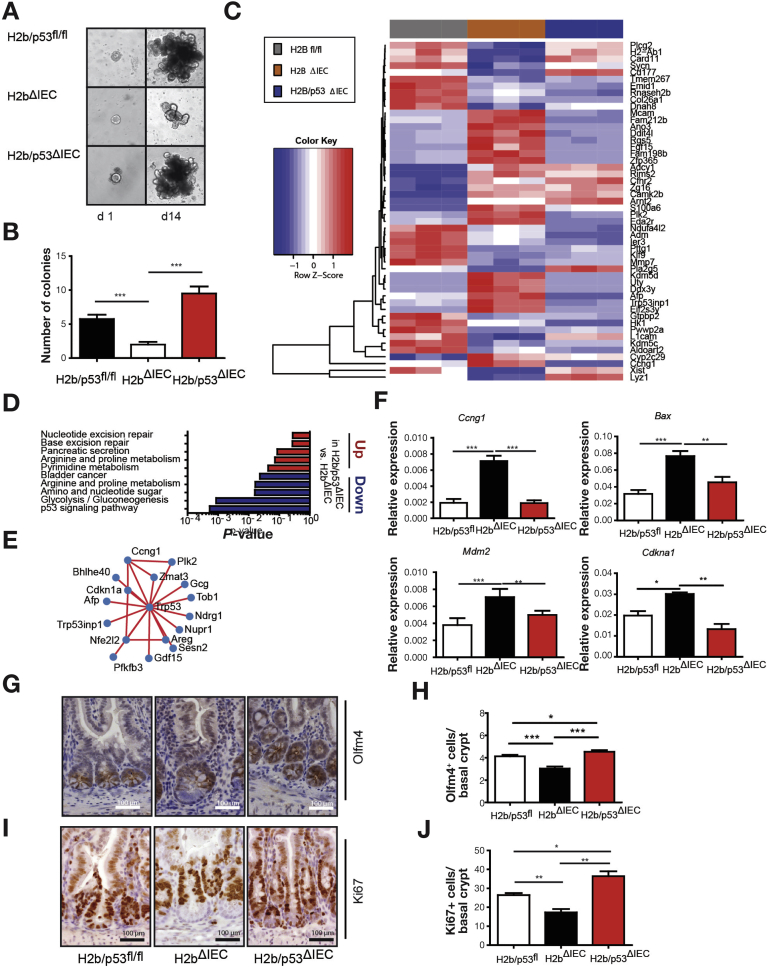
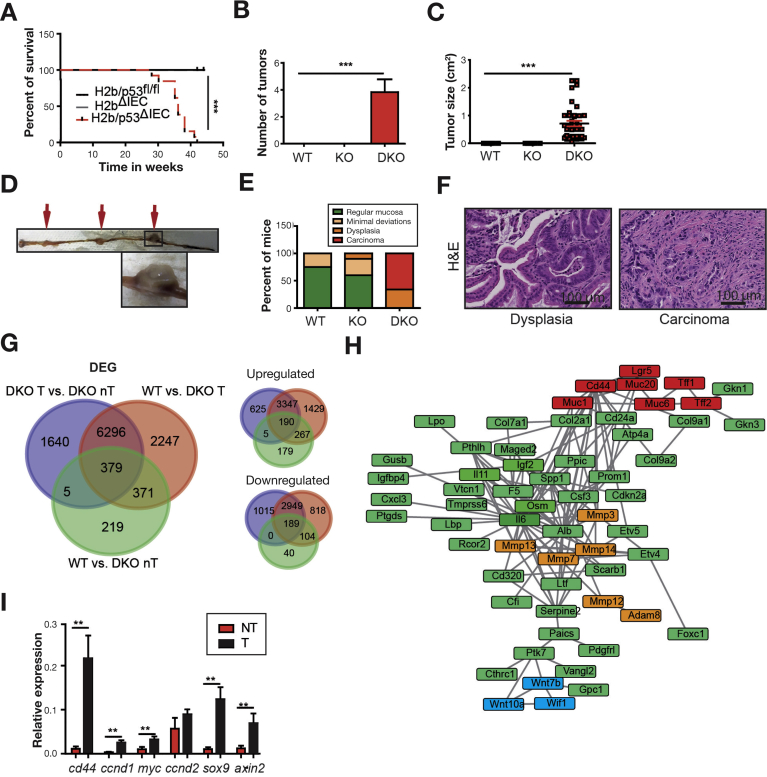
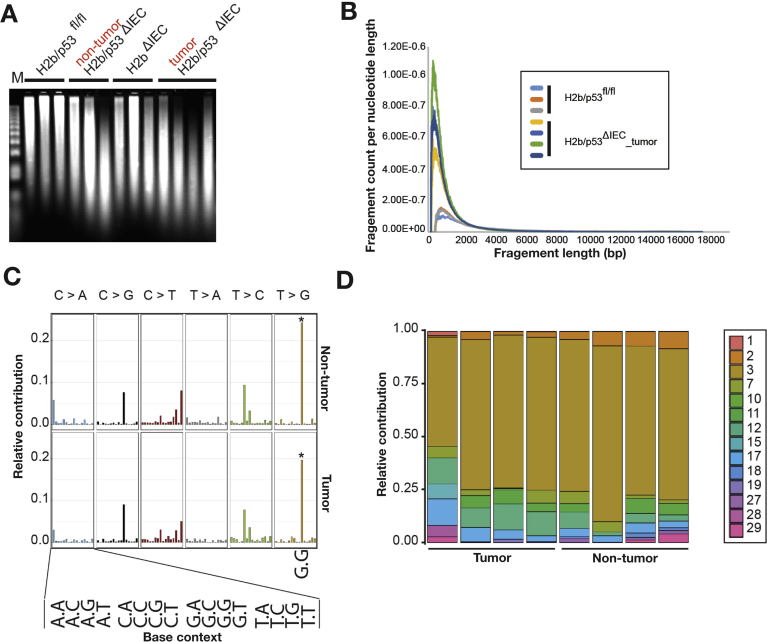
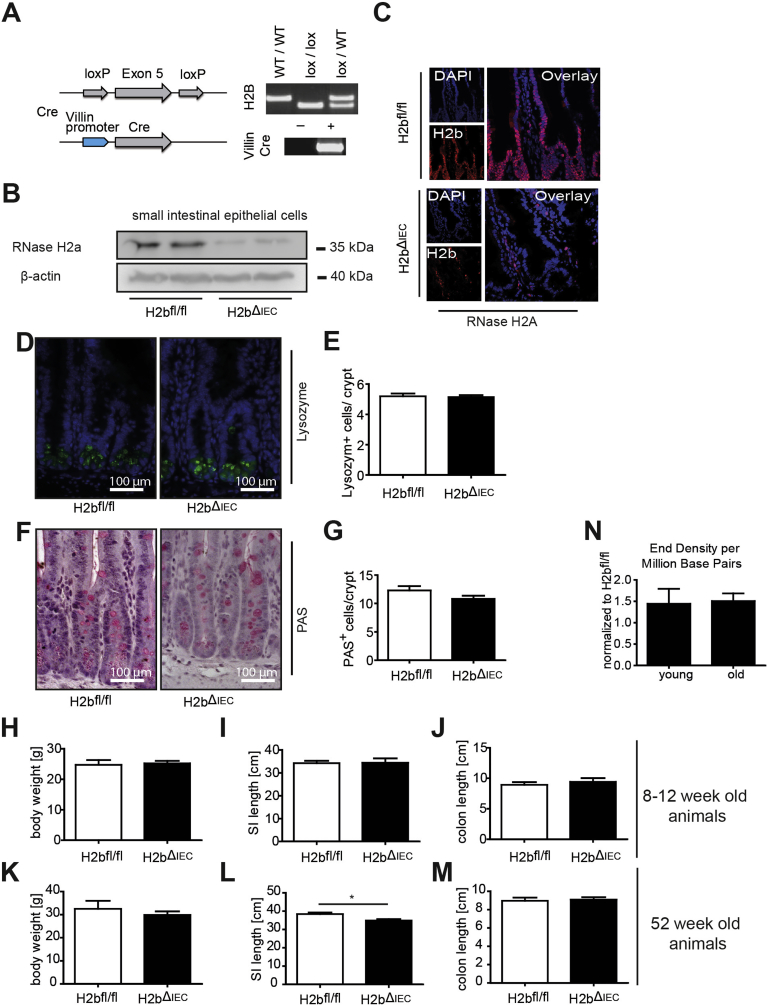
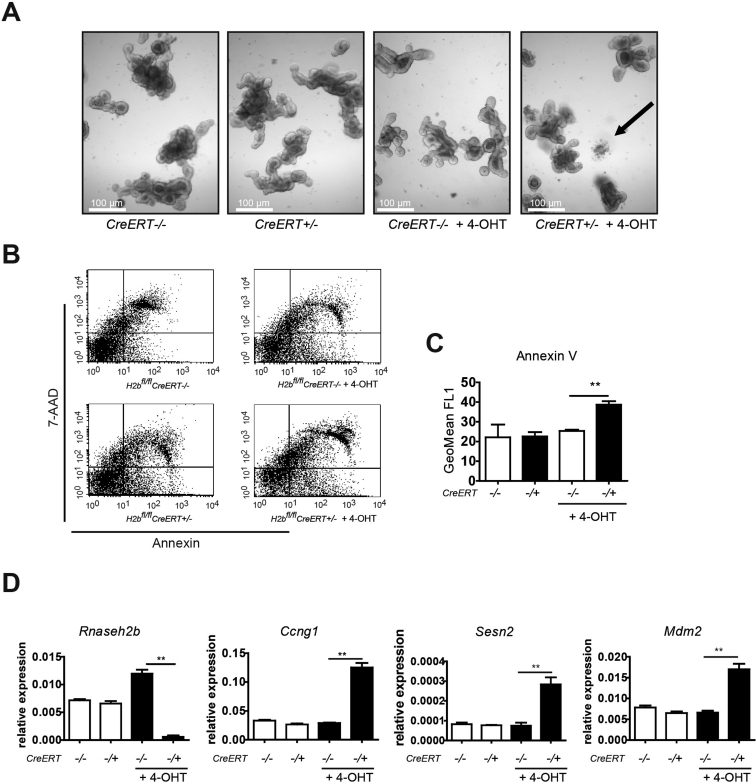
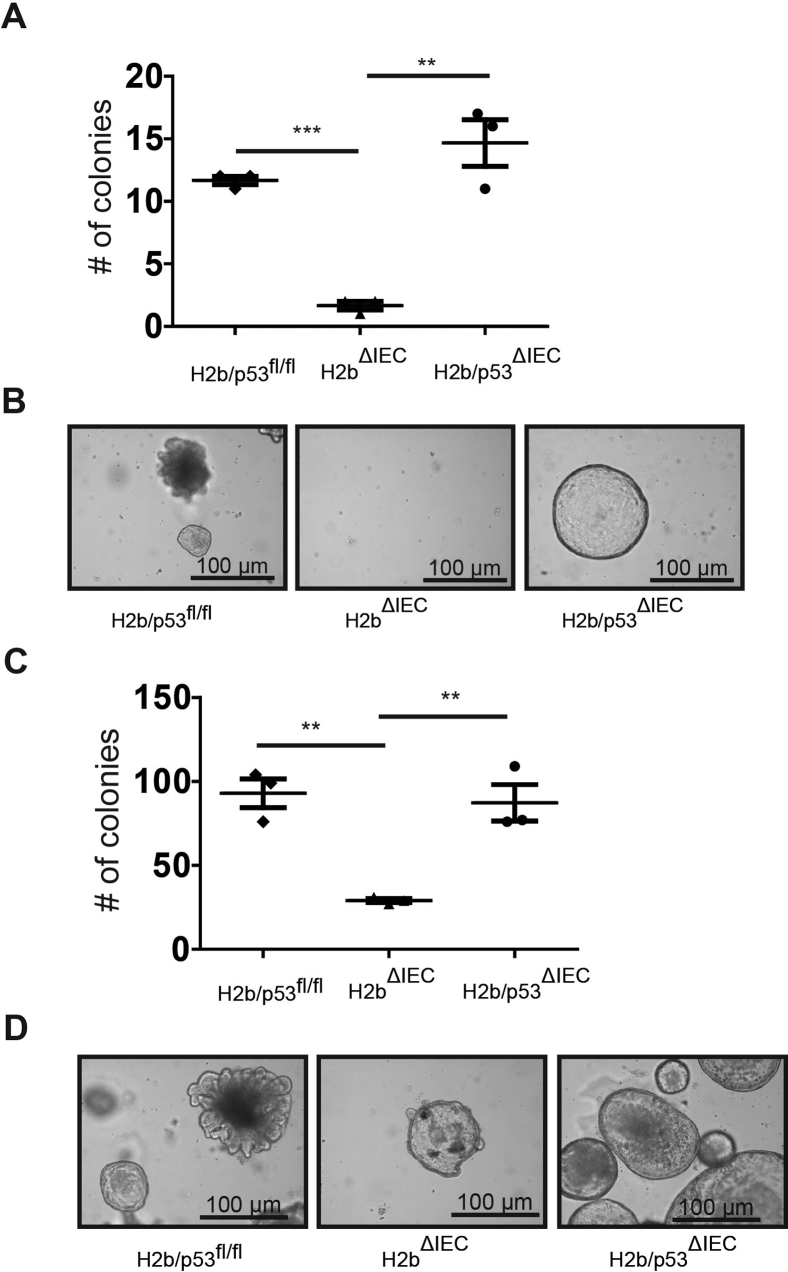
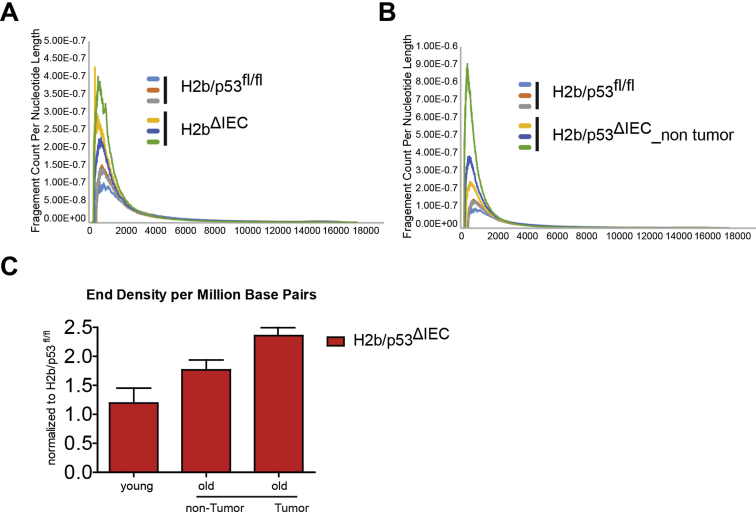
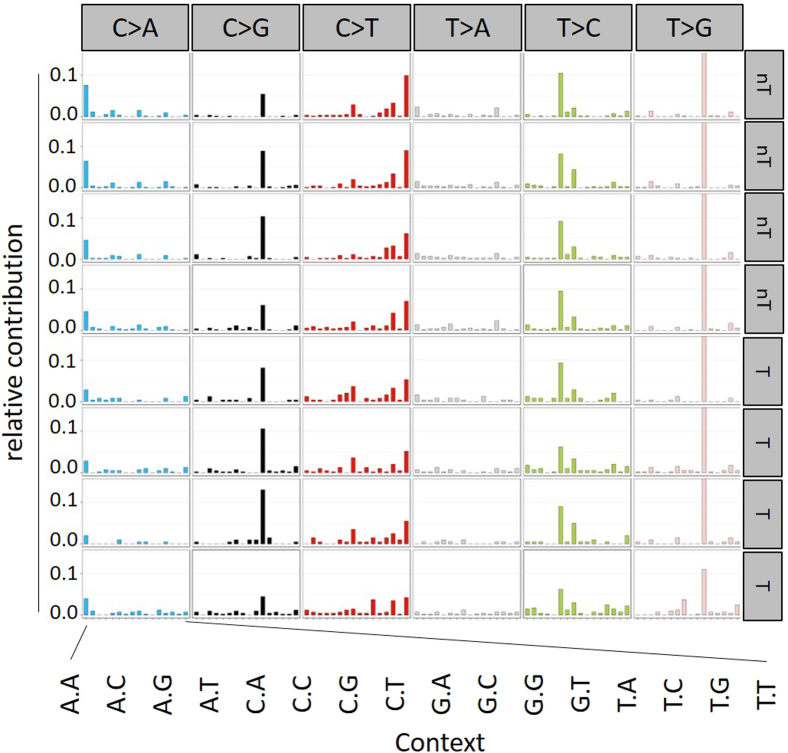
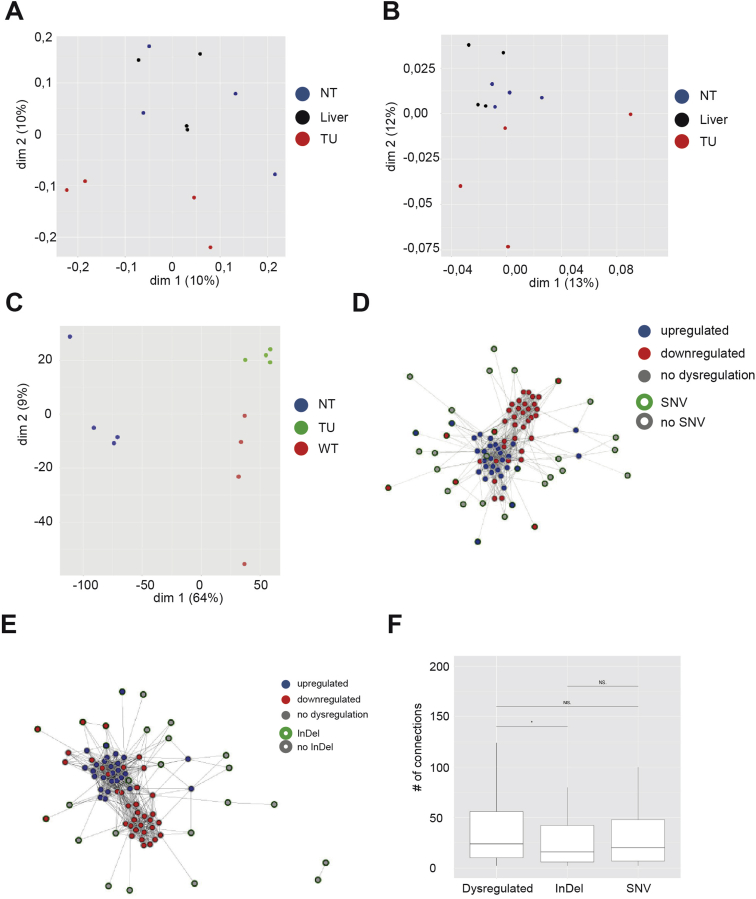
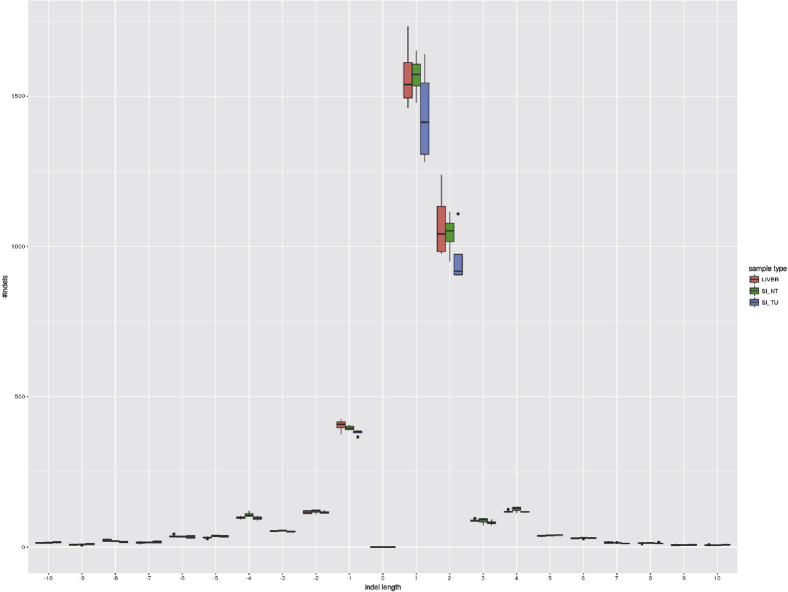
Methods: We generated mice with epithelial-specific deletion of ribonuclease H2 subunit B (H2bΔIEC) and mice that also had deletion of tumor-suppressor protein p53 (H2b/p53ΔIEC); we compared phenotypes with those of littermate H2bfl/fl or H2b/p53fl/fl (control) mice at young and old ages. Intestinal tissues were collected and analyzed by histology. We isolated epithelial cells, generated intestinal organoids, and performed RNA sequence analyses. Mutation signatures of spontaneous tumors from H2b/p53ΔIEC mice were characterized by exome sequencing. We collected colorectal tumor specimens from 467 patients, measured levels of ribonuclease H2 subunit B, and associated these with patient survival times and transcriptome data.

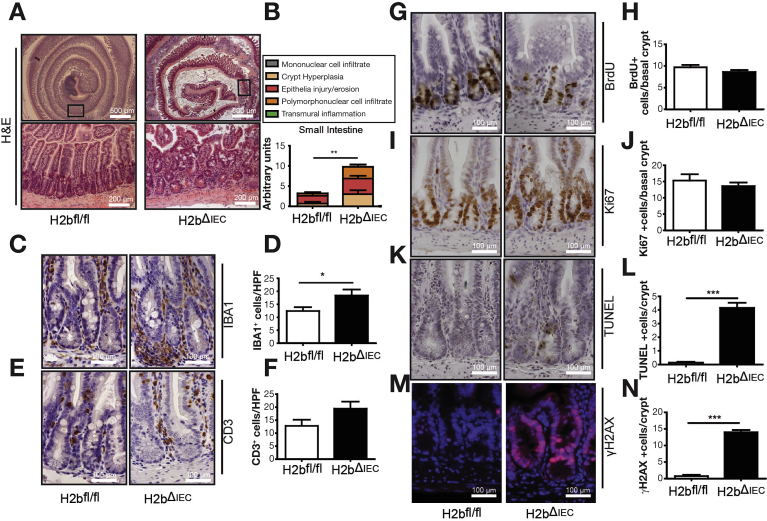
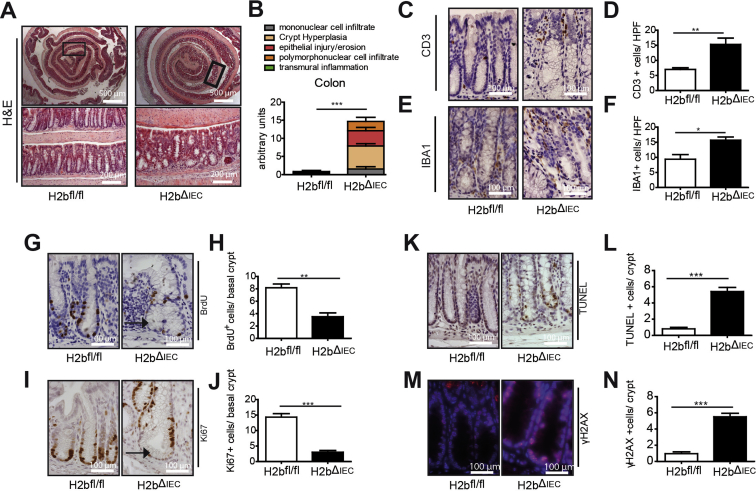
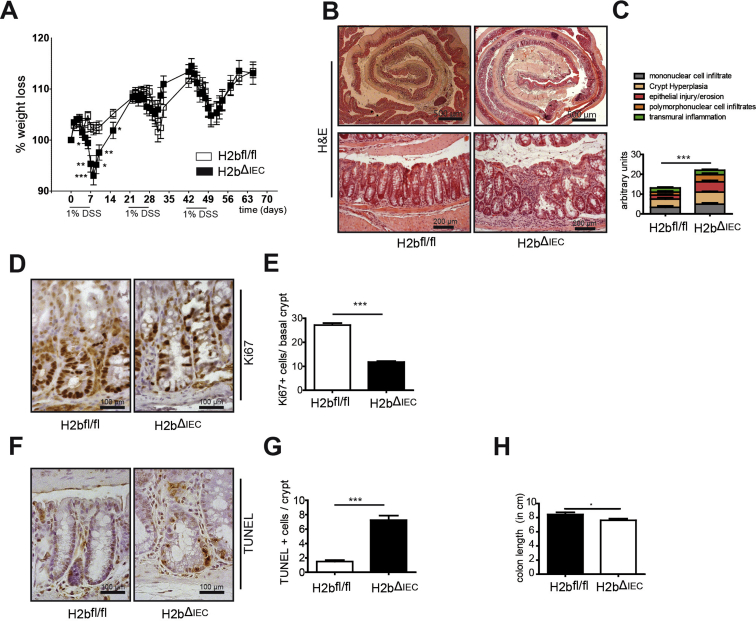
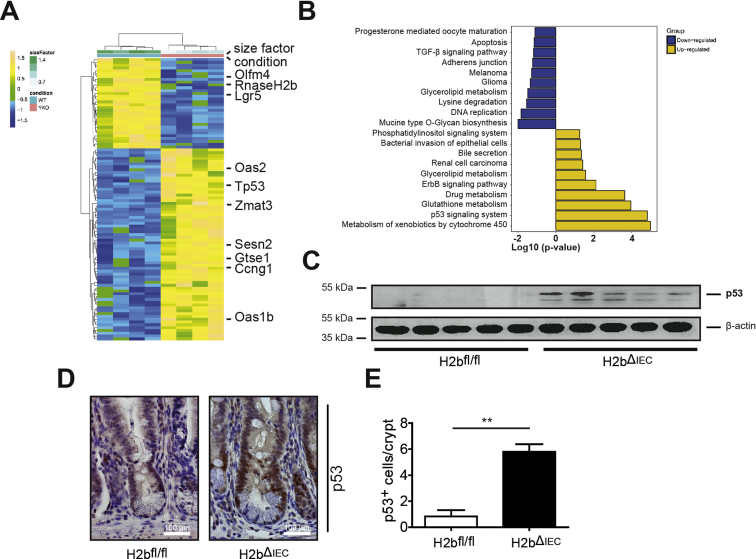
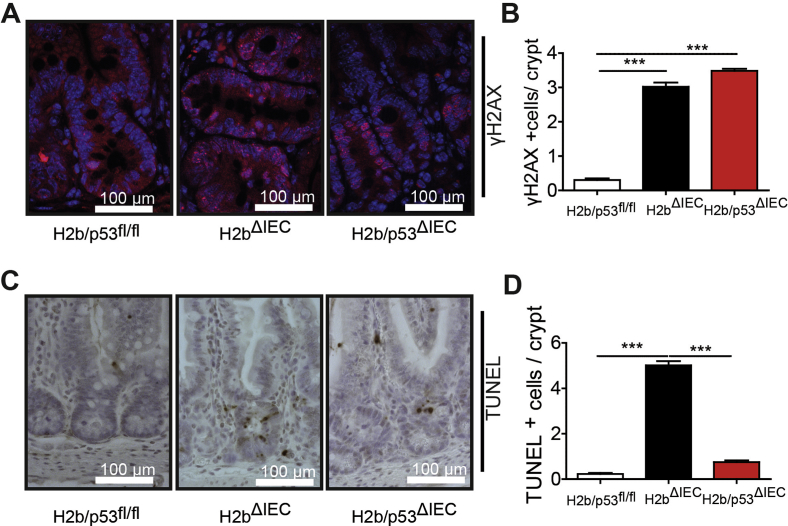
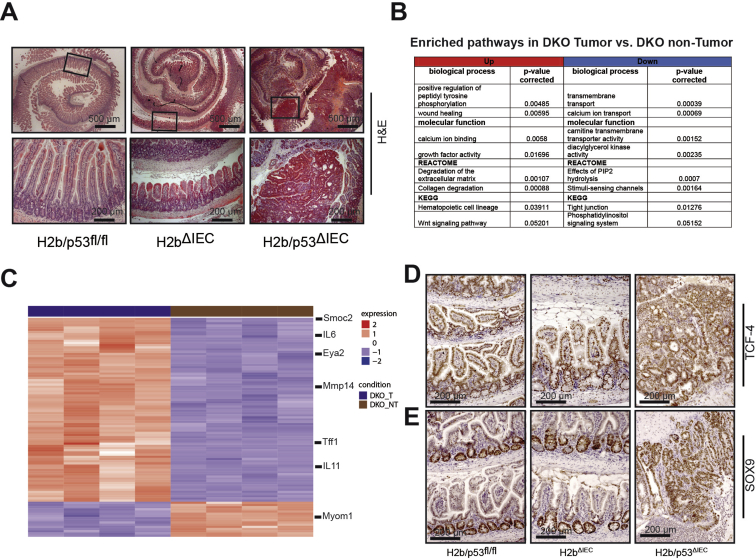
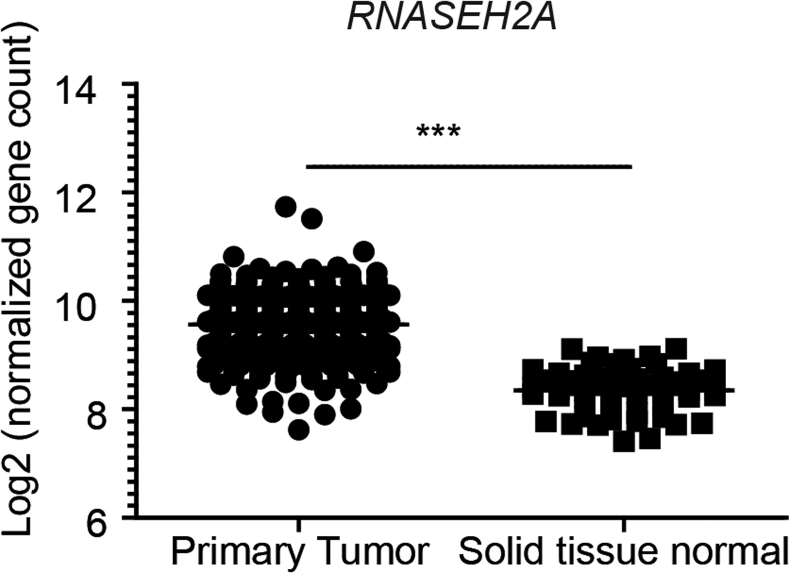
Results: The H2bΔIEC mice had DNA damage to intestinal epithelial cells and proliferative exhaustion of the intestinal stem cell compartment compared with controls and H2b/p53ΔIEC mice. However, H2b/p53ΔIEC mice spontaneously developed small intestine and colon carcinomas. DNA from these tumors contained T>G base substitutions at GTG trinucleotides. Analyses of transcriptomes of human colorectal tumors associated lower levels of RNase H2 with shorter survival times.

Conclusions: In analyses of mice with disruption of the ribonuclease H2 subunit B gene and colorectal tumors from patients, we provide evidence that RNase H2 functions as a colorectal tumor suppressor. H2b/p53ΔIEC mice can be used to study the roles of RNase H2 in tissue-specific carcinogenesis.

Keywords: Colon Cancer; DNA Repair; Mouse Model; Ribonucleotide Excision Repair.


Figures

None
Graphical abstract
Figure 1
Figure 1
Increased DNA damage and apoptosis in young H2bΔIEC mice. Representative images (A) and histologic analysis of H&E sections (B) from small intestinal section (n = 5 for the 2 genotypes). Representative images and statistical assessment of abundance of IBA1+ (C, D) and CD3+ cells (E, F) in the lamina propria of H2bfl/fl or H2bΔIEC mice. Anti-BrdU (G, H) and anti-Ki67 (I, J) staining in small intestinal sections. TUNEL+ (K, L) and anti-γH2AX+ (M, N) staining in small intestinal sections. (D, F) A minimum of 5 HPFs per intestine were assessed in 8- to 12-week-old H2bΔIEC (n = 5; 3 male and 2 female) and H2bfl/fl control (n = 6; 4 male and 2 female) mice. (H–N) A minimum of 100 crypts per intestine were assessed for H2bΔIEC (n = 5; 3 male and 2 female) and H2bfl/fl control (n = 6; 4 male and 2 female) mice. Data are expressed as mean ± standard error of the mean and significance was determined using nonparametric Mann-Whitney U-test. *P < .05; ***P < .001. BrdU, bromodeoxyuridine; H&E, hematoxylin and eosin; HPF, high-power field; TUNEL, terminal deoxynucleotidyl transferase deoxyuridine triphosphate nick end labeling.
Figure 2
Figure 2
Impaired epithelial regeneration in aged H2bΔIEC mice. Anti-BrdU incorporation (A, B) and anti-Ki67 staining (C, D) in small intestinal sections. Note the lack of cellular proliferation in the intestinal stem cell niche located at the crypt base (arrow). TUNEL (E, F) and anti-γH2AX (G, H) staining in small intestinal sections. Lysozyme (I, J) and PAS (K, L) staining in small intestinal sections. (M) Distorted Paneth cell ultrastructure in H2bΔIEC mice (bottom pictures represent magnifications of the images above). Histologic analysis of H&E staining (N, O) in small intestinal sections (n = 5 per genotype). (B, D, F, H, J, L) A minimum of 100 crypts per intestine and (N) whole small intestinal Swiss rolls were assessed in 52-week-old H2bΔIEC (n = 10; 6 male and 4 female) and H2bfl/fl control (n = 6; 3 male and 3 female) mice. Data are expressed as mean ± standard error of the mean and significance was determined using nonparametric Mann-Whitney U-test. *P < .05; **P < .01; ***P < .001. BrdU, bromodeoxyuridine; H&E, hematoxylin and eosin; PAS, periodic acid–Schiff; TUNEL, terminal deoxynucleotidyl transferase deoxyuridine triphosphate nick end labeling.
Figure 3
Figure 3
Increased susceptibility to DSS-induced colitis in H2bΔIEC mice. (A) Weight loss curve of 8- to 12-week-old H2bfl/fl (n = 12; 9 male and 3 female) and H2bΔIEC (n = 10; 5 male and 5 female) mice. Postmortem (B) spleen weight (n = 12 of 10) and (C) colon length (n = 12 of 10) of H2bfl/fl and H2bΔIEC mice. (D, E) Anti-γH2AX staining in small intestinal sections. (F) H&E staining and (G) corresponding histologic assessment from colon tissue. (H) Anti-Ki67 staining of colon Swiss rolls and (I) corresponding assessment. (J) TUNEL staining and (K) quantification of TUNEL stain of colon Swiss rolls. (E, I, K) A minimum of 100 crypts per intestine and (G) whole small intestinal Swiss rolls were assessed in H2bΔIEC (n = 10; 5 male and 5 female) and H2bfl/fl control (n = 12; 9 male and 3 female) mice. Significance was determined using 2-tailed Student t-test and expressed as mean ± standard error of the mean. *P < .05; **P < .01; ***P < .001. H&E, hematoxylin and eosin; TUNEL, terminal deoxynucleotidyl transferase deoxyuridine triphosphate nick end labeling.
Figure 4
Figure 4
Epithelial regeneration failure in aged H2bΔIEC mice depends on p53. (A) Representative images and (B) statistical analysis of small intestinal growth after 14 days of cultivation. (C) Heatmap showing clustering of top 50 up- and down-regulated genes in H2bΔIEC, H2bfl/fl, and H2b/p53ΔIEC intestinal organoids. (D) Gene set enrichment (KEGG) analysis of top 250 up- and down-regulated genes in H2b/p53ΔIEC vs H2bΔIEC intestinal organoids. STRING-based network analysis of top 50 down-regulated genes in H2b/p53ΔIEC vs H2bΔIEC. (E) Genes not being connected to the central p53 hub were manually removed. (F) Transcript levels in small intestinal epithelial crypts from 20-week-old H2bfl/fl (n = 8; 5 male and 3 female), H2bΔIEC (n = 5; 2 male and 3 female), and H2b/p53ΔIEC (n = 9; 4 male and 5 female) mice were measured by quantitative polymerase chain reaction. (G, H) Anti-Olfm4 and (I, J) anti-Ki67 immunohistochemical assessments in small intestinal sections. (G–J) A minimum of 100 crypts per intestine were assessed (n = 5 per genotype). Significance was determined using nonparametric Mann-Whitney U-test and expressed as mean ± standard error of the mean. *P < .05; **P < .01; ***P < .001.
Figure 5
Figure 5
Spontaneous intestinal tumor development in H2b/p53ΔIEC mice. (A) Survival curve for H2b/p53ΔIEC (n = 17; 9 male and 6 female), H2b/p53fl/fl (n = 13; 7 male and 6 female), and H2bΔIEC (n = 9; 3 male and 6 female) mice. (B) Total number of tumors per small intestine, (C) average tumor size in small intestinal tumors and (D) representative image of a H2b/p53ΔIEC small intestine bearing a total of 3 tumors (arrows). (E) Histologic grading of intestinal mucosa with or without tumors. (F) Representative image of a dysplasia or low-grade carcinoma in small intestine from H2b/p53ΔIEC mice. (G) Venn diagram of DEGs from small intestinal tissues derived from H2b/p53ΔIEC tumors (DKO T; n = 4; 3 male and 1 female) or adjacent nontumor tissue from the same mice (DKO nT, n = 4; 3 male and 1 female) or H2b/p53fl/fl (WT, n = 4; 2 male and 2 female). Total number of DEGs (left) and number of up- and down-regulated genes (right) are displayed. (H) STRING-based network analysis of top 100 up-regulated genes in tumor vs nontumor intestinal tissue from H2b/p53ΔIEC mice. Manual coloring was used to highlight genes involved in extracellular matrix degradation (orange), cellular differentiation (red), and Wnt signaling (blue). (I) Quantitative polymerase chain reaction of Wnt target genes (relative to adjacent nontumor small intestinal tissue, n = 8). Data are expressed as mean ± standard error of the mean and significance was determined using log-rank Mantel Cox test (A) or nonparametric Mann-Whitney U-test. *P < .05; **P < .01; ***P < .001. DEG, differentially expressed gene; DKO, double knockout; KO, knockout; NT, nontumor; T, tumor; WT, wild type.
Figure 6
Figure 6
A mutational signature associated with genomic ribonucleotides. Ribonucleotide content of genomic intestinal DNA was assessed by alkaline hydrolysis and subsequent electrophoresis of fragmented DNA. Increased DNA fragmentation indicated a higher genomic ribonucleotide load. (A) Gel image shows intestinal DNA samples from individual mice (n = 3–4). (B) Quantification of fragment count per nucleotide length based on electrophoresis gel shown in A. Graph shows comparison of H2b/p53ΔIEC tumor with H2b/p53fl/fl control DNA. (C) Relative contribution of mutational signatures described in the COSMIC database to individual tumor and H2b/p53ΔIEC nontumor signatures. Note the high contribution of signature 3 to all H2b/p53ΔIEC mutational signatures, which is independent of tumor status. A distinct T>G substitution at GpTpG trinucleotides is marked (asterisk). (D) Average mutational signatures extracted from tumor and H2b/p53ΔIEC nontumor intestinal DNA exhibit a striking degree of similarity.
Figure 7
Figure 7
Functional characterization of somatic RNase H2 cancer variants and RNase H2 expression in human colorectal tumors. Thermal stability of mutant RNase H2 complexes vs WT (represented as ΔTm; negative values represent a less stable complex). (A) Mean ΔTm ± standard error of the mean displayed for 6 technical replicates. (B) Representative graphs of thermostability of WT and V133M mutant. Decreased enzymatic activity of somatic RNase H2 cancer variants toward a DNA duplex containing a single ribonucleotide (DRD:DNA) or RNA–DNA hybrid (RNA:DNA). (C) Initial activity measured at RNase H2 15.6 pmol/L and substrate 250 μmol/L, with mean ± standard error of the mean displayed for 3 independent experiments. (D) Relative expression of RNASEH2A in paired tumor and adjacent normal tissue from patients with CRC (n = 155). Kaplan-Meier Plots for high vs low RNASEH2A expression in 467 patients with colorectal adenocarcinoma, retrieved from the TCGA COADREAD cohort. (E) Low expression levels of RNASEH2A were correlated with poor overall survival (P = .004). Data are expressed as mean ± standard error of the mean and significance was determined using 2-sided t-test (A, C), nonparametric Mann-Whitney U-test (D), or log-rank Mantel Cox Test (E). *P < .05; **P < .01; ***P < .001. NT, nontumor; TU, tumor; WT, wild type.
Supplementary Figure 1
Generation of mice and genotype validation. (A) Generation and genotyping of H2bΔIEC and H2bfl/fl (control) mice. (B) Strongly decreased RNase H2A protein levels in western blot from isolated IECs from H2bΔIEC mice. (C) Immunohistochemistry of small intestine showing lack of RNase H2A, indicating complete RNase H2 complex destruction specifically in the intestinal epithelium of H2bΔIEC mice. Small intestines from H2bfl/fl (n = 6; 4 male and 2 female) and H2bΔIEC (n = 5; 3 male and 2 female) mice display no overt differences in epithelial differentiation markers (D, E) Lysozyme or (F, G) PAS. (H) Body weight, (I) small intestinal length, and (J) colon length in 8- to 12-week-old H2bΔIEC (n = 5; 3 male and 2 female) and H2bfl/fl control (n = 6; 4 male and 2 female) mice. (K) Body weight, (L) small intestinal length, and (M) colon length in 52-week-old H2bΔIEC (n = 10; 6 male and 4 female) and H2bfl/fl control (n = 6; 3 male and 3 female) mice. (N) Normalized end density per million base pairs of small intestinal samples from 8- to 12-week-old (young) or 52-week-old H2bΔIEC and H2bfl/fl mice. (E, G) A minimum of 100 crypts per intestine were assessed for H2bΔIEC (n = 5; 3 male and 2 female) and H2bfl/fl control (n = 6; 4 male and 2 female) mice. Data are expressed as mean ± standard error of the mean and significance was determined using nonparametric Mann-Whitney U-test. *P < .05; ***P < .001. PAS, periodic acid–Schiff.
Supplementary Figure 2
Colon phenotype of aged mice. (A) Representative images and (B) histologic analysis of H&E sections from small intestine show moderate intestinal inflammation in H2bΔIEC mice. Histologic evaluation and representative images of (C, D) CD3+ and (E, F) IBA1+ cells in the colonic lamina propria of 52-week-old H2bΔIEC and H2bfl/fl mice. Epithelial proliferation in the colon was significantly decreased in aged H2bΔIEC mice compared with H2bfl/fl control littermates, as evidenced by (G, H) anti-BrdU and (I, J) anti-Ki67 staining. Note the lack of cellular proliferation in the intestinal stem cell niche located at the crypt base (arrows). Increased apoptosis and DNA damage in small intestines of H2bΔIEC mice shown by (K, L) TUNEL and (M, N) γH2AX staining. (B) Small intestinal Swiss rolls, (C, E) a minimum of 5 individual high-power fields, and (G, I, K, M) a minimum of 100 crypts per intestine were assessed in 52-week-old H2bΔIEC (n = 10; 6 male and 4 female) and H2bfl/fl control mice (n = 6; 3 male and 3 female) mice. Data are expressed as mean ± standard error of the mean and significance was determined using nonparametric Mann-Whitney U-test. *P < .05; **P < .01; ***P < .001. BrdU, bromodeoxyuridine; H&E, hematoxylin and eosin; TUNEL, terminal deoxynucleotidyl transferase deoxyuridine triphosphate nick end labeling.
Supplementary Figure 3
Chronic colitis in H2bfl/fl and H2bΔIEC mice. (A) Weight loss curve of RnaseH2bfl/fl (n = 8; 4 male and 4 female) and RnaseH2bΔIEC (n = 9; 5 male and 4 female) mice. (B) Representative images of colon Swiss rolls stained with H&E and (C) corresponding histologic assessment. Representative images and histologic evaluation of (D, E) Ki67- and (F, G) TUNEL-positive cells in colon crypts (≥100 crypts per intestine). (H) Postmortal colon length (n = 8 of 9) of H2bfl/fl and H2bΔIEC mice. (C) Small intestinal Swiss rolls and (E, G) a minimum of 100 crypts per intestine were assessed in H2bΔIEC (n = 8; 5 male and 3 female) and H2bfl/fl control (n = 9; 4 male and 5 female) mice. Significance was determined using 2-tailed Student t-test and expressed as mean ± standard error of the mean *P < .05; **P < .01; ***P < .001. H&E, hematoxylin and eosin; TUNEL, terminal deoxynucleotidyl transferase deoxyuridine triphosphate nick end labeling.
Supplementary Figure 4
RNA sequencing of isolated IECs. (A) Heatmap showing clustering of top 100 differentially expressed genes in isolated IECs from H2bfl/fl (n = 4; 2 male and 2 female) and H2bΔIEC (n = 4; 2 male and 2 female) mice. (B) Gene Ontology term analysis of differentially up- and down-regulated genes between H2bfl/fl (n = 4) and H2bΔIEC (n = 4). (C) Western blot from isolated IECs from aged H2bfl/fl (n = 5) and eH2bΔIEC (n = 5) mice probed against anti-p53 antibody. (D) Representative images and (E) statistical evaluation of p53+ cells per crypt. (E) A minimum of 100 crypts per intestine were assessed in 52-week-old H2bΔIEC (n = 5; 3 male and 2 female) and H2bfl/fl control (n = 6; 3 male and 3 female) mice. Significance was determined using 2-tailed Student t-test and expressed as mean ± standard error of the mean. **P < .01.
Supplementary Figure 5
Phenotyping of H2bΔTam organoids. Administration of a low dose of 4-OHT (100 nmol/L) for 3 days resulted in increased cell death and induction of apoptosis and induction of canonical p53 target genes in primary intestinal organoids derived from H2bfl/fl mice bearing a ubiquitous Cre recombinase (CreERT). (A) Representative images of intestinal organoids 3 days after 4-OHT treatment (white bars, 100 μm; black arrow, dying organoid). Representative (B) fluorescence-activated cell sorter plots and (C) statistical analysis of GeoMean intensity of annexin V and fluorescein isothiocyanate staining. (D) Gene expression of intestinal organoids 3 days after 4-OHT assessing Rnaseh2b, Ccng1, Sesn2, Mdm2 by quantitative polymerase chain reaction. Significance was determined using Student t-test and expressed as mean ± standard error of the mean. **P < .01. 4-OHT, 4-hydroxytamoxifen; 7-AAD, 7-aminoactinomycin D.
Supplementary Figure 6
Phenotyping of H2bΔTam MEF. Administration of a low dose of 4-OHT (100 nmol/L) for 3 days resulted in abrogation of RNASEH2B protein expression in primary MEFs derived from H2bfl/fl embryos bearing a ubiquitous Cre recombinase (CreERT). H2bfl/fl MEFs without CreERT were used as control cells. For conciseness, 4-OHT–treated H2bfl/fl plus CreERT MEFs are termed H2bΔTam MEFs. Rnaseh2b/p53 double-knockout MEFs served as a negative control. The RNase H2 holoenzyme was detected by western blotting in proliferating (3 days after 4-OHT) and senescent (10 days after 4-OHT) MEFs using a specific rabbit antiserum raised against the whole murine enzyme complex. (A) Actin as loading control. H2bΔTam MEFs at 10 days after 4-OHT ceased proliferation. Proliferation was assessed by measuring 5-ethynyl-2′-deoxyuridine incorporation into replicating DNA using flow cytometry. (B) Percentage of cells in S-phase after a 4-hour 5-ethynyl-2′-deoxyuridine pulse is depicted. Error bars represent standard error of the mean; ***P < .001 by t-test (n = 5). (C) H2bΔTam MEFs at 17 days after 4-OHT stained positive for senescence-associated β-galactosidase. Cells also showed an altered morphology with an enlarged and flattened appearance (scale bar, 200 μmol/L). H2bΔTam MEFs in prolonged culture exhibited increased expression of senescence-associated genes p19, Cdkn1a (p21), and Igfbp5. (D) Transcript levels were gauged by quantitative polymerase chain reaction (p19 10 days and Igfbp5 and Cdkn1a 17 days after 4-OHT). Error bars represent standard error of the mean. ***P < .001; **P < .01 by 2-way analysis of variance (n = 3–4). Senescent H2bΔTam MEFs displayed a senescence-associated secretory phenotype and secreted the proinflammatory cytokines IL-6 and CXCL1 (KC). (E) MEF supernatant 10 and 17 days after 4-OHT was harvested for 24 hours and cytokine levels were analyzed by enzyme-linked immunosorbent assay. Note that secreted cytokine levels tended to increase over time. Error bars represent standard error of the mean. ***P < .001 by 2-way analysis of variance (n = 3). (F) Increased expression of p21 protein in H2bΔTam MEFs 3 days after Cre induction by a low dose of 4-OHT (100 nmol/L). Doxorubicin treatment at a concentration of 1 μmol/L for 24 hours was used as a positive control. (G) Deletion of Rnaseh2b does not induce apoptosis in primary MEFs. Administration of 4-OHT 100 nmol/L for the indicated time points does not lead to increased cell death, as assessed by western blot analysis of cleaved PARP-1 (full length, 116 kDa; cleaved, 89 kDa) and caspase 3. Apoptosis in control cells was induced by doxorubicin at 25 μmol/L for 24 hours. 4-OHT, 4-hydroxytamoxifen; β-gal, β-galactosidase; cl., cleaved; CXCL1, chemokine (C-X-C motif) ligand 1; Doxo, doxorubicin; fu., full length; IL-6, interleukin-6; PARP, poly(adenosine diphosphatase ribose)polymerase; prolif., proliferating; sen., senescent.
Supplementary Figure 7
Phenotyping of 35-week-old colon intestinal organoids. Statistical evaluation and representative images of colon organoids were derived from 35-week-old H2b/p53fl/fl, H2bΔIEC, or H2b/p53ΔIEC mice. Statistical evaluation and representative images of obtained colon organoid colonies at day 4 after passaging and seeding in the (A, B) absence or (C, D) presence of the anoikis inhibitor Y-27632. Significance was determined using nonparametric Mann-Whitney U-test and expressed as mean ± standard error of the mean. **P < .01; ***P < .001.
Supplementary Figure 8
Phenotyping of 20-week-old H2b/p53ΔIEC mice. Immunohistochemistry of (A, B) γH2AX and (C, D) TUNEL staining in the small intestine shows restoration of background (H2b/p53fl/fl) apoptosis levels in H2b/p53ΔIEC double-knockout mice, albeit with a similar degree of DNA damage. (A, C) A minimum of 100 crypts per intestine were assessed in 20-week-old H2bfl/fl (n = 8; 5 male and 3 female), H2bΔIEC (n = 5; 2 male and 3 female), and H2b/p53ΔIEC (n = 9; 4 male and 5 female) mice. Significance was determined using nonparametric Mann-Whitney U-test and expressed as mean ± standard error of the mean. ***P < .001. TUNEL, terminal deoxynucleotidyl transferase deoxyuridine triphosphate nick end labeling.
Supplementary Figure 9
RNA sequencing of intestinal tumor and nontumor tissue from H2b/p53ΔIEC mice. (A) Representative image of small intestinal tumors in H2b/p53ΔIEC, but not in H2b/p53fl/fl or H2bΔIEC, mice. RNA sequencing was performed from the RNA of small intestinal sections of H2b/p53fl/fl (n = 4, 3 female and 1 male) and paired tumor and nontumor sections of H2b/p53ΔIEC (n = 4; 2 male and 2 female) mice. (B) Overview of selected signaling pathways (Gene Ontology terms and KEGG pathways) enriched in H2b/p53ΔIEC tumors compared with adjacent nontumor tissue. (C) Heatmap of the top 100 differentially expressed genes, ranked according to adjusted P value. Representative immunohistochemical staining of small intestinal tissue stained against (D) TCF-4 and (E) SOX9. Images indicate increased nuclear translocation (TCF-4) or overall expression (SOX9) in tumors from H2b/p53ΔIEC mice. DKO, double knockout; DKO_NT, double-knockout nontumor; DKO_T, double-knockout tumor; H&E, hematoxylin and eosin.
Supplementary Figure 10
Alkali hydrolysis of intestinal samples. Quantification of fragment count per nucleotide length based on electrophoresis gel shown in Figure 6A. Graphs show the comparison of (A) H2bΔIEC vs H2b/p53fl/fl control DNA with (B) H2b/p53ΔIEC nontumor vs H2b/p53fl/fl. (C) End density per million base pairs of small intestinal samples from young H2b/p53ΔIEC or aged H2b/p53ΔIEC mice (tumor vs adjacent normal), normalized to control DNA from H2b/p53fl/fl.
Supplementary Figure 11
Mutational signature in intestinal tumor and nontumor tissue from H2b/p53ΔIEC mice. The figure shows the contribution of each SNV type including the base context to the somatic mutational signature of each sample. Base context is magnified and shown for C>A conversion, but applies to all depicted nucleotide SNVs. nT, nontumor; T, tumor.
Supplementary Figure 12
Gene expression and InDel count. Multidimensional scaling plots based on (A) InDels, (B) SNVs, or (C) RNA sequencing data. Network analysis integrating somatic (E) SNV or (F) InDels with genes differentially expressed between tumor and nontumor H2b/p53ΔIEC epithelium samples. Note that most dysregulated genes are clustered in the center, whereas most genes affected by an InDel or an SNV are localized to the periphery, with little connectivity between the 2 datasets. (E, F) For better readability, exclusively dysregulated genes having more than 200 connected dysregulated genes or a cancer proliferation indices sum of connected genes higher than 60 are displayed. (G) Network-based analysis of the difference between dysregulated and mutated genes. As input, all significantly dysregulated genes (tumor vs nontumor; P < .001) and all genes affected by a somatic SNV or a somatic InDel were considered. As shown in the boxplot, dysregulated genes were characterized by a larger number of connections than mutated genes (P = .023 for dysregulated vs InDel; P = .152 for dysregulated vs SNV; P = .011 for dysregulated vs SNV + InDel). NT, nontumor; T, tumor; WT, wild type.
Supplementary Figure 13
InDel count. The figure displays the number of InDels for each InDel length subdivided into sample type groups. Negative InDel lengths indicate deletions, and positive values describe insertions.
Supplementary Figure 14
In silico validation in COADREAD cohort. RNASEH2A expression in primary tumor (n = 380) or normal solid tissue (n = 51) based on normalized read counts from RNA sequencing (Illumina HiSeq). Data were retrieved from the COADREAD cohort of the TCGA and made publically available (www.xenabrowser.net). Significance was determined using Mann-Whitney test. ***P < .001.

References

    1. Arnold M., Sierra M.S., Laversanne M. Global patterns and trends in colorectal cancer incidence and mortality. Gut. 2017;66:683–691. - PubMed
    1. Ferlay J., Soerjomataram I., Dikshit R. Cancer incidence and mortality worldwide: sources, methods and major patterns in GLOBOCAN 2012. Int J Cancer. 2015;136:E359–E386. - PubMed
    1. Melo FdSe, Kurtova A.V., Harnoss J.M. A distinct role for Lgr5+ stem cells in primary and metastatic colon cancer. Nature. 2017;543:676–680. - PubMed
    1. Tomasetti C., Durrett R., Kimmel M. Role of stem-cell divisions in cancer risk. Nature. 2017;548:E13. - PubMed
    1. Tomasetti C., Li L., Vogelstein B. Stem cell divisions, somatic mutations, cancer etiology, and cancer prevention. Science. 2017;355:1330–1334. - PMC - PubMed

Supplementary References

    1. Bartsch K., Knittler K., Borowski C. Absence of RNase H2 triggers generation of immunogenic micronuclei removed by autophagy. Hum Mol Genet. 2017;26:3960–3972. - PubMed
    1. Reijns M.A., Rabe B., Rigby R.E. Enzymatic removal of ribonucleotides from DNA is essential for mammalian genome integrity and development. Cell. 2012;149:1008–1022. - PMC - PubMed
    1. Sato T., Vries R.G., Snippert H.J. Single Lgr5 stem cells build crypt–villus structures in vitro without a mesenchymal niche. Nature. 2009;459:262–265. - PubMed
    1. Martin M. Cutadapt removes adapter sequences from high-throughput sequencing reads. EMBnet.journal. 2011;17
    1. Trapnell C., Roberts A., Goff L. Differential gene and transcript expression analysis of RNA-seq experiments with TopHat and Cufflinks. Nat Protoc. 2012;7:562–578. - PMC - PubMed

Publication types

MeSH terms