. 2018 Dec;8(12):1632-1653.
doi: 10.1158/2159-8290.CD-18-0657. Epub 2018 Oct 1.

TET2 Deficiency Causes Germinal Center Hyperplasia, Impairs Plasma Cell Differentiation, and Promotes B-cell Lymphomagenesis

Affiliations

TET2 Deficiency Causes Germinal Center Hyperplasia, Impairs Plasma Cell Differentiation, and Promotes B-cell Lymphomagenesis

Pilar M Dominguez et al. Cancer Discov. 2018 Dec.

Abstract

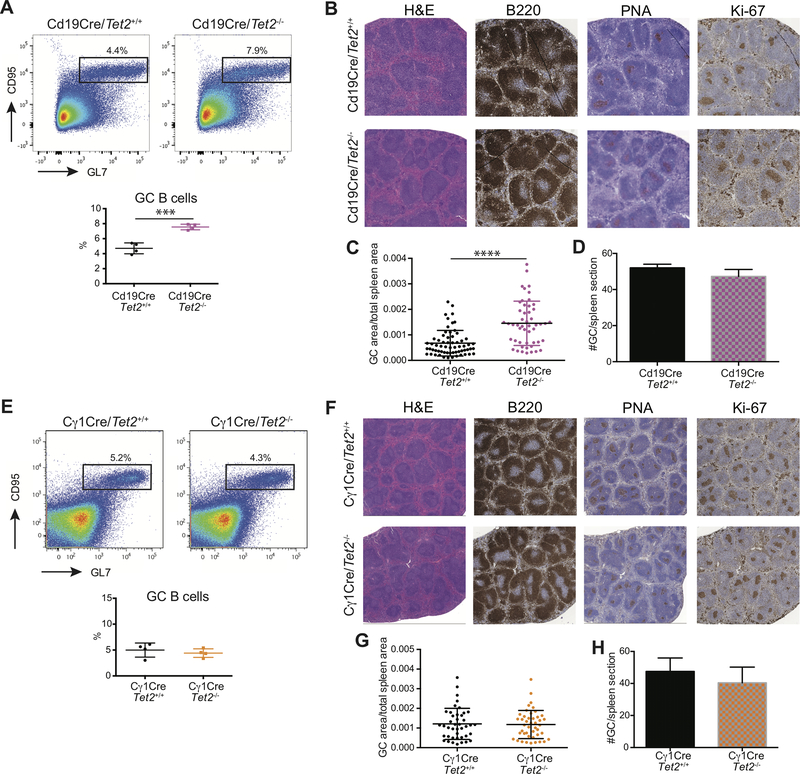
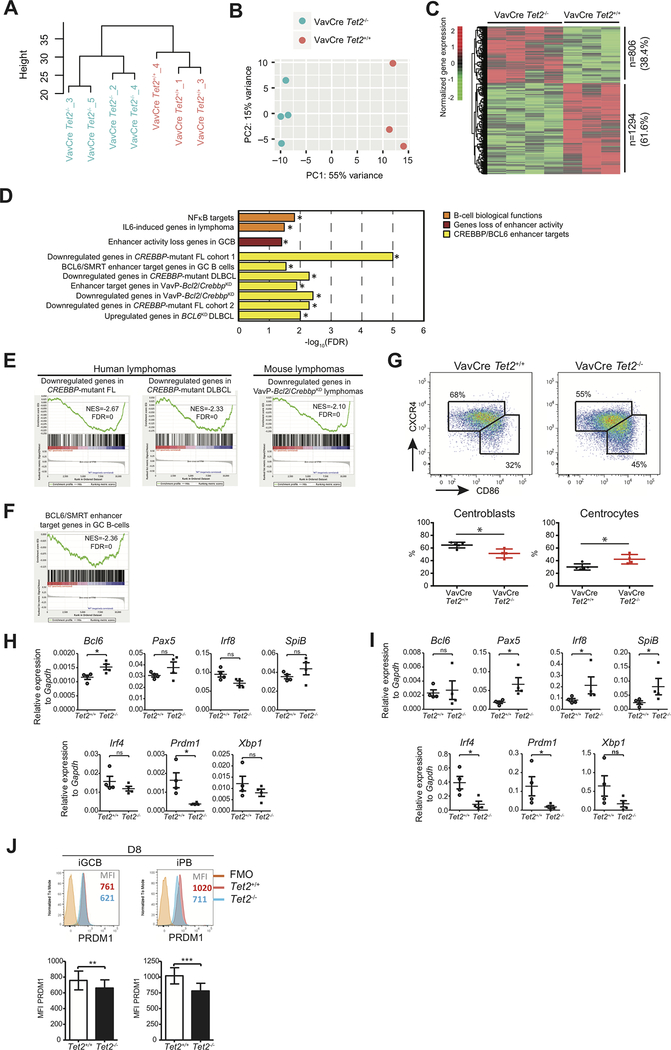
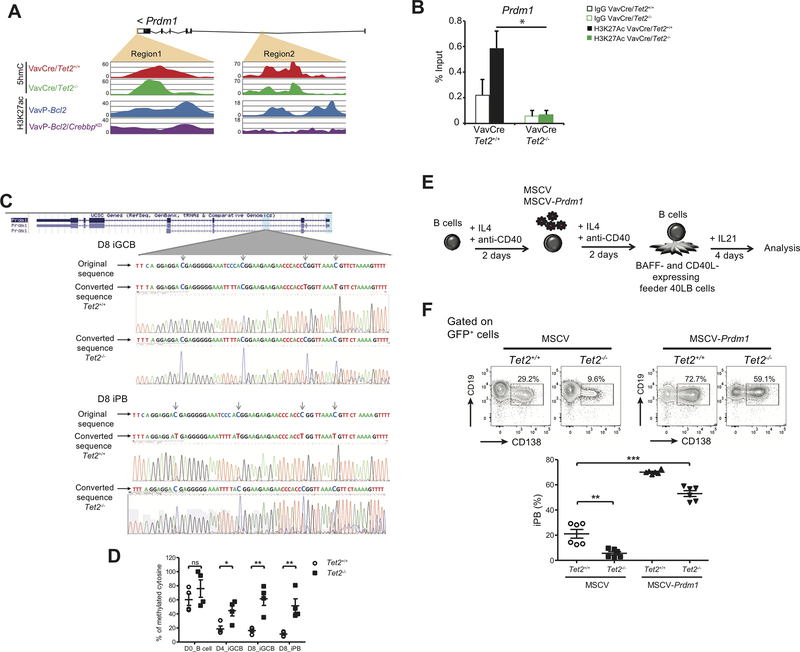
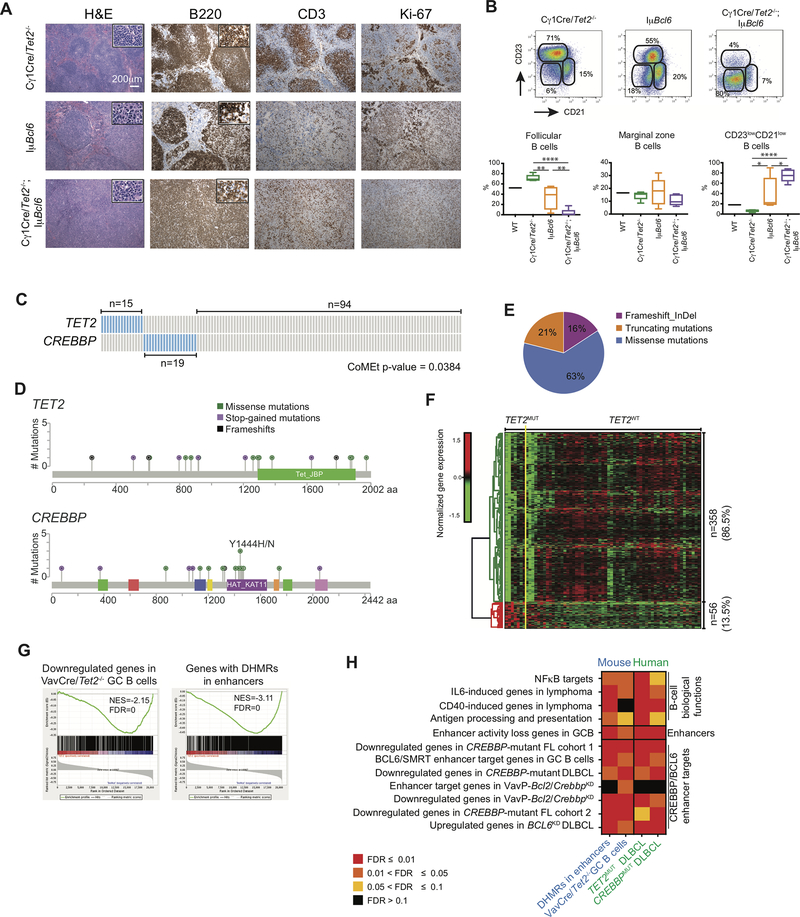
TET2 somatic mutations occur in ∼10% of diffuse large B-cell lymphomas (DLBCL) but are of unknown significance. Herein, we show that TET2 is required for the humoral immune response and is a DLBCL tumor suppressor. TET2 loss of function disrupts transit of B cells through germinal centers (GC), causing GC hyperplasia, impaired class switch recombination, blockade of plasma cell differentiation, and a preneoplastic phenotype. TET2 loss was linked to focal loss of enhancer hydroxymethylation and transcriptional repression of genes that mediate GC exit, such as PRDM1. Notably, these enhancers and genes are also repressed in CREBBP-mutant DLBCLs. Accordingly, TET2 mutation in patients yields a CREBBP-mutant gene-expression signature, CREBBP and TET2 mutations are generally mutually exclusive, and hydroxymethylation loss caused by TET2 deficiency impairs enhancer H3K27 acetylation. Hence, TET2 plays a critical role in the GC reaction, and its loss of function results in lymphomagenesis through failure to activate genes linked to GC exit signals. SIGNIFICANCE: We show that TET2 is required for exit of the GC, B-cell differentiation, and is a tumor suppressor for mature B cells. Loss of TET2 phenocopies CREBBP somatic mutation. These results advocate for sequencing TET2 in patients with lymphoma and for the testing of epigenetic therapies to treat these tumors.See related commentary by Shingleton and Dave, p. 1515.This article is highlighted in the In This Issue feature, p. 1494.


Conflict of interest statement

Disclosure of Potential Conflict of Interest

A. Melnick reports receiving research support from Janssen. R. Levine is in the supervisory board of Qiagen, SAB for Loxo, C4 therapeutics and Isoplexis; and he is a consultant and receives research support from Roche and Celgene. No potential conflicts of interest were disclosed by the other authors.

Figures

Figure 1.
Figure 1.. Tet2 deletion in hematopoietic cells induces GC hyperplasia.
A, Representative flow cytometry plot and quantification of (B220+CD95+GL7+) GC B-cells from Vav-Cre/Tet2+/+ (n=5) and Vav-Cre/Tet2−/− (n=5) mice at day 10 after immunization with SRBC. B, Quantification of flow cytometry data corresponding to total B cells (B220+), mature B cells (B220+IgD+IgM+), transitional B cells (B220+IgDintIgM+), follicular B cells (B220+CD23+CD21+), marginal zone B cells (B220+CD23lowCD21+) and plasmablasts/PC (CD138+) in the spleens of Vav-Cre/Tet2+/+ and Vav-Cre/Tet2−/− mice. C, Representative histologic sections of formalin-fixed, paraffin-embedded spleens from Vav-Cre/Tet2+/+ and Vav-Cre/Tet2−/− mice. Sections were stained with H&E and antibodies specific for B220, PNA and Ki-67. D, E, Quantification of GC area (D) and number of GCs (E) in the spleens of Vav-Cre/Tet2+/+ and Vav-Cre/Tet2−/− mice. two-tailed t test, ***p<0.001 ****p<0.0001.
Figure 2.
Figure 2.. GC hyperplasia induced by Tet2 loss of function is B-cell autonomous.
A, Representative flow cytometry plot and quantification of (B220+CD95+GL7+) GC B-cells from Cd19-Cre/Tet2+/+ (n=4) and Cd19-Cre/Tet2−/− (n=4) mice at day 10 after immunization with SRBC. B, Representative histologic sections of formalin-fixed, paraffin-embedded spleens from Cd19-Cre/Tet2+/+ and Cd19-Cre/Tet2−/− mice. Sections were stained with H&E and antibodies specific for B220, PNA and Ki-67. C, D, Quantification of GC area (C) and number of GCs (D) in the spleens of Cd19-Cre/Tet2+/+ and Cd19-Cre/Tet2−/− mice. E, Representative flow cytometry plot and quantification of (B220+CD95+GL7+) GC B-cells from Cγ1-Cre/Tet2+/+ (n=5) and Cγ1-Cre/Tet2−/− (n=5) mice at day 10 after immunization with SRBC. F, Representative histologic sections of formalin-fixed, paraffin-embedded spleens from Cγ1-Cre/Tet2+/+ and Cγ1-Cre/Tet2−/− mice. Sections were stained with H&E and antibodies specific for B220, PNA and Ki-67. G, H, Quantification of GC area (G) and number of GCs (H) in the spleens of Cγ1-Cre/Tet2+/+ and Cγ1-Cre/Tet2−/− mice. two-tailed t test, ***p<0.001 ****p<0.0001.
Figure 3.
Figure 3.. Tet2 loss of function impairs affinity maturation and PC differentiation in a B-cell autonomous manner.
A, Schematic diagram of the protocol of primary and secondary immunizations. B, Thirty five days after immunization (fourteen days after boost), NP-specific antibodies (IgG1 and Igλ) were measured in the sera of Vav-Cre/Tet2+/+ and Vav-Cre/Tet2−/− mice by ELISA. C, NP7/NP26 ratio of NP-specific antibodies detected in B. D, E, Sixty days after immunization (forty days after boost), NP-specific IgG1 (D) and IgM (E) secreting cells from the bone marrow of Vav-Cre/Tet2+/+ and Vav-Cre/Tet2−/− mice were quantified by ELISPOT. two-tailed t test, *p<0.05 **p<0.01 ***p<0.001. F, Splenic PC formation after SRBC immunization of Tet2+/+ and Tet2−/− mice; shown as FACS profiles (left) and quantitation (right) on day 32; each symbol represents one mouse. G, Schematic illustration of the in vitro GC B-cells (iGCB) and PB (iPB) culture system. H, Number of live Tet2+/+ and Tet2−/− B cells cultured on 40LB with IL4 on D4 and IL21 on D8. I, J, Flow cytometry plots of iGCB cells on D4 (I) and D8 (J); the gated area shows the live iGCB cells (CD19+GL7+FAS+). Histograms represent the percentage (upper) and the cell number (lower) of iGCB cells. K, L, Flow cytometry plots of iPB cells on D4 (K) and D8 (L); the gated area shows the live iPB cells (CD19+GL7+FAS+). Histograms represent the percentage (upper) and the cell number (lower) of iPB cells. For D4 symbols represent triplicate of 5 independent experiments. For D8 symbols represent triplicate of 4 independent experiments. All p values were calculated using unpaired Student’s t-test, *p < 0.05, **p < 0.005, ***p < 0.0005 in all experiments.
Figure 4.
Figure 4.. Tet2-deficient GC B cells exhibit repression of genes involved in GC exit.
A, B, Hierarchical clustering (A) and principal component analysis (B) of RNAseq data of Vav-Cre/Tet2+/+ (n=3) and Vav-Cre/Tet2−/− (n=4) GC B cells. C, Normalized gene expression levels of 2100 differentially expressed genes between Vav-Cre/Tet2+/+ and Vav-Cre/Tet2−/− GC B cells. Expression levels were scaled by row. D, Minus log 10 of the FDR scores for the enrichment of 10 gene sets involved in the exit of GC B-cells from the GC. FDR scores were obtained using Gene Set Enrichment Analysis (GSEA) as described in the methods section. E, F GSEA enrichment plots showing correlation of different genesets with ranked expression change between Vav-Cre/Tet2+/+ and Vav-Cre/Tet2−/− GC B cells. NES, normalized enrichment score; FDR, false discovery rate. G, Representative flow cytometry plot and quantification of centroblasts (CXCR4highCD86high) and centrocytes (CXCR4lowCD86low) in the GC of Vav-Cre/Tet2+/+ (n=5) and Vav-Cre/Tet2−/− (n=5) mice at day 10 after immunization with SRBC. H, Expression of Bcl6, Pax5, Irf8, SpiB, Irf4, Prdm1 and Xbp1 by iGCB cells on D8, as measured by quantitative RT-PCR (n=4). I, Expression of Bcl6, Pax5, Irf8, SpiB, Irf4, Prdm1 and Xbp1 by iPB on D8, as measured by quantitative RT-PCR (n=4). J, Representative PRDM1 intracellular staining profile of iGCB (CD19+CD138) and iPB (CD19+CD138+) at D8. Numbers indicate the median fluorescence intensity (MFI) of PRDM1. All p values were calculated using unpaired Student’s t test, *p < 0.05 and ns: not significant, in all experiments.
Figure 5.
Figure 5.. TET2 deficiency results in reduction of enhancer cytosine hydroxymethylation and histone acetylation.
A, Genomic distribution of 5hmC peaks in GC B-cells from Vav-Cre/Tet2+/+ and Vav-Cre/Tet2−/− mice. B, Overlap of 5hmC peaks with enhancers in Vav-Cre/Tet2+/+ GC B-cells. C, D, Number (C) and genomic distribution (D) of DHMR between Vav-Cre/Tet2+/+ and Vav-Cre/Tet2−/− GC B-cells. E, Heatmap of the 5hmC enrichment in all DHMR overlapping with distal enhancers in Vav-Cre/Tet2+/+ and Vav-Cre/Tet2−/− GC B-cells. Region spans 1 kbp up and down from the DHMR’ peak center. Heatmap was generated using deeptools (73). F, Minus log 10 of the FDR scores for the enrichment of 11 gene sets involved in the exit of GC B-cells from the GC. FDR scores were obtained using hypergeometric test for a total of 1825 genes with enhancers overlapping with DHMR. G, Correlation of differential hydroxymethylation in distal enhancers and differential gene expression between Vav-Cre/Tet2+/+ and Vav-Cre/Tet2−/− GC B-cells. H, GSEA enrichment plots showing correlation of genes associated with peaks losing 5hmC and H3K27ac signals. I, Normalized gene expression level of 253 leading edge genes associated with peaks losing 5hmC and H3K27ac signals in Vav-Cre/Tet2−/− and VavP-CrebbpKD B cells, respectively. J, Aggregation plots of 5hmC and H3K27ac enrichment in peaks losing both signals, associated with 253 genes shown in figure 5I.
Figure 6.
Figure 6.. Aberrant repression of Prdm1 contributes to the phenotype of TET2-deficient B cells.
A, Read-density tracks of H3K27ac histone modification as well as 5hmC levels in Prdm1 locus in Vav-Cre/Tet2−/−, Vav-Cre/Tet2+/+, VavP-Bcl2 and VavP-Bcl2/CrebbpKD B-cells. Areas marked in orange indicate regions losing 5hmC and H3K27ac signals. B, H3K27Ac enrichment in region 1 shown in A. C, (Top) Prdm1 DNA methylation status in iGCB cells on D8. Shown are DNA original sequence (upper line), representative bisulfite-converted DNA sequence of Tet2+/+ iGCB cells (middle line), and representative bisulfite-converted DNA sequence of Tet2−/− iGCB cells (lower line). The experiment was performed with 3 biological replicates. (Bottom) Prdm1 DNA methylation status in iPB on D8. Shown are DNA original sequence (upper line), representative bisulfite-converted DNA sequence of Tet2+/+ iPB (middle line), and representative bisulfite-converted DNA sequence of Tet2−/− iPB (lower line). The experiment was performed with 2 biological replicates. D, Quantification of DNA methylation by Methylation-sensitive restriction enzyme qPCR. Differentially methylated region represented as the percentage of methylated cytosine in Prdm1 gene were validated in Day0 (D0, naïve) B cells, day4 (D4) iGCB cells, day8 (D8) iGCB cells and day8 (D8) iPB cells (n=4). E, Schematic illustration of the ectopic expression of PRDM1 in B cells. Briefly, IL4 and anti-CD40 treated naïve B cells for 2 days and were infected with a retrovirus expressing GFP or PRDM1-GFP. After 2 more days of culture with IL4 and anti-CD40, cells were harvested and cultured in the presence of 40LB feeder cells and IL21 for 4 days. F, GFP-positive cells were analyzed for CD19 and CD138 expression. Representative plots of FACS analysis of the in vitro induced CD19+CD138+ population. Histograms represent the percentage of iPB (CD19+CD138+); symbols represent triplicate of 2 independent experiments.
Figure 7.
Figure 7.. TET2 mutations in human DLBCLs manifest the Tet2-deficient GC gene signature, and similarities to CREBBP mutant cases.
A, Representative histologic sections of formalin-fixed, paraffin-embedded spleens from Cγ1Cre/Tet2−/−;IμBcl6, Cγ1Cre/Tet2−/− and IμBcl6 mice. Sections were stained with H&E and antibodies specific for B220, CD3 and Ki-67. B, Representative flow cytometry plot and quantification of CD23+CD21+ (follicular B cells), CD23CD21+ (marginal zone B cells) and CD23CD21 B cells in the spleens of Cγ1Cre/Tet2−/−;IμBcl6, Cγ1Cre/Tet2−/− and IμBcl6 mice; two-tailed t test, *p < 0.05 **p < 0.01 ****p < 0.0001. C, Mutation matrix for TET2 and CREBBP mutations in a cohort of 128 DLBCL. Blue color indicates any type of mutation while grey indicate no known mutations of the gene. Each of the 128 columns indicates one patient sample. Mutual exclusivity on TET2 and CREBBP mutations was computed using CoMEt. D, Lolliplot of the TET2 and CREBBP mutations, plotted using MutationMapper (74,75). E, Distribution of insertions/deletions and mutations among TET2 mutant DLBCL. F, Normalized gene expression levels of 414 differentially expressed genes between TET2 mutant (TET2MUT) and non-mutant (TET2WT) DLBCL. TET2MUT indicate 7 samples with either stop-codon of frameshift mutation, while TET2WT indicate 60 samples without any kind of mutation in TET2 or CREBBP genes. Expression levels were scaled by row. G, GSEA enrichment plots showing correlation of different genesets with ranked expression change between TET2MUT and TET2WT DLBCL. NES, normalized enrichment score; FDR, false discovery rate. H, Heatmap of the FDR scores for the enrichment of 12 gene sets involved in the exit of GC B-cells from the GC. FDR scores were obtained using hypergeometric test for mouse genes with enhancers overlapping DHMR, described as “DHMR in enhancers” and shown previously Fig. 6F. Column described as “Vav-Cre/Tet2−/− GC B cells” presents the FDR scores obtained using GSEA, also shown on Fig. 5D. Columns “TET2MUT DLBCL” and “CREBBPMUT DLBCL” indicate GSEA-based FDR scores of the enrichment of the gene sets in DLBCL.

Comment in

References

    1. Coiffier B, Thieblemont C, Van Den Neste E, Lepeu G, Plantier I, Castaigne S, et al. Long-term outcome of patients in the LNH-98.5 trial, the first randomized study comparing rituximab-CHOP to standard CHOP chemotherapy in DLBCL patients: a study by the Groupe d’Etudes des Lymphomes de l’Adulte. Blood 2010;116(12):2040–5 doi 10.1182/blood-2010-03-276246. - DOI - PMC - PubMed
    1. De Silva NS, Klein U. Dynamics of B cells in germinal centres. Nat Rev Immunol 2015;15(3):137–48 doi 10.1038/nri3804. - DOI - PMC - PubMed
    1. Mesin L, Ersching J, Victora GD. Germinal Center B Cell Dynamics. Immunity 2016;45(3):471–82 doi 10.1016/j.immuni.2016.09.001. - DOI - PMC - PubMed
    1. Klein U, Dalla-Favera R. Germinal centres: role in B-cell physiology and malignancy. Nat Rev Immunol 2008;8(1):22–33 doi 10.1038/nri2217. - DOI - PubMed
    1. Klose RJ, Bird AP. Genomic DNA methylation: the mark and its mediators. Trends Biochem Sci 2006. - PubMed

Publication types

MeSH terms