

Reinstating plasticity and memory in a tauopathy mouse model with an acetyltransferase activator
- PMID: 30275019
- PMCID: PMC6220301
- DOI: 10.15252/emmm.201708587
Reinstating plasticity and memory in a tauopathy mouse model with an acetyltransferase activator
Abstract
Chromatin acetylation, a critical regulator of synaptic plasticity and memory processes, is thought to be altered in neurodegenerative diseases. Here, we demonstrate that spatial memory and plasticity (LTD, dendritic spine formation) deficits can be restored in a mouse model of tauopathy following treatment with CSP-TTK21, a small-molecule activator of CBP/p300 histone acetyltransferases (HAT). At the transcriptional level, CSP-TTK21 re-established half of the hippocampal transcriptome in learning mice, likely through increased expression of neuronal activity genes and memory enhancers. At the epigenomic level, the hippocampus of tauopathic mice showed a significant decrease in H2B but not H3K27 acetylation levels, both marks co-localizing at TSS and CBP enhancers. Importantly, CSP-TTK21 treatment increased H2B acetylation levels at decreased peaks, CBP enhancers, and TSS, including genes associated with plasticity and neuronal functions, overall providing a 95% rescue of the H2B acetylome in tauopathic mice. This study is the first to provide in vivo proof-of-concept evidence that CBP/p300 HAT activation efficiently reverses epigenetic, transcriptional, synaptic plasticity, and behavioral deficits associated with Alzheimer's disease lesions in mice.
Keywords: Alzheimer's disease; CREB‐binding protein; acetylation; learning; transcription.
© 2018 The Authors. Published under the terms of the CC BY 4.0 license.
Figures
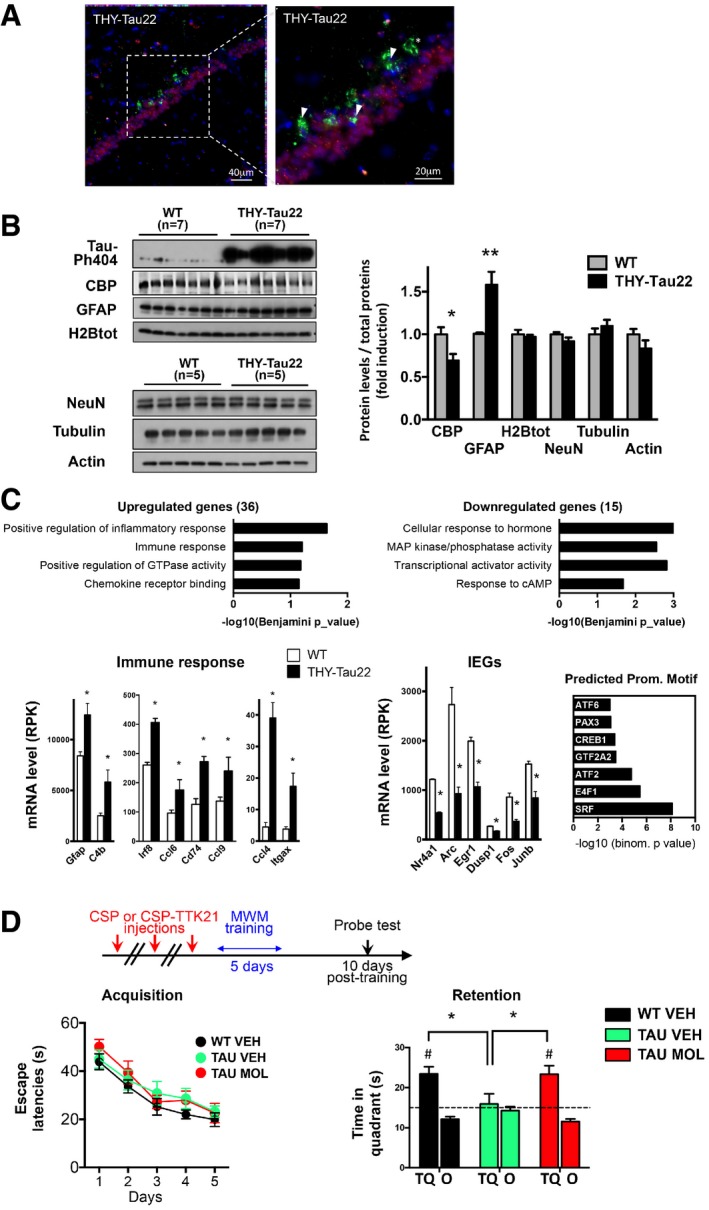
- A
Immunohistochemistry performed on 12‐month‐old THY‐Tau22 mice showing AT100‐positive neurons (green), CBP‐positive nuclei (red), and DAPI‐stained nuclei (blue) in the CA1 region of the dorsal hippocampus. A representative image is shown with a focus. Scale bars: 40 and 20 μm as noted (n = 5 mice). Arrows depict neurons bearing neurofibrillary tangles and do not display CBP immunostaining. The star depicts a ghost tangle (AT100‐positive neuron and no nucleus).
- B
Western blot analyses performed in the dorsal hippocampus of 12‐month‐old THY‐Tau22 mice compared to age‐matched controls. NeuN, actin, tubulin, and total H2B levels are not changed. Phosphorylated Tau on serine 404 (Tau‐Ph404) attests to samples from tauopathic mice. Quantification represents the ratio of the protein level detected on the total amount of proteins on the membranes, with WT arbitrarily set at 1 (fold induction). Bar graphs are mean ± SEM. n = 5–7/group as noted, multiple t‐tests, and CBP *P = 0.003 and GFAP **P = 0.0001 for THY‐Tau vs. WT mice.
- C
RNA‐sequencing data performed in the hippocampus of 8‐month‐old mice. Functional analyses (DAVID GOTERM) performed on significantly deregulated genes in THY‐Tau22 mice compared to WT mice. Representative genes are presented below. |log2 Fold Change| > 0.2; * indicates FDR < 0.05. IEG, immediate early genes. Predicted promoter motif (right) analyses performed with GREAT. Groups: WT mice (n = 3); THY‐Tau22 mice (n = 2). Graphs are mean ± SEM.
- D
Long‐term spatial memory testing: Mice were injected three times (1 per week) with vehicle (WT mice saline, WT VEH, n = 17), vehicle (THY‐Tau22 mice CSP, 500 μg/mouse, TAU VEH, n = 10), or molecule (THY‐Tau22 mice CSP‐TTK21, 500 μg/mice TAU MOL, n = 13) before training of spatial memory in the Morris water maze (MWM); retention (Probe test) was tested 10 days after the last training session. Acquisition (escape latencies, seconds) and retention performances (time in target quadrant, seconds) are shown for the three groups of mice. All groups of mice displayed significant acquisition of the platform location [Day effect, F(4,148) = 26.45, P < 0.001; Group and Group × Day effects, ns], but only TAU VEH exhibited impaired retention. CSP‐TTK21 treatment fully restored the ability of THY‐Tau22 mice to remember the platform location. Bar graphs are mean ± SEM. Student's t‐test to a constant value, # when compared to random (dotted line, 15 s) WT VEH, t(16) = 4.6323, #P = 0.0002; TAU VEH, t(9) = 0.3606, P = 0.7267; TAU MOL, t(12) = 3.945, #P = 0.0019. One‐way ANOVA; F(2,37) = 3.55; P = 0.03; * in the different comparisons: TAU MOL vs. TAU VEH, *P = 0.0166; WT VEH vs. TAU VEH, *P = 0.040; TAU MOL vs. WT VEH, non‐significant P = 0.437). TQ, target quadrant; O, other corresponds to the mean of the three other quadrants.

- A
Western blot analyses of dorsal hippocampal extracts from 12‐month‐old THY‐Tau22 vs. aged‐matched WT controls. Levels of different histone modifications were tested. Only the tetra‐acetylated form of H2B (K5K10K15K20) shows a significant decrease in tauopathic mice. Normalization was performed on the total amount of proteins transferred onto the membranes, and data are presented as fold induction of the acetylated histone/total H2B histone ratio. n = 5–6/group as noted. Multiple t‐tests, and H2BK5K10K15K20, *P = 0.0047 for THY‐Tau22 vs. WT mice.
- B
Scatter plot presenting RNA‐seq data comparison between THY‐Tau22 vs. WT mice. The log2(Fold‐Change) was estimated by DESeq2. Red dots correspond to genes with adjusted P‐value < 0.05.
- C
Habituation consisted of one trial to the visible platform. No statistical difference was observed in the distance from the habituation platform depending on the Group (F(1,37) = 0.17, P = 0.84).
- D
Distance to reach the platform (in meters) during the acquisition period. All groups of mice displayed significant and similar decreased of the distance traveled to reach the platform depending on the day [Day effect, F(4,148) = 26.47, P < 0.001; Group and Group × Day effects, ns]. Two‐way ANOVA followed by a multiple‐comparisons test (Newman–Keuls).
- E
The swim speed during the acquisition was the same for all groups [Day effect, (F(4,148) = 0.95, P = 0.46) and Group effect (F(2.37) = 1.06, P = 0.35)]. Two‐way ANOVA followed by a multiple‐comparisons test (Newman–Keuls).
- F
The number of visit to the previous platform location showed a significant difference in the number of crossing performed into it, and the three others for WT VEH mice (t(17) = 2.62, P < 0.05) and TAU MOL (t(13) = 2.70, P < 0.05) while there was no difference for the TAU VEH (t(10) = 0.21, P = 0.83). One‐way ANOVA, Student's t‐test, # P < 0.05 vs. mean of three others.
- G
The latency to first visit to the target platform compared to the mean latencies to the first visit to three others platform locations during the probe trial highlighted a global difference [Group Effect (F(2.37) = 5.87, P = 0.008) due to TAU VEH mice that significantly differed from the two others groups (TAU VEH vs. WT VEH (P = 0.004) and vs. TAU MOL (P = 0.012)]. There was a significant difference between the latencies to the first visit to the target platform with the three others for WT mice (t(17) = 6.90, P < 0.001) and TAU MOL (t(13) = 2.30, P < 0.05) while there was no difference for the TAU MOL (t(10) = 0.82, P = 0.42). One‐way ANOVA, post hoc analyses *P < 0.05 vs. TAU VEH and Student's t‐test, #P < 0.05 vs. mean of three others.
- H
Tracks representing the platform search during retention is shown for one mouse from each group that was either closest to the mean track or best of the group. The result of the probe test is noted below (in seconds).
- I
Western blot analyses were performed 22 days post‐injection from experiment shown in Fig 1D, on n = 5 mice/group. Levels of the different histone modifications were tested. Normalization was performed on the total amount of proteins transferred onto the membranes and data are presented as fold induction of the acetylated histone/total H2B histone ratio. Multiple t‐tests, and H2BK5K10K15K20ac, *P = 0.0006 and H3K27ac, *P = 0.0054 for CSP vs. CSP‐TTK21, (#) indicates a tendency (P = 0.0736).

- A
The timeline of GFP‐lentivirus and CSP or CSP‐TTK21 (one injection, 500 μg/mouse) injection is shown. (Left) The total number of spines was significantly decreased in TAU VEH compared to WT VEH mice. TAU MOL hippocampi showed a significant increase in the total number of spines compared to TAU VEH (one‐way ANOVA P = 0.0011, post hoc Holm–Sidak multiple‐comparisons test F(2,243) = 7.03; WT VEH vs. TAU VEH, **P < 0.0009; TAU MOL vs. TAU VEH, *P = 0.0455). (Middle) Based on spine type, the number of head spines (mushrooms, thins) was significantly lower in both TAU VEH and TAU MOL than in WT VEH controls (one‐way ANOVA P = 0.0018, post hoc Holm–Sidak multiple‐comparisons test F(2,243) = 6.467; WT VEH vs. TAU VEH, *P = 0.0013; WT VEH vs. TAU MOL, *P = 0.0272. Stubby spine density was significantly increased in TAU MOL compared to TAU VEH mice (one‐way ANOVA F(2,243) = 4.311, P = 0.0145, post hoc Holm–Sidak multiple‐comparisons test: TAU MOL vs. TAU VEH, *P = 0.0109), as the number of filopodia (one‐way ANOVA F(2,243) = 3.845, P = 0.0227, post hoc Holm–Sidak multiple‐comparisons test TAU MOL vs. TAU VEH, *P = 0.0179). (Right) Typical images are presented showing a dendrite fragment for each condition. White arrowhead depicts stubby spines. Scale bar, 2 μm. Number of dendritic segments: WT VEH, n = 67; TAU VEH, n = 93, TAU MOL, n = 87; number of neurons: WT VEH, n = 20; TAU VEH, n = 28, TAU MOL, n = 16; number of mice: WT VEH, n = 2; TAU VEH, n = 3, TAU MOL, n = 3.
- B
CSP‐TTK21 injection into THY‐Tau22 mice rescues mature dendritic spines formation in response to learning. (Top left) The timeline of injections is shown: Mice were injected three times (1 per week) with vehicle (WT mice, WT VEH, NaCl 0.9%), vehicle [THY‐Tau22 mice (TAU VEH), CSP 500 μg/mouse], or molecule [THY‐Tau22 mice (TAU MOL), 500 μg/mice] and either trained over a 4‐day acquisition period in the MWM (“learning” group) or left in their home cage (“basal” group). Mushroom‐shaped spines were counted in dorsal CA1, 4 days post‐training. (Bottom left) The number of mature spines was significantly increased by learning in WT VEH and TAU MOL mice. Two‐way ANOVA; learning effect, F(1,139) = 54.18; P < 0.0001; ### post hoc Holm–Sidak multiple‐comparisons test: learning vs. basal in WT VEH (P = 0.0001) and in TAU MOL mice (P = 0.0001). After learning, WT VEH and TAU MOL mice displayed significantly higher number of mature spines than TAU VEH mice (Genotype X Treatment effect, F(2,139) = 9.704; P = 0.0001; *** post hoc Holm–Sidak multiple‐comparisons test: TAU MOL vs. TAU VEH (P = 0.0001), WT VEH vs. TAU VEH (P = 0.0001). (Right) Typical examples of a dendritic fragment bearing mushroom spines (arrows) are shown for each sub‐group in response to learning. Number of dendritic segments: Learning: WT VEH, n = 27; TAU VEH, n = 27, TAU MOL, n = 30; WT VEH_HC, n = 27; number of mice: WT VEH, n = 3; TAU VEH, n = 3, TAU MOL, n = 3. Basal: WT VEH, n = 27; TAU VEH, n = 7, TAU MOL, n = 15; number of mice: WT VEH, n = 3; TAU VEH, n = 3, TAU MOL, n = 2.
- C
Mice were injected three times (1 per week) with saline (WT VEH), CSP (vehicle, VEH), or CSP‐TTK21 (molecule, MOL) (500 μg/mice; THY‐Tau22 mice (TAU) before euthanasia. Long‐term depression measurements were performed on hippocampal slices. (Top left) Examples of analog traces recorded 10 min before (a) and 55 min after LTD induction (b; dotted line) in the three groups of mice. (Bottom left) Time course of LTD; LTD is expressed as a percent change in fEPSP (field excitatory postsynaptic potentials) slope over time. After the 20‐min baseline recording, a low‐frequency stimulation (LFS, 2 Hz for 10 min) was applied (arrow). Recording was stopped during the 10‐min conditioning stimulation and resumed after completion of LFS. LFS induced a strong depression of the fEPSP slope, which recovered partially to reach a stable level of depression about 20 min after stimulation. (Right) Average depression measured in the last 10 min of LTD. LTD was significantly different in TAU VEH (88.4 ± 4.1% of the baseline, n = 10) compared to controls (WT VEH, 71.1 ± 4.4%, n = 9; F(1,17) = 8.8, **P = 0.008). CSP‐TTK21 treatment restored LTD to control levels (64.9 ± 5.2%, n = 10; WT VEH vs. TAU MOL: F(1,17) = 0.83, P = 0.37, ns; TAU VEH vs. TAU MOL: F(1,18) = 13.2. **P = 0.0019). Multivariate analyses of variance followed by post hoc test (Statview software).
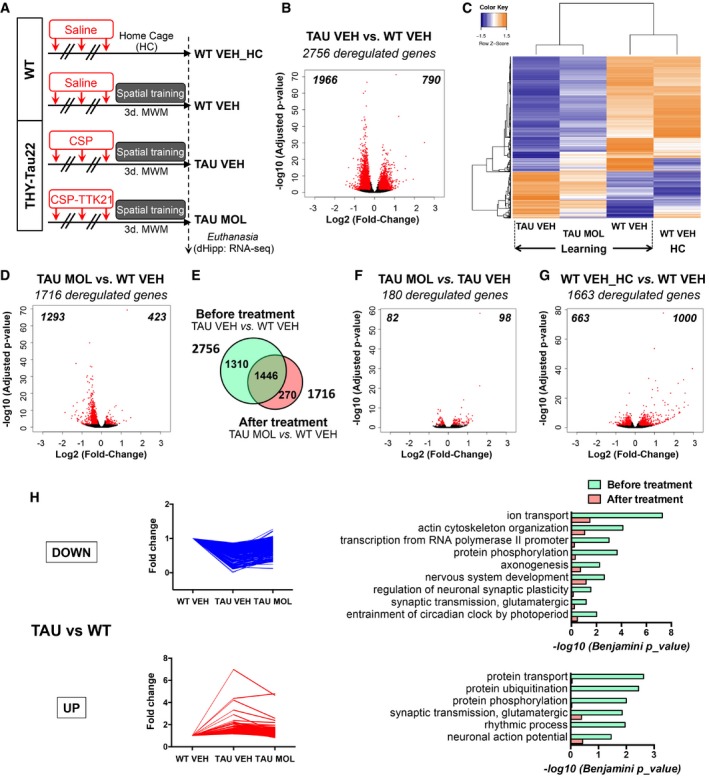
- A
Timeline of the experiment and experimental groups: Eight‐month‐old mice were injected three times (1 per week) with vehicle (WT mice, WT VEH, saline), vehicle [THY‐Tau22 mice (TAU VEH), CSP 500 μg/mouse], or molecule [THY‐Tau22 mice (TAU MOL), CSP‐TTK21 500 μg/mice]. One sub‐group of WT mice was left in their home cage (WT VEH_HC), and the other groups of mice (WT and THY‐Tau22) were subjected to a 3‐day spatial training (Learning). RNA extracts were isolated from the dorsal hippocampus, 1 h after the last training (n = 5/group).
- B
Volcano plot showing that 2,756 genes are differentially regulated between THY‐Tau22 and WT mice during learning. The log2(Fold‐Change) was estimated by DESeq2. FDR < 0.05 and |log2 Fold Change| > 0.2. Red dots correspond to genes with adjusted P‐value < 0.05. Numbers in the corners represent the number of downregulated (left) and upregulated (right) genes.
- C
Heatmap representing expression of z‐score of the 2,756 deregulated genes in all experimental conditions. Color coding was performed according to the z‐score of the normalized reads counts divided by gene length. Clustering was performed using the unweighted pair group method with arithmetic mean method and Pearson's distance. Groups: WT VEH_HC (n = 3), WT VEH (n = 2); TAU VEH (n = 2); TAU MOL (n = 2).
- D
Volcano plot showing that 1,756 genes are differentially regulated between treated THY‐Tau22 and WT mice during learning. Same parameters as in (B).
- E
Venn diagram showing the rescue of the transcriptome in learning mice, by comparing differentially regulated genes before (TAU VEH vs. WT VEH) and after (TAU MOL vs. TAU VEH) the treatment for all genes with an adjusted P‐value < 0.05.
- F, G
Volcano plots showing differentially regulated genes by the molecule in THY‐Tau22 mice (F) and by learning in WT mice (G). Same parameters as in (B).
- H
Fold changes for every significant pathology‐regulated gene (TAU VEH vs. WT VEH) condition are plotted for downregulations (top) and upregulations (bottom) separately (Adjusted P‐value < 0.05). Functional annotation performed with DAVID for GOTERM_Biological Process and their significance are shown on the right before (green) and after (red) treatment. Significantly regulated pathways with −log10(Benjamini P_value) < 0.05 are given.

- A
Fold changes of the 300 most deregulated genes in TAU vs. WT mice from the RNA‐seq study (adjusted P‐value < 0.05) represented as a heatmap before and after the treatment. Color coding was performed according to the log2(Fold‐Change) for down (blue)‐ and up (red)‐regulated genes. Fold changes tend to go back to normal values (zero) after the treatment. Comparisons: before treatment, TAU VEH vs. WT VEH; after treatment, TAU MOL vs. WT VEH.
- B
RNA‐seq data of inflammatory markers. RNA‐seq data (n = 2–3/group) showing that expression of a series the inflammation‐related genes significantly upregulated in tauopathic vs. WT mice is not changed upon CSP‐TTK21 treatment of THY‐Tau22 mice. Adjusted P‐value < 0.05, $ TAU VEH vs. WT VEH; & TAU MOL vs. WT VEH mice; $ TAU VEH vs. WT VEH_HC, & TAU MOL vs. WT VEH_HC, ns non‐significant when TAU MOL is compared to TAU VEH. See Materials and Methods for statistical analyses of RNA‐seq data (n = 2–3/group).
- C
RT–qPCR validations performed in a different cohort of mouse from the RNA‐seq study (n = 4–5/group). One‐way ANOVA with uncorrected Fisher's test. Gfap: F(3,14) = 6.615, P = 0.0052. $ P = 0.0207 for WT VEH vs. TAU VEH, & P = 0.0020 for TAU MOL vs. WT VEH, ns non‐significant when TAU MOL is compared to TAU VEH, P = 0.3470. Ccl4: F(3,14) = 22.35, P < 0.0001, $ P = 0.0001 for WT VEH vs. TAU VEH, & P = 0.0001 for TAU MOL vs. WT VEH, ns non‐significant when TAU MOL is compared to TAU VEH, P = 0.0915. Itgax: F(3,15) = 5.127, P = 0.0122. $ P = 0.0472 for WT VEH vs. TAU VEH, & P = 0.0058 for TAU MOL vs. WT VEH, ns non‐significant when TAU MOL is compared to TAU VEH, P = 0.3078.
- D
CSP‐TTK21 does not influence the Tau transgene expression as evaluated by RT–qPCR in the different experimental groups (n = 5/group). One‐way ANOVA with uncorrected Fisher's test: hTau F(3,15) = 75.61, P < 0.0001. $ P = 0.0001 for WT VEH vs. TAU VEH, & P = 0.0001 for TAU MOL vs. WT VEH, ns non‐significant when TAU MOL is compared to TAU VEH, P = 0.7240.

- A
Functional annotation charts (Benjamini, P < 0.05) using GREAT performed on the 98 significantly overexpressed genes by CSP‐TTK21 treatment in tauopathic mice (TAU MOL vs. TAU VEH). Significance is indicated as −log10(Benjamini P_value).
- B
Heatmap representing expression z‐score of the 98 significantly overexpressed genes in the TAU MOL vs. TAU VEH comparison, for all experimental conditions. Color coding was performed according to the z‐score of the normalized reads counts divided by gene length. Clustering was performed using the unweighted pair group method with arithmetic mean method and Pearson's distance.
- C
Venn diagram showing that most of the genes upregulated by CSP‐TTK21 treatment were also downregulated in the pathology (81/98, P = 7.1 × 10−88, χ2 test), as well as a significant overlap (P = 2 × 10⁻²⁹, χ2 test) genes upregulated by learning in WT.
- D
RNA‐seq data showing expression of several immediate early genes (IEGs): Nr4a1, Arc, Egr1, Dusp1, Fos, and Junb. Most of the downregulated IEGs in tauopathic compared to WT mice present a significant induction in THY‐Tau22 mice after CSP‐TTK21 injection. Adjusted P‐values corresponding to P < 0.05 are indicated by * for WT VEH vs. WT VEH_HC, $ for TAU VEH vs. WT VEH, and # for TAU MOL vs. TAU VEH. See Materials and Methods for statistical analyses of RNA‐seq data (n = 2–3/group).
- E
RNA‐seq data showing that CSP‐TTK21 treatment of tauopathic mice restored the expression of plasticity/memory‐relevant target genes: Klotho (Kl) and Neurotensin (Nts). Adjusted P‐values corresponding to P < 0.05 are indicated by * for WT VEH vs. WT VEH_HC, $ for TAU VEH vs. WT VEH and # for TAU MOL vs. TAU VEH. See Materials and Methods for statistical analyses of RNA‐seq data (n = 2–3/group).
- F
RT–qPCR validations performed in a different cohort of mice from the RNA‐seq study (n = 4–5/group). One‐way ANOVA with uncorrected Fisher's test. Klotho, Kl: F(3,16) = 2.949, P = 0.0643; * learning P = 0.0145 for WT VEH vs. WT VEH_HC, $ pathology P = 0.0395 for WT VEH vs. TAU VEH. Nts: F(3,14) = 4.290, P = 0.0241; $ pathology P = 0.0036 for WT VEH vs. TAU VEH, # molecule P = 0.0081 for TAU MOL vs. TAU VEH.
- G
Western blot for Klotho and Neurotensin expression in the different experimental conditions. Immunoblot results are shown (n = 5/group). Bar graphs represent the quantification of the protein levels as percentage of the control group WT VEH_HC, arbitrarily set at 100%. Each detected protein was normalized to the corresponding amount of total proteins in the gels or the nitrocellulose membrane. Klotho and Neurotensin were further normalized to the level of actin. One‐way ANOVA with uncorrected Fisher's test. Klotho: F(3,16) = 5.192, P = 0.0107, * learning P = 0.0117 for WT VEH vs. WT VEH_HC, $ pathology P = 0.0027 for WT VEH vs. TAU VEH, # molecule P = 0.0282 for TAU MOL vs. TAU VEH. Nts: F(3,16) = 3.748, P = 0.0326, $ pathology P = 0.0200 for WT VEH vs. TAU VEH, # molecule P = 0.0079 for TAU MOL vs. TAU VEH.

- A
Functional annotation charts (Benjamini, P < 0.05) using DAVID (GOTERM_Cellular Component) performed on the 82 significantly downregulated genes by CSP‐TTK21 treatment in tauopathic mice (TAU MOL vs. TAU VEH), showing a significant association with neuronal terms. Significance is indicated as −log10(Benjamini P_value).
- B
Heatmap representing expression z‐score of the 82 significantly downregulated genes in the TAU MOL vs. TAU VEH comparison, for all experimental conditions. Color coding was performed according to the z‐score of the normalized reads counts divided by gene length. Clustering was performed using the unweighted pair group method with arithmetic mean method and Pearson's distance.
- C
RNA‐seq data showing expression of several genes belonging to “synapse” annotation (DAVID): Grik4, Homer3, and Sv2b, which are significantly downregulated by CSPTTK21 treatment in THY‐Tau22 mice. Adjusted P‐values corresponding to P < 0.05 are indicated by * for WT VEH vs. WT VEH_HC, $ for TAU VEH vs. WT VEH, and # for TAU MOL vs. TAU VEH. See Materials and Methods for statistical analyses of RNA‐seq data (n = 2–3/group). Graphs are mean ± SEM.
- D
Venn diagram showing that a significant number of genes downregulated by CSP‐TTK21 treatment overlapped with genes upregulated in the pathology (P = 2.1 × 10−72, χ2 test), as well as with some genes downregulated by learning in WT (P = 2.3 × 10⁻³, χ2 test).
- E, F
Functional annotation charts using DAVID (GOTERM_Cellular Component) performed on the differentially regulated genes in learning in the WT mice condition (WT VEH vs. WT VEH_HC). The downregulated genes by learning (E) are associated with neuronal terms, and upregulated ones (F), with transcriptional and translational functions. Significance is indicated as −log10(Benjamini P_value).

- A
Three groups of mice were injected three times (1 per week) with NaCl (WT VEH), CSP (vehicle, VEH) or CSP‐TTK21 (molecule, MOL) (500 μg/mice; THY‐Tau22 mice (TAU) before euthanasia. ChIP‐seq analyses performed with H2Bac (replicates: rep1, rep2) and H3K27ac (rep2) on the dorsal hippocampus of WT VEH, TAU VEH, and TAU MOL mice. The table shows the number of aligned reads per samples obtained after sequencing. Inputs were sequenced in each replicate.
- B
Principal component analyses (PCA). For each condition (WT VEH, TAU VEH, TAU MOL), islands detected with SICER in both replicates were intersected using BEDTools (Quinlan & Hall, 2010) intersect v26. Then, all intersected regions, one dataset per condition, were combined using BEDTools merge v26 to obtain a dataset containing all regions bound in at least one condition. The number of reads falling into the union dataset was computed using BEDTools intersect v26. Data were normalized using the method proposed by Anders and Huber (2010). For PCA plotting, data were transformed in order to stabilize variance using the DESeq2 28/04/y 18:23Bioconductor package (Love et al, 2014).
- C
Mean H2Bac profiles established with SeqMiner for all genes at TSS (top) and gene bodies (bottom) for the first quartile (poorly expressed genes) in the two replicates (rep1 and rep2). Significance (Benjamini, P < 0.05) of the annotations associated with both TSS (green) or gene profiles (red) is shown (DAVID, KEGG pathways).
- D
Mean H2Bac profiles established separately for each replicates (rep1 and rep2) with SeqMiner for the 1,624 decreased peaks obtained in the comparison TAU VEH vs. WT VEH (left) and TAU MOL vs. WT VEH (right).
- E
Venn diagrams showing differentially regulated peaks separately, either the decreased peaks (Left) or the increased peaks (right), before (TAU VEH vs. WT VEH) and after (TAU MOL vs. TAU VEH) the treatment, for all peaks with an FDR < 0.001.

- A
Pie charts showing the genomic distribution of H2Bac and H3K27ac relative to whole genome, obtained from ChIP‐sequencing experiments performed in WT dorsal hippocampus. The percentage of peaks in promoters, upstream regulatory regions (upstream; −1 to −20 kb relative to TSS), introns, exons, and intergenic regions is shown.
- B
Mean H2Bac profiles at TSS relative to gene expression obtained from RNA‐seq data. Expressed genes were separated into four groups (Q1 to Q4, 6,483 genes/group), Q1 representing the less expressed genes (0–25%) and Q4, the most expressed genes (75–100%). Profiles were established with SeqMiner centered on TSS ±2 Kb.
- C
Mean H2Bac profiles established with SeqMiner for all genes at TSS (top) and gene bodies (bottom) for the fourth quartile (most expressed genes) in the two replicates (rep1 and rep2). Significance (Benjamini, P < 0.05) of the annotations associated with both TSS (green) or gene profiles (red) are shown (DAVID, KEGG pathways).
- D
Differentially regulated H2Bac peaks were analyzed with SICER, and significant fold changes (FC > 1; FDR < 0.001) between comparisons are shown for the pathology (TAU VEH vs. WT VEH, blue) and the effect of the molecule (TAU MOL vs. TAU VEH, red). Fold change is shown as log2 (Fold Change) (x‐axis) and significance, as −log10(FDR) (y‐axis).
- E
Mean H2Bac and H3K27ac profiles established with SeqMiner for the 1,624 decreased peaks obtained in the comparison TAU VEH vs. WT VEH. H2Bac but not H3K27ac peaks show differential regulation.
- F
Time series‐like plot. For every significant H2Bac decreased regions (1,624) in WT VEH vs TAU VEH, normalized read counts were computed for each of the different conditions (WT VEH, TAU VEH, TAU MOL). Fold changes are all referring to WT VEH. Y‐axis: Fold change. X‐axis: Conditions.
- G
Functional annotation charts using DAVID performed on the differentially regulated H2Bac genes corresponding to the peaks either decreased in TAU VEH vs. WT VEH (blue, 1,624) or increased in TAU MOL vs. TAU VEH (red, 2,617). Significance is indicated as −log10(Benjamini P_value).
- H
Venn diagram showing the rescue of H2Bac levels by comparing differentially regulated peaks before (TAU VEH vs. WT VEH) and after (TAU MOL vs. TAU VEH) the treatment for all peaks with an FDR < 0.001. About 95% of the peaks were not deregulated after CSP‐TTK21 treatment.

- A
Mean enrichment profiles performed with SeqMiner presenting the genomic distribution of H2Bac and H3K27ac reads obtained in ChIP‐seq experiments in the different experimental groups, established along putative neuronal CBP enhancers (±4 Kb; Kim et al, 2010). In the dorsal hippocampus, H2Bac levels are enriched at CBP enhancers in WT WEH (blue), decreased in tauopathic mice (TAU VEH, pink), and induced by CSP‐TTK21 treatment (TAU MOL, green).
- B
Mean profiles were separated in two sets of loci, including 17,817 peaks highly enriched in H2Bac and showing a differential regulation in the experimental groups and 23,331 peaks that were poorly enriched in H2Bac and not regulated.
- C
Functional annotation of the 17,817 peaks highly enriched in H2Bac performed with GREAT, GOTERM Cellular Component and Biological Process.
- D
Mean profiles established with SeqMiner for all genes at TSS for H2Bac (Left) and H3K27ac (Right). H2Bac but not H3K24ac presents a differential regulation at TSS.
- E
Mean H2Bac profiles established with SeqMiner on the differentially regulated genes obtained in transcriptomic experiments (RNA‐seq), either decreased (left) or increased (right). The “basal” H2Bac TSS enrichment state of these genes is differentially regulated whether the genes are decreased or increased in response to learning.
- F
UCSC genome browser view of the c‐fos genomic locus with H3K27ac ChIP‐seq (blue), H2Bac ChIP‐seq (green), and input (black) signals. Blue shading indicates locations of the c‐fos enhancers (Joo et al, 2016); gray shading indicates location of the promoter. Differential peaks were analyzed with SICER. This set of data shows that H2Bac levels were significantly decreased at e1 (FDR = 1.95 × 10−08), e2 (FDR = 0.0005), and e5 (FDR = 2.44 × 10−05) enhancers in THY‐Tau22 compared to WT mice, and significantly enriched at e1 (FDR = 4.01 × 10−08) the regions encompassing e3, e4 and TSS (FDR = 7.53 × 10−07), and e5 (FDR = 0.001) after CSP‐TTK21 treatment.

- A
Mean profiles established with SeqMiner for the mostly expressed genes (fourth quartile) at TSS for H2Bac.
- B
Mean H2Bac profiles established with SeqMiner for the mostly expressed genes (fourth quartile) at the gene profiles. The severe decrease in H2Bac enrichment is poorly compensated at the gene profiles, only a few genes showing significant recovery, such as the neuropilin‐2 isoform 1 precursor (Nrp2) gene locus. Nrp2 is a receptor for semaphorin 3F, which together act as a strong axonal repellent and pruning factor for hippocampal axons in the developing nervous system; their role in the postnatal brain is thought to direct hippocampal neural circuit formation (Shiflett et al, 2015).
- C
UCSC genome browser view showing H3K27ac ChIP‐seq (blue), H2Bac ChIP‐seq (red), and input (black) signals around the Nrp2 gene locus. H3K27ac displays a broad profile along the gene body. H2Bac presents a similar broad profile on this gene. Differential peak calling analyses revealed that the H2Bac signature is downregulated at this locus in tauopathic mice compared to WT mice (intron, FDR = 0.0026) and upregulated by CSP‐TTK21 treatment of THY‐Tau22 mice (intron, FDR = 3.8 × 10−07; intron, FDR = 4.8 × 10−09; distant promoter, FDR = 9.65 × 10−09).
References
-
- Abbott A, Dolgin E (2016) Failed Alzheimer's trial does not kill leading theory of disease. Nature 540: 15–16 - PubMed
-
- Achour M, Le Gras S, Keime C, Parmentier F, Lejeune FX, Boutillier AL, Neri C, Davidson I, Merienne K (2015) Neuronal identity genes regulated by super‐enhancers are preferentially down‐regulated in the striatum of Huntington's disease mice. Hum Mol Genet 24: 3481–3496 - PubMed
-
- Ahmed T, Blum D, Burnouf S, Demeyer D, Buee‐Scherrer V, D'Hooge R, Buee L, Balschun D (2015) Rescue of impaired late‐phase long‐term depression in a tau transgenic mouse model. Neurobiol Aging 36: 730–739 - PubMed
-
- Alarcon JM, Malleret G, Touzani K, Vronskaya S, Ishii S, Kandel ER, Barco A (2004) Chromatin acetylation, memory, and LTP are impaired in CBP+/‐ mice: a model for the cognitive deficit in Rubinstein‐Taybi syndrome and its amelioration. Neuron 42: 947–959 - PubMed
Publication types
MeSH terms
Substances
LinkOut - more resources
Full Text Sources
Medical
Molecular Biology Databases
Miscellaneous
