. 2018 Dec 7;201(1):e00493-18.
doi: 10.1128/JB.00493-18. Print 2019 Jan 1.

Coassembly of SecYEG and SecA Fully Restores the Properties of the Native Translocon

Affiliations

Coassembly of SecYEG and SecA Fully Restores the Properties of the Native Translocon

Priya Bariya et al. J Bacteriol. .

Abstract

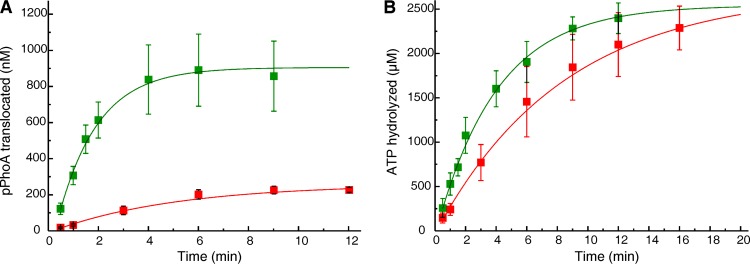
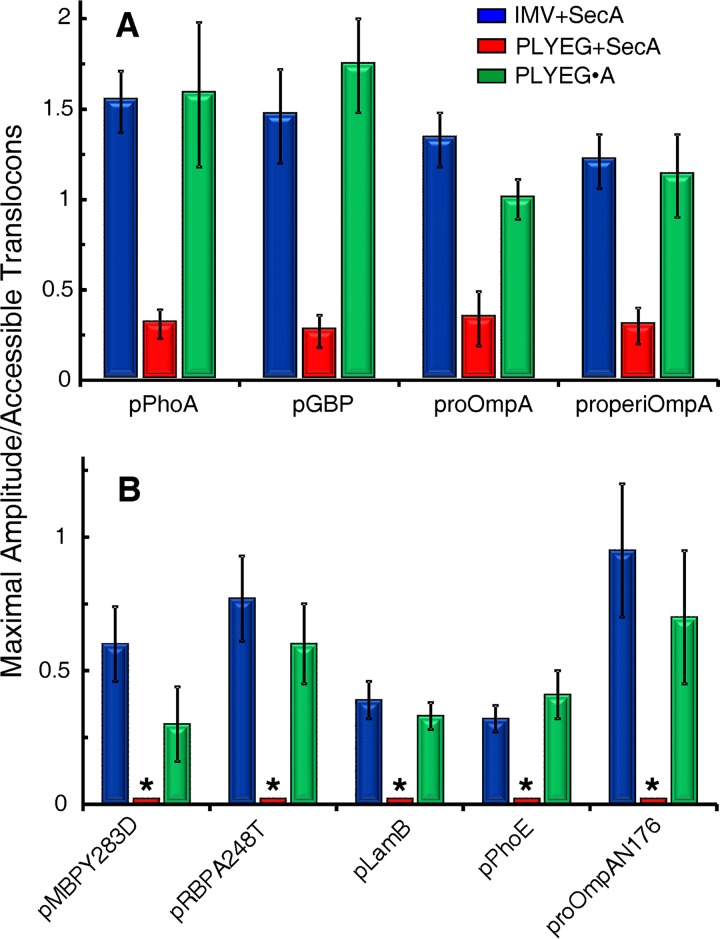
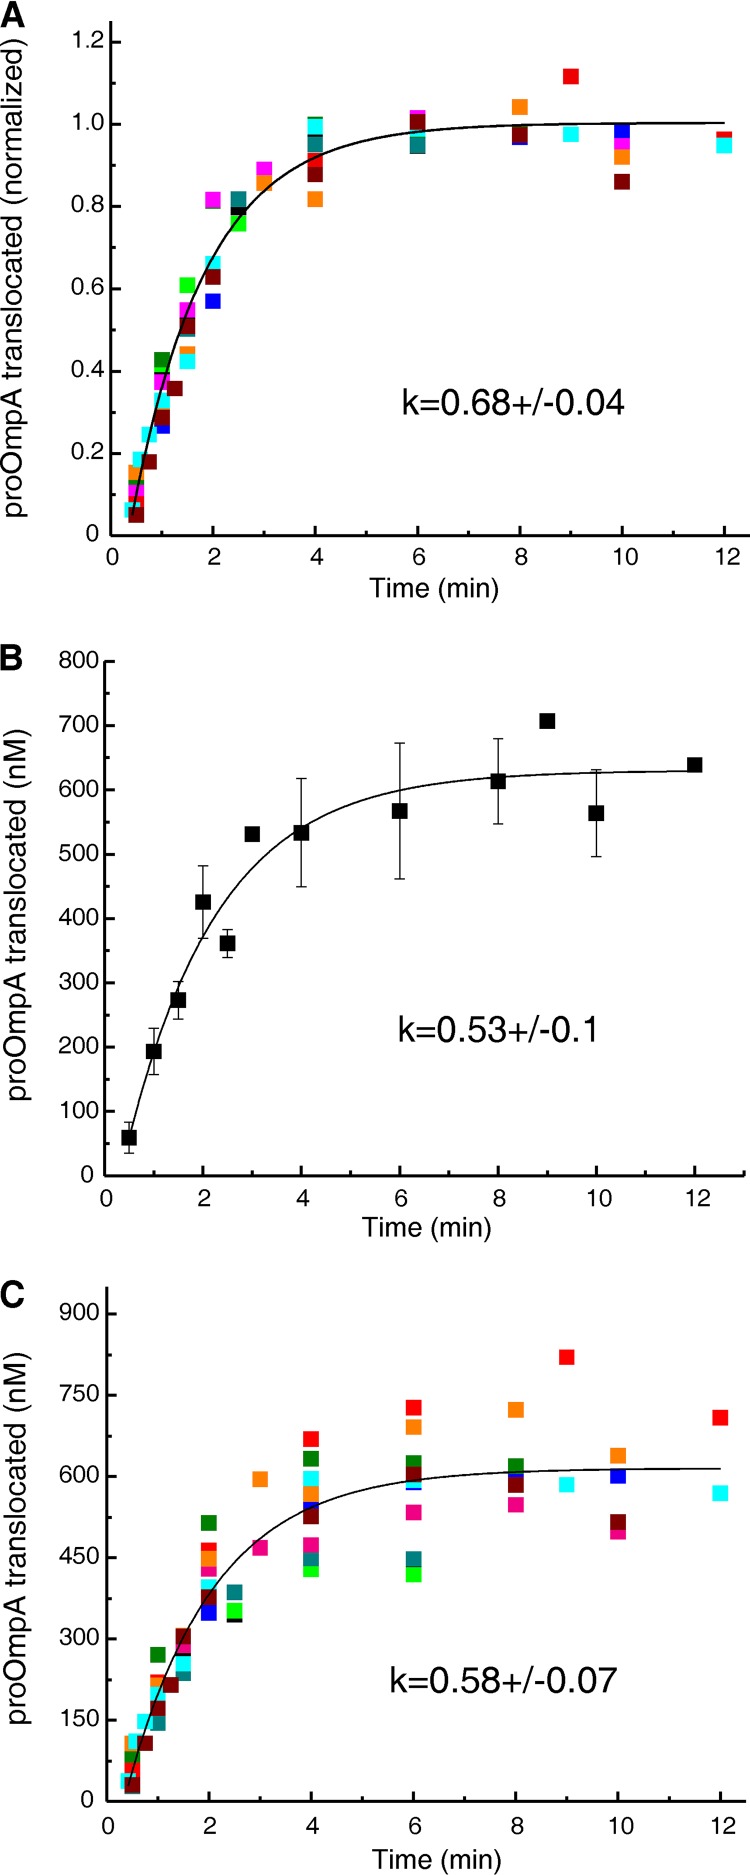
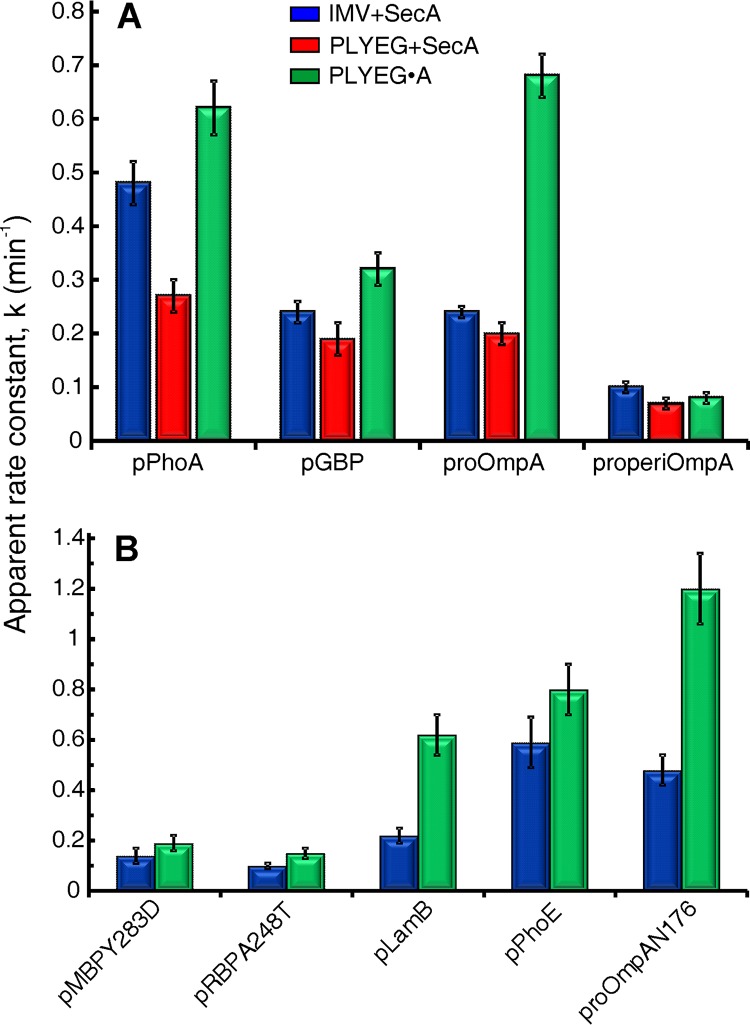
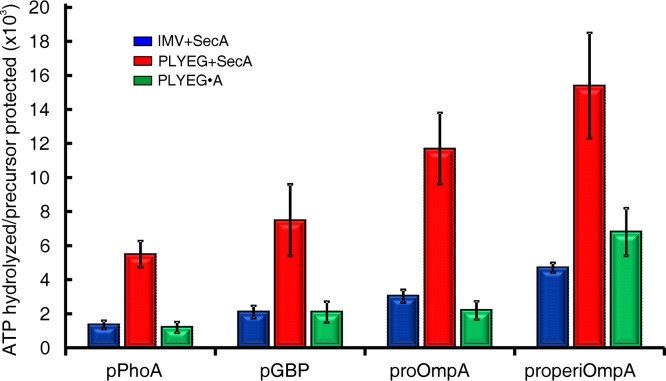
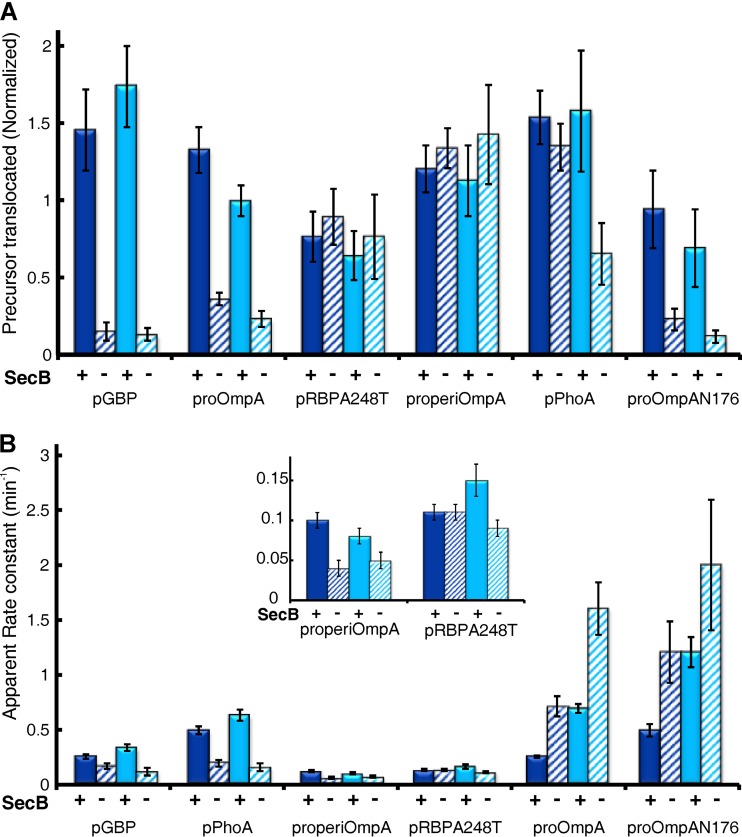
In all cells, a highly conserved channel transports proteins across membranes. In Escherichia coli, that channel is SecYEG. Many investigations of this protein complex have used purified SecYEG reconstituted into proteoliposomes. How faithfully do activities of reconstituted systems reflect the properties of SecYEG in the native membrane environment? We investigated by comparing three in vitro systems: the native membrane environment of inner membrane vesicles and two methods of reconstitution. One method was the widely used reconstitution of SecYEG alone into lipid bilayers. The other was our method of coassembly of SecYEG with SecA, the ATPase of the translocase. For nine different precursor species we assessed parameters that characterize translocation: maximal amplitude of competent precursor translocated, coupling of energy to transfer, and apparent rate constant. In addition, we investigated translocation in the presence and absence of chaperone SecB. For all nine precursors, SecYEG coassembled with SecA was as active as SecYEG in native membrane for each of the parameters studied. Effects of SecB on transport of precursors faithfully mimicked observations made in vivo From investigation of the nine different precursors, we conclude that the apparent rate constant, which reflects the step that limits the rate of translocation, is dependent on interactions with the translocon of portions of the precursors other than the leader. In addition, in some cases the rate-limiting step is altered by the presence of SecB. Candidates for the rate-limiting step that are consistent with our data are discussed.IMPORTANCE This work presents a comprehensive quantification of the parameters of transport by the Sec general secretory system in the three in vitro systems. The standard reconstitution used by most investigators can be enhanced to yield six times as many active translocons simply by adding SecA to SecYEG during reconstitution. This robust system faithfully reflects the properties of translocation in native membrane vesicles. We have expanded the number of precursors studied to nine. This has allowed us to conclude that the rate constant for translocation varies with precursor species.

Keywords: E. coli; SecA; SecYEG; membrane protein; protein export; protein translocation; proteoliposomes; secretion; translocon.


Figures

FIG 1
FIG 1
In vitro translocation and associated ATPase of 14C-labeled pPhoA. (A and B) The extent of translocation (A) and SecA ATPase activity (B) during in vitro translocation of 14C-labeled pPhoA into PLYEG·SecA (green) and PLYEG+SecA (red). The average values for each time point, with standard deviations, are shown (green, n = 9; red, n = 3). When error bars are not visible, they fall within the symbols. These data and the data in all subsequent figures were fitted to a single exponential rise to maximum (see Materials and Methods). The fits are weighted with 1/σ2, where sigma is the standard deviation.
FIG 2
FIG 2
Extent of precursor translocation in three in vitro systems: IMV+SecA, PLYEG+SecA, and PLYEG·SecA. The values represent averages of normalized amplitudes with their standard deviations. (A) Numbers of replicates for translocation of each species were the following for blue, red, and green, respectively: pPhoA, 7, 5, and 9; pGBP, 6, 5, and 6; proOmpA, 7, 5, and 10; and properiOmpA, 3, 4, and 3. (B) Translocation assays were performed at least 3 times. The bars marked by an asterisk indicate that assays were done but translocation levels were too low to obtain reliable fits.
FIG 3
FIG 3
Fits of multiple data sets and associated errors. Translocation of proOmpA into PLYEG·SecA was performed multiple times (n = 10) under the condition of limiting SecYEG. Each color represents an individual experiment. The ratio of precursor to accessible SecY in the assays ranged from 1.5 to 3. (A) Global fit of the normalized data. (B) Fit of averaged data. (C) Global fit of data from ten translocation experiments without normalization. See the text for a description of normalization and fitting.
FIG 4
FIG 4
Apparent rate constants of translocation. The apparent rate constants were determined for each precursor using IMV+SecA (blue), PLYEG+SecA (red), and PLYEG·SecA (green). See the text for a description of normalization and global fitting. The error bars represent the errors in the global fit. The ratio of precursor to accessible SecYEG varied over the ranges given here for precursors. (A) pPhoA, 1.3 to 3.5; pGBP, 1.5 to 3; proOmpA, 1.3 to 3.0; properiOmpA, 2 to 4; (B) pMBPY283D, 2 to 4; pRBP(A248T), 1.5 to 3; pLamB, 4 to 5.5; pPhoE, 2.6 to 4; proOmpAN176, 3 to 6.
FIG 5
FIG 5
Coupling of ATP hydrolysis to translocation of precursors. Translocation ATPase in three in vitro systems: IMV+SecA, PLYEG+SecA, and PLYEG·SecA. The values are an average of the coupling energy with the standard deviations. Higher values represent lower efficiency of coupling the energy to the translocation. The numbers of replicates were 5 to 8 for pPhoA, 5 for pGBP, 4 to 7 for proOmpA, and 3 or 4 for properiOmpA.
FIG 6
FIG 6
Comparison of activity of SecYEG wild type and SecY(F328R)EG. Translocation and ATPase assays of 14C-labeled proOmpA were done using proteoliposomes reconstituted with wild-type SecYEG (squares, n = 3) and with SecY(F328R)EG (circles, n = 3). SecA was added to both translocation mixtures. (A and B) Precursor translocated (A) and SecA ATPase (B) activity. The values are averages with standard deviations. When error bars do not show, they lie within the data points.
FIG 7
FIG 7
Effect of SecB on translocation of precursors. Precursors were assessed for translocation using IMV (dark blue) and PLYEG·SecA (light blue) in the presence (+) and absence (−) of SecB. The normalized amplitude and the apparent rate constant were obtained as described previously. All experiments were performed at least 3 times. The inset in panel B is an expansion of the y axis to make values visible. The error bars in panel A represent standard deviations, and those in panel B represent the error in the global fit.

Comment in

References

    1. Van den Berg B, Clemons WM Jr, Collinson I, Modis Y, Hartmann E, Harrison SC, Rapoport TA. 2004. X-ray structure of a protein-conducting channel. Nature 427:36–44. doi:10.1038/nature02218. - DOI - PubMed
    1. Crane J, Randall L. 2017. The Sec system: protein export in Escherichia coli. EcoSal Plus 2017. doi:10.1128/ecosalplus.ESP-0002-2017. - DOI - PMC - PubMed
    1. Cabelli RJ, Dolan KM, Qian LP, Oliver DB. 1991. Characterization of membrane-associated and soluble states of SecA protein from wild-type and SecA51(TS) mutant strains of Escherichia coli. J Biol Chem 266:24420–24427. - PubMed
    1. Matsuyama S-I, Mizushima S. 1995. Biochemical analyses of components comprising the protein translocation machinery of Escherichia coli. Adv Cell Mol Biol Membr Organelles 4:61–84. doi:10.1016/S1874-5172(06)80007-6. - DOI
    1. Gelis I, Bonvin AMJJ, Keramisanou D, Koukaki M, Gouridis G, Karamanou S, Economou A, Kalodimos CG. 2007. Structural basis for signal-sequence recognition by the translocase motor SecA as determined by NMR. Cell 131:756–769. doi:10.1016/j.cell.2007.09.039. - DOI - PMC - PubMed

Publication types

MeSH terms

LinkOut - more resources