. 2018 Oct 1;9(1):4001.
doi: 10.1038/s41467-018-06354-3.

Genome-wide discovery of somatic regulatory variants in diffuse large B-cell lymphoma

Affiliations

Genome-wide discovery of somatic regulatory variants in diffuse large B-cell lymphoma

Sarah E Arthur et al. Nat Commun. .

Abstract

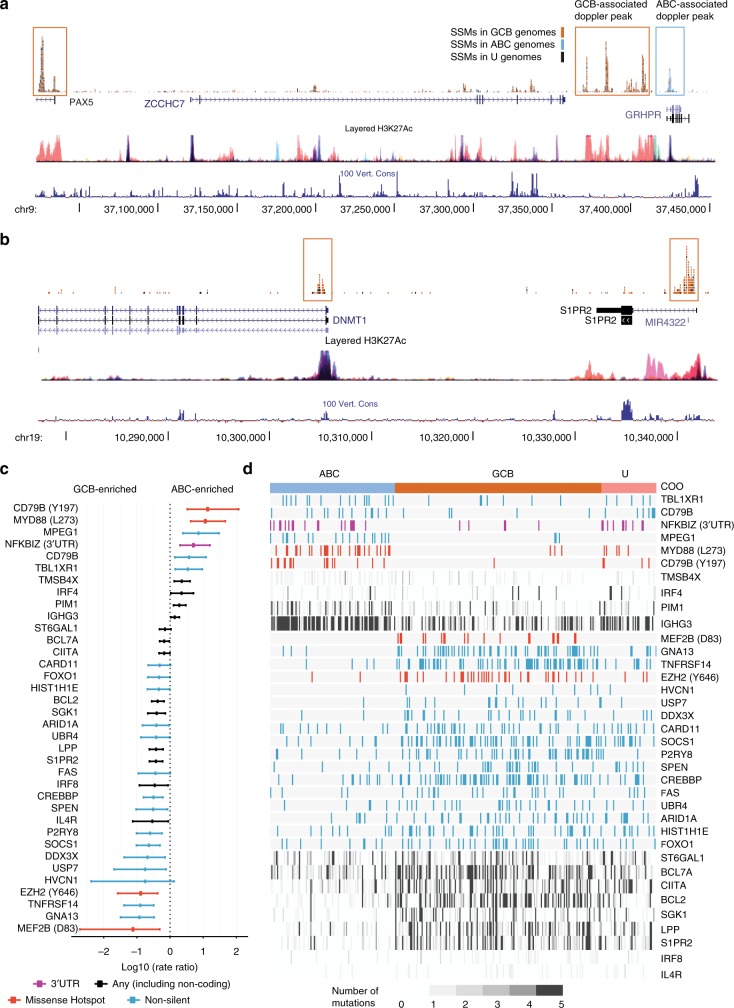
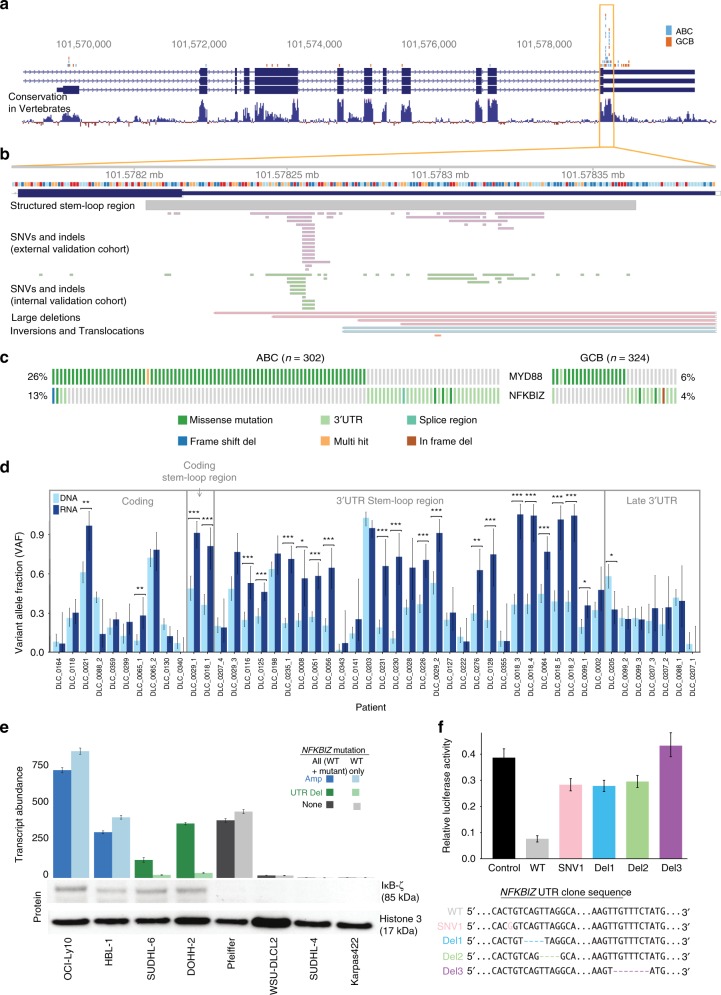
Diffuse large B-cell lymphoma (DLBCL) is an aggressive cancer originating from mature B-cells. Prognosis is strongly associated with molecular subgroup, although the driver mutations that distinguish the two main subgroups remain poorly defined. Through an integrative analysis of whole genomes, exomes, and transcriptomes, we have uncovered genes and non-coding loci that are commonly mutated in DLBCL. Our analysis has identified novel cis-regulatory sites, and implicates recurrent mutations in the 3' UTR of NFKBIZ as a novel mechanism of oncogene deregulation and NF-κB pathway activation in the activated B-cell (ABC) subgroup. Small amplifications associated with over-expression of FCGR2B (the Fcγ receptor protein IIB), primarily in the germinal centre B-cell (GCB) subgroup, correlate with poor patient outcomes suggestive of a novel oncogene. These results expand the list of subgroup driver mutations that may facilitate implementation of improved diagnostic assays and could offer new avenues for the development of targeted therapeutics.


Conflict of interest statement

The authors declare no competing interests.

Figures

Fig. 1
Fig. 1
Rainstorm and mutation signature analysis of DLBCL genomes. a An overview of mutation peaks and the rainstorm representation of cohort-wide inter-mutation distance for chromosome 16. Peaks identified by the Doppler algorithm that could be attributed to a nearby gene are labelled below. Known aSHM targets such as CIITA and IRF8 are among the most visible peaks in the Rainstorm view. b Our de novo inference of mutation signatures from the entire cohort revealed 11 robust signatures. Each signature was assigned to a reference signature from the curated set of 30 signatures in the Catalogue of Somatic Mutations in Cancer (COSMIC) database based on cosine similarity. The individual pie charts represent the strength of this similarity. The rows are arranged such that those with weaker similarity to a known signature are near the bottom. c A heat map showing the exposure of all 11 signatures in the genomes. Cases (columns) and signatures (rows) are ordered based on hierarchical clustering on the relative exposures. d Comparison of the exposure for the signatures in GCB and ABC cases including the four signatures with significantly higher exposure in GCB cases (indicated with an asterisk). The lower, middle and upper boxplot hinges correspond to the 25th, 50th and 75th percentiles, respectively. The boxplot whiskers extend outwards past the hinges up to the inter-quartile range×1.5 or the farthest value, whichever is closest
Fig. 2
Fig. 2
Differences in mutational representation between DLBCL molecular subgroups. a An enhancer proximal to PAX5 was preferentially mutated in GCB cases. A nearby peak in GRHPR near PAX5 was more commonly mutated in ABC cases. Non-coding mutation of the enhancer proximal to PAX5 has been reported in CLL but has not, to our knowledge, been described in other lymphoid cancers. The mutation pattern in DLBCL resembles that of other super-enhancers (Supplementary Figure 6B). b S1PR2 is a known target of aSHM, and the mutations mainly affect the first intron. DNMT1 is adjacent to S1PR2 and has a similar mutation pattern. Both of these peaks were enriched for mutations in GCB, indicating the potential for co-regulation of these genes using a common set of regulatory regions. c Coding and non-coding mutations that may be associated with either ABC or GCB COO are shown based on our recurrence cohort and are ordered on the strength of the association. For genes with missense mutation hot spots or (for NFKBIZ) a 3′ UTR hot spot, only mutations affecting that region were considered (indicated in parentheses beside the gene). Either hot spot, coding, or all mutations were used for this calculation, depending on the gene, as indicated in the legend. d The mutations detected in these genes are shown for each patient in our validation cohort. For genes affected by aSHM, mutations are represented using grey scale to indicate the number of mutations detected in each patient
Fig. 3
Fig. 3
Mutations affecting the NFKBIZ locus and functional effects on mRNA and protein levels. a NFKBIZ mutations were predominantly found within a highly conserved region of the 3′ UTR and were significantly enriched in ABC cases (blue) relative to GCB cases (orange). b A detailed view of the mutated region including the location predicted to have conserved structure (in grey). The pattern of mutations is similar in both the internal validation cohort (322 cases) and the external validation cohort (984 cases). c Mutations in NFKBIZ and MYD88 within ABC and GCB cases in the larger external validation cohort. The same trend of mutual exclusivity was observed in both validation cohorts. d Comparison of mutant variant allele fractions (VAFs) from DNA sequencing and RNA-seq of patient samples with NFKBIZ mutations. VAFs higher in RNA relative to the corresponding DNA indicates allelic imbalance favouring the mutant allele. Significant differences are indicated (*P < 0.05, **P < 0.01, ***P < 0.001, Wilcoxon rank-sum test). e We applied a custom ddPCR assay to eight DLBCL cell lines to determine NFKBIZ mRNA expression levels. Mutant cell lines consistently showed increased NFKBIZ mRNA, and we could attribute this to the mutant allele in lines with 3′ UTR mutations (green). Cell line IκB-ζ expression was assessed by western blot. Only mutant cell lines (green and blue) showed increased protein. f Luciferase reporter assay results show reduced protein expression in the presence of wild-type UTR with restored expression in mutant constructs. Luciferase expression is normalised to a construct containing a latter portion of the UTR. Error bars represent s.d. from three replicates
Fig. 4
Fig. 4
Somatic and germline events affecting the Fcγ receptor locus. a The genes in the locus are shown with the recent duplication delineated in yellow and blue. Binned read depth from tumours is summarised using vertical bars. Germline CNVs, such as the gain and deletion shown in orange, are common in this region but can be readily distinguished from somatic events in paired analyses. In pink are four examples of somatic FCGR2B amplifications. FCRLA is completely or partially co-amplified in these. Blue arrows indicate breakpoints identified through visual inspection of data. Horizontal bars delineate the coordinates inferred to be contained within the amplified region. A break in the blue bar corresponding to approximately diploid coverage is indicative of the amplification affecting an allele representing the common deletion CNV. b In our validation cohort, we used custom ddPCR and targeted hybridisation capture to infer the presence of gains, deletions, and amplifications. Due to a lack of constitutional DNA for the validation cohort, we are unable to determine the proportion of single-copy gains and losses that can be attributed to common germline CNVs. The expression of each Fcγ receptor and FCRLA genes in the locus is shown with the cases separated by copy number state. Clustering on the expression of the four genes affected by amplifications groups amplified cases alongside some tumours with gains or no alteration detected, indicating the potential for additional avenues leading to FCGR2B over-expression. c Although rare overall, cases with the amplification showed a significantly shorter DSS and TTP (P = 0.012 and 0.044, respectively; log-rank test). d FCGR2B expression alone was also significantly associated with DSS and TTP within GCB cases. Specifically, stratifying on median expression or at any cut point above shows that GCB cases with higher FCGR2B exhibit significantly shorter TTP (P = 4.8 × 10−3, log-rank test), although DSS differences require a more stringent cutoff (see also Supplementary Figure 10)

References

    1. Wright G, et al. A gene expression-based method to diagnose clinically distinct subgroups of diffuse large B cell lymphoma. Proc. Natl Acad. Sci. USA. 2003;100:9991–9996. doi: 10.1073/pnas.1732008100. - DOI - PMC - PubMed
    1. Morin RD, et al. Frequent mutation of histone-modifying genes in non-Hodgkin lymphoma. Nature. 2011;476:298–303. doi: 10.1038/nature10351. - DOI - PMC - PubMed
    1. Ngo VN, et al. Oncogenically active MYD88 mutations in human lymphoma. Nature. 2011;470:115–119. doi: 10.1038/nature09671. - DOI - PMC - PubMed
    1. Davis RE, et al. Chronic active B-cell-receptor signalling in diffuse large B-cell lymphoma. Nature. 2010;463:88–92. doi: 10.1038/nature08638. - DOI - PMC - PubMed
    1. Lenz G, et al. Oncogenic CARD11 mutations in human diffuse large B cell lymphoma. Science. 2008;319:1676–1679. doi: 10.1126/science.1153629. - DOI - PubMed

Publication types

MeSH terms