

Review
doi: 10.1016/j.csbj.2018.01.001.
eCollection 2018.
Machine Learning Methods for Histopathological Image Analysis
Affiliations
- PMID: 30275936
- PMCID: PMC6158771
- DOI: 10.1016/j.csbj.2018.01.001
Item in Clipboard
Review
Machine Learning Methods for Histopathological Image Analysis
Comput Struct Biotechnol J.
.
Abstract
Abundant accumulation of digital histopathological images has led to the increased demand for their analysis, such as computer-aided diagnosis using machine learning techniques. However, digital pathological images and related tasks have some issues to be considered. In this mini-review, we introduce the application of digital pathological image analysis using machine learning algorithms, address some problems specific to such analysis, and propose possible solutions.
Keywords: Computer assisted diagnosis; Deep learning; Digital image analysis; Histopathology; Machine learning; Whole slide images.
Figures
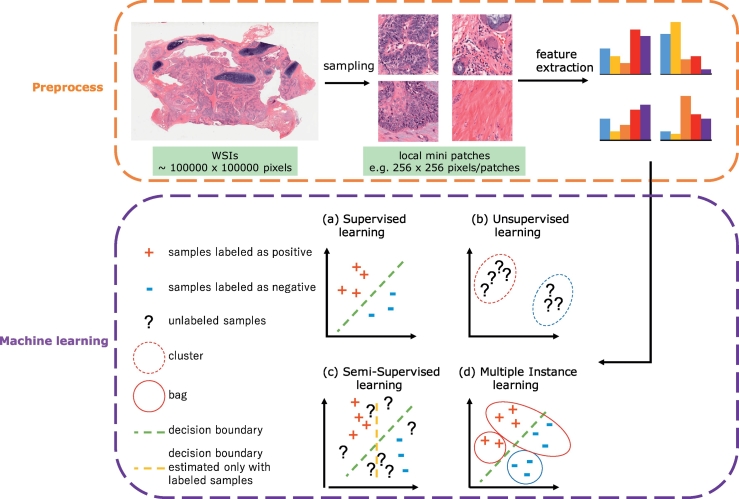
Typical steps for machine learning in digital pathological image analysis. After preprocessing whole slide images, various types of machine learning algorithms could be applied including (a) supervised learning (see Section 2), (b) unsupervised learning (see Section 2), (c) semi-supervised learning (see Section 4.2.2), and (d) multiple instance learning (see Section 4.2.2). The histopathological images are adopted from The Cancer Genome Atlas (TCGA) [33].
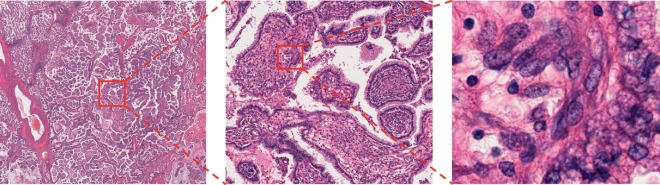
Multiple magnification levels of the same histopathological image. Right images show the magnified region indicated by red box on the left images. Leftmost image clearly shows papillary structure, and rightmost image clearly shows nucleus of each cell. The histopathological images are adopted from TCGA [33].
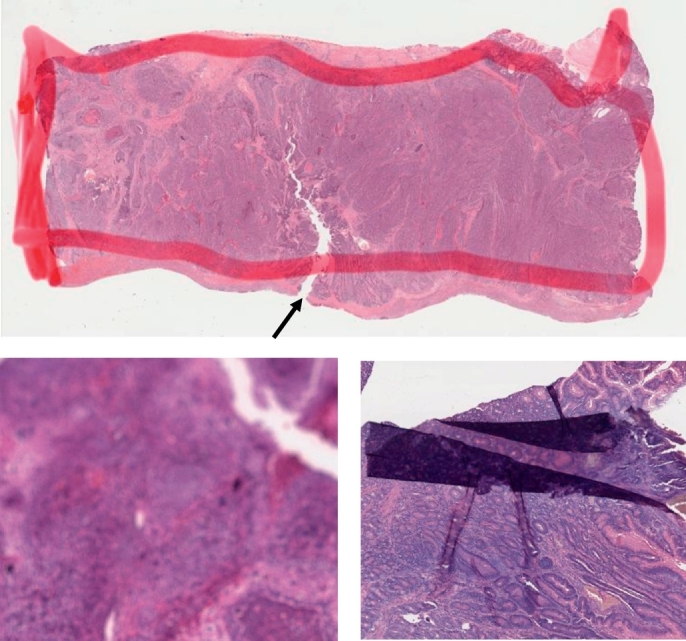
Artifacts in WSIs. Top: tumor region is outlined with red marker. The arrow indicates a tear possibly formed during the tissue preparation process. Left bottom: blurred image. Right bottom: folded tissue section. The histopathological images are adopted from TCGA [33].
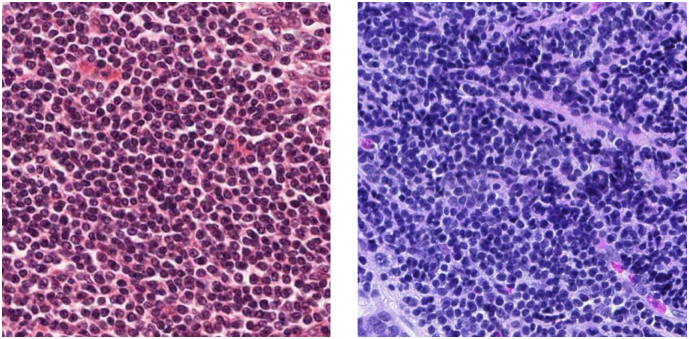
Color variation of histopathological images. Both of these two images show lymphocytes. The histopathological images are adopted from TCGA [33].
References
Publication types
LinkOut - more resources
Full Text Sources
Other Literature Sources
Molecular Biology Databases