. 2018 Sep 21:4:37.
doi: 10.1038/s41420-018-0104-z. eCollection 2018.

Misoprostol regulates Bnip3 repression and alternative splicing to control cellular calcium homeostasis during hypoxic stress

Affiliations

Misoprostol regulates Bnip3 repression and alternative splicing to control cellular calcium homeostasis during hypoxic stress

Jared T Field et al. Cell Death Discov. .

Erratum in

Abstract

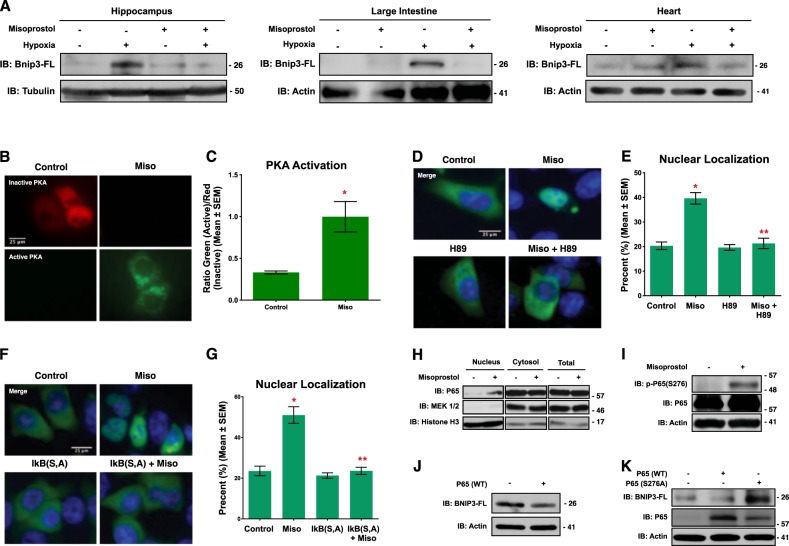
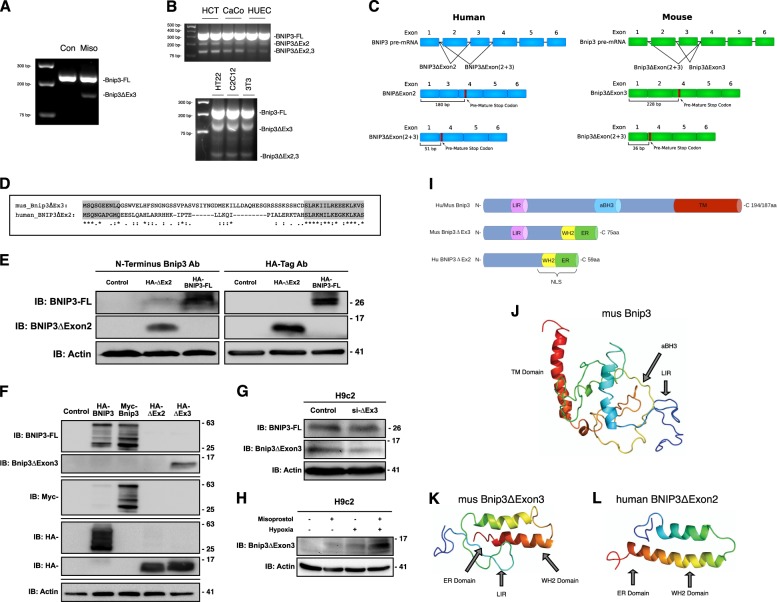
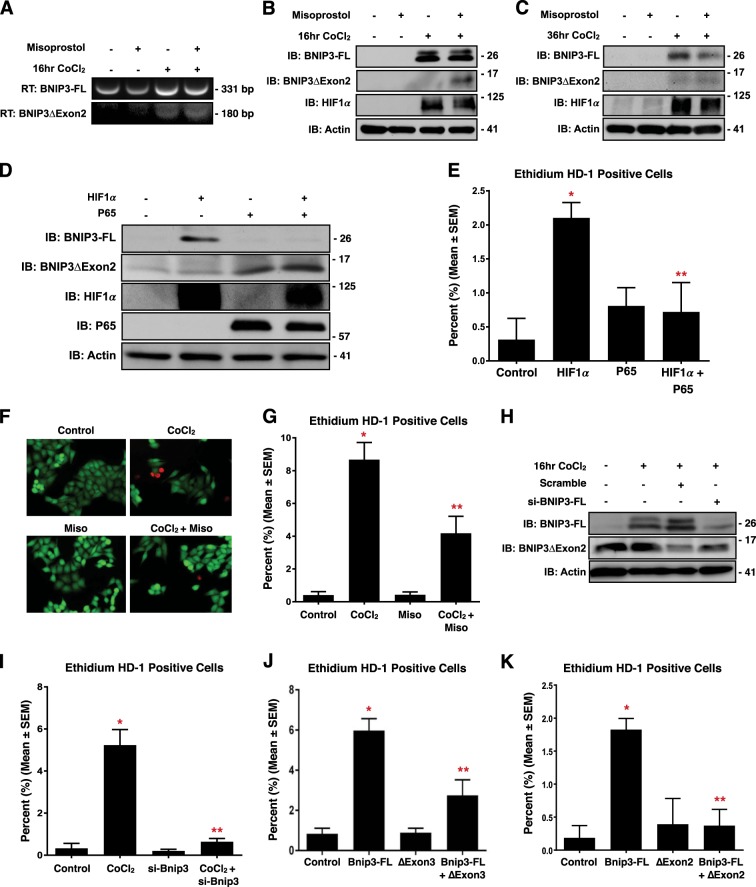
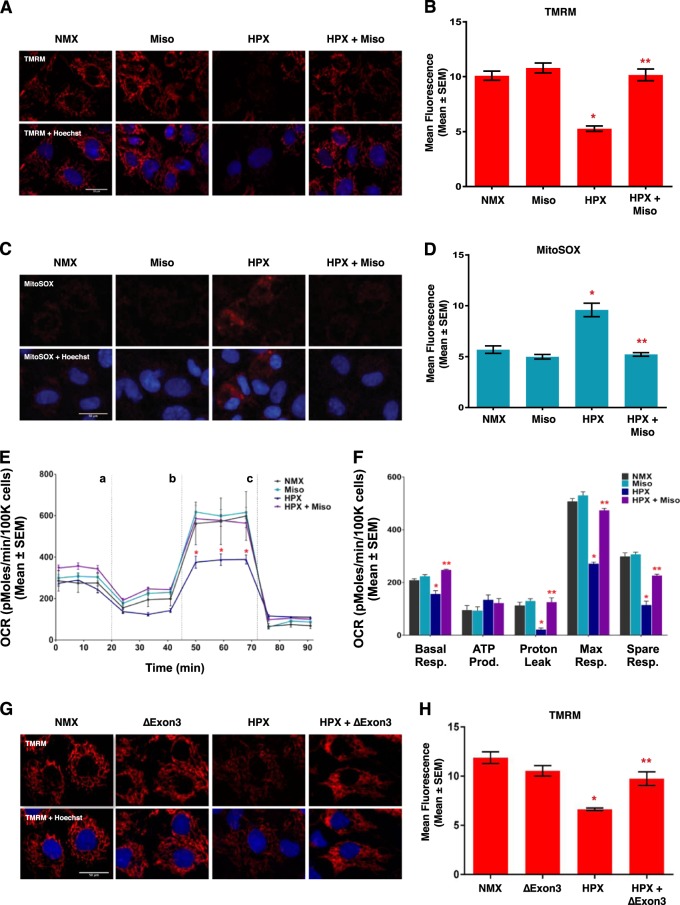
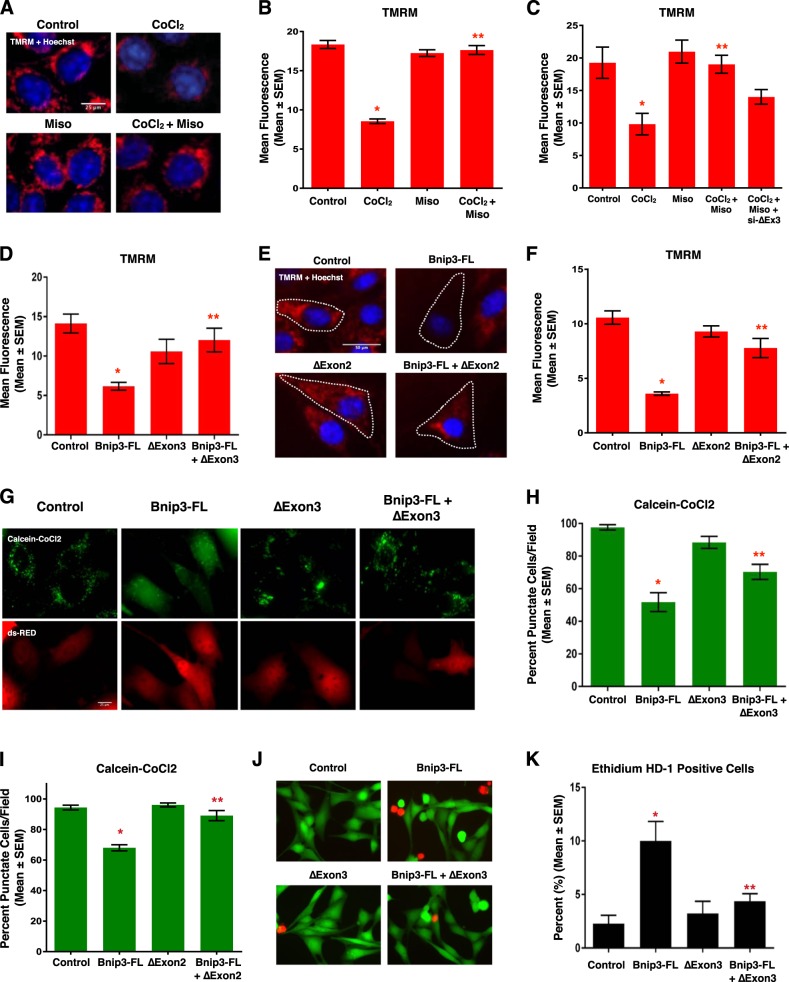
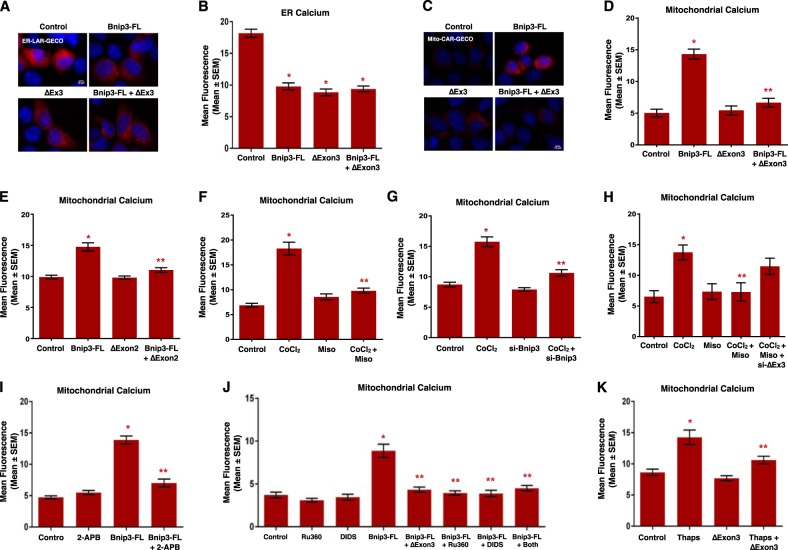
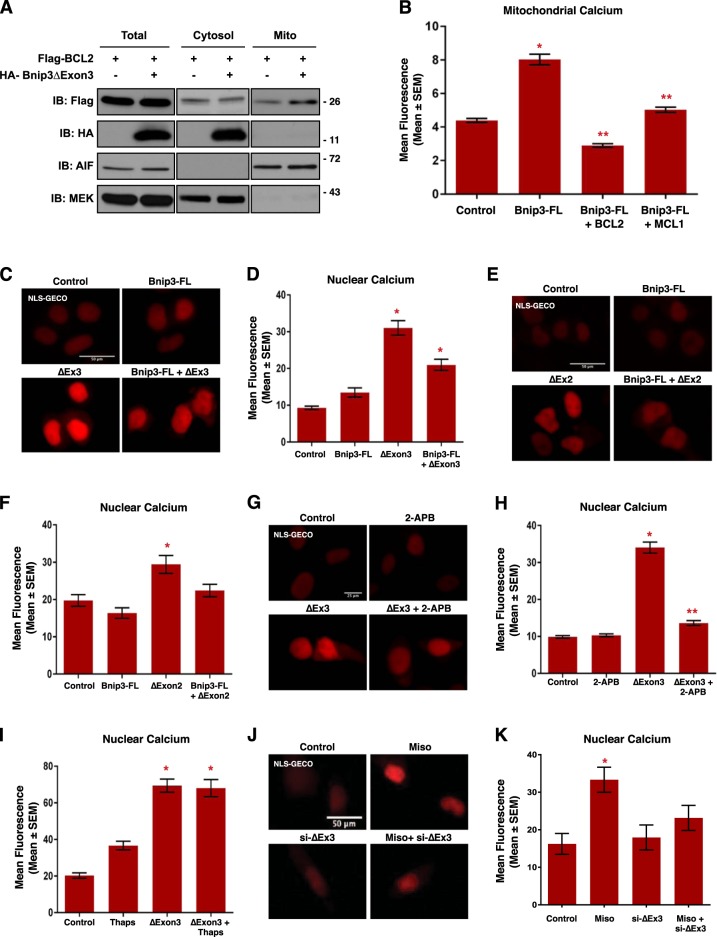
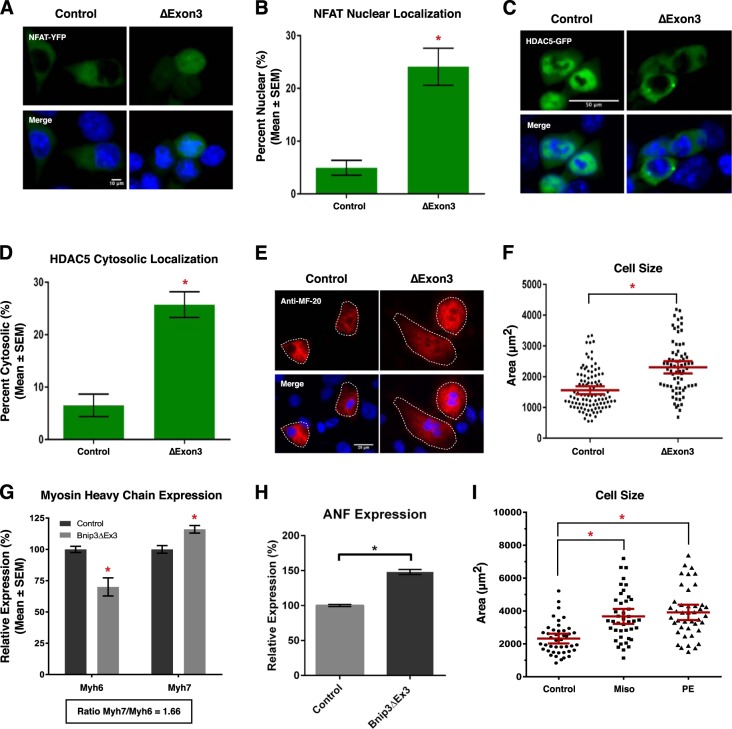
The cellular response to hypoxia involves the activation of a conserved pathway for gene expression regulated by the transcription factor complex called hypoxia-inducible factor (HIF). This pathway has been implicated in both the adaptive response to hypoxia and in several hypoxic-ischemic-related pathologies. Perinatal hypoxic injury, often associated with prematurity, leads to multi-organ dysfunction resulting in significant morbidity and mortality. Using a rodent model of neonatal hypoxia and several representative cell lines, we observed HIF1α activation and down-stream induction of the cell death gene Bnip3 in brain, large intestine, and heart which was mitigated by administration of the prostaglandin E1 analog misoprostol. Mechanistically, we determined that misoprostol inhibits full-length Bnip3 (Bnip3-FL) expression through PKA-mediated NF-κB (P65) nuclear retention, and the induction of pro-survival splice variants. We observed that the dominant small pro-survival variant of Bnip3 in mouse cells lacks the third exon (Bnip3ΔExon3), whereas human cells produce a pro-survival BNIP3 variant lacking exon 2 (BNIP3ΔExon2). In addition, these small Bnip3 splice variants prevent mitochondrial dysfunction, permeability transition, and necrosis triggered by Bnip3-FL by blocking calcium transfer from the sarco/endoplasmic reticulum to the mitochondria. Furthermore, misoprostol and Bnip3ΔExon3 promote nuclear calcium accumulation, resulting in HDAC5 nuclear export, NFAT activation, and adaptive changes in cell morphology and gene expression. Collectively, our data suggests that misoprostol can mitigate the potential damaging effects of hypoxia on multiple cell types by activating adaptive cell survival pathways through Bnip3 repression and alternative splicing.


Conflict of interest statement

The authors declare that they have no conflict of interest.

Figures

Fig. 1
Fig. 1. Misoprostol opposes hypoxia-induced Bnip3-FL expression.
a Immunoblot for Bnip3-FL in protein extracts from the hippocampus, large intestine, and heart of PND10 rat pups exposed to hypoxia (10% O2) ± misoprostol for 7 days. b HCT-116 cells were transfected with PKA biosensor (pPHT-PKA), and treated with 10 μM misoprostol or vehicle for 2 h. Cells were imaged by standard fluorescence microscopy. c Quantification of fluorescent images in b by measuring the ratio of green (active) to red (inactive) fluorescent signal, normalized to cell area, quantified in 10 random fields. d HCT-116 cells were transfected with GFP-P65 (green) and were treated with 10 μM misoprostol ± 10 μM H89 for 20 h. Cells were stained with Hoechst (blue) and imaged by standard fluorescence microscopy. e Quantification of fluorescent images in d by calculating the percentage of cells with nuclear P65 signal over 10 random fields. f HCT-116 cells were transfected with IkBa(SS32,36AA) [indicated as IkB (S, A)] or an empty vector control. GFP-P65 (green) was used to indicate subcellular P65 localization in all conditions. Cells were treated with 10 μM misoprostol or vehicle control for 20 h. Cells were stained with Hoechst (blue) and imaged by standard fluorescence microscopy. g Quantification of fluorescent images in d by calculating the percentage of cells with nuclear P65 signal over 10 random fields. h HCT-116 cells were treated with 10 μM misoprostol or vehicle for 20 h, during extraction proteins were fractioned according to their sub-cellular compartment. Protein extracts were immunoblotted, as indicated. i 3T3 cells were treated with 10 μM misoprostol or vehicle control for 4 h. Protein extracts were immunoblotted as indicated. j HCT-116 cells were transfected with wild-type P65 or empty vector control. Extracts were immunoblotted, as indicated. k HCT-116 cells were transfected with P65 constructs for 20 h. Extracts were immunoblotted, as indicated. Data are represented as mean ± S.E.M. *P < 0.05 compared with control, while **P < 0.05 compared with treatment, determined by 1-way ANOVA or by unpaired t-test
Fig. 2
Fig. 2. Misoprostol alters the splicing of Bnip3.
a RT-PCR for Bnip3-FL and Bnip3ΔExon3 in the heart of PND10 rat pups treated with misoprostol for 7 days. b RT-PCR for Bnip3 isoforms comparing expression patterns between human and mouse cell lines. c Bnip3 splicing diagram showing BNIP3ΔExon2 and Bnip3ΔExon3, indicating the differences in splicing between human and mouse. d Amino acid sequence alignment for human BNIP3ΔExon2 and mouse Bnip3ΔExon3. e Immunoblot showing that a commercially available antibody targeted to the amino-terminus (N-Terminus) of BNIP3 (CST #44060) can detect overexpressed HA-BNIP3-FL and HA-BNIP3ΔExon2. f Immunoblot demonstrating the specificity of our custom antibody targeted to the amino-terminus (N-Terminus) of BNIP3, where the antibody is able to detect overexpressed HA-BNIP3-FL (Human), Myc-Bnip3-FL (Mouse), and HA- Bnip3ΔExon3 (Mouse), but not HA-BNIP3ΔExon2 (Human). g Immunoblot demonstrating the specificity of si-BNIP3ΔExon3 (indicated as si-ΔEx3), shown using our custom antibody targeted to the amino-terminus (N-Terminus) of Bnip3. h H9c2 cells were exposed to 1% hypoxia for 24-h, with and without misoprostol treatment (10 μM). Extracts were western blotted as indicated. i Linear motif diagram for Bnip3-FL, human BNIP3ΔExon2, and mouse Bnip3ΔExon3. j Model of Mus Bnip3-FL indicating locations of the transmembrane (TM) domain, atypical BH3 domain (aBH3), and LC3-Interacting region (LIR) present on this isoform. k, l Comparison of Mus Bnip3ΔExon3 and human BNIP3ΔExon2, indicating the locations of the predicted ER domains, WH2 domains, nuclear localization sequence (NLS), and the Mus Bnip3ΔExon3 specific LC3-Interacting region (LIR)
None
Fig. 3. HIF1α and P65 drive expression of pro-survival BNIP3 splice variants.
a HCT-116 cells were treated with 200 μM cobalt chloride ± 10 μM misoprostol or vehicle control for 20 h. RNA was isolated and RT-PCR was performed for BNIP3 isoforms. b HCT-116 cells were treated as in a. Protein extracts were immunoblotted, as indicated. c Immunoblot of protein extracts from HCT-116 cells treated with misoprostol and CoCl2 in for 36 h. d HCT-116 cells were transfected with HIF1α ± P65. Protein extracts were immunoblotted, as indicated. e Quantification calcein-AM and ethidium homodimer-1 stained HCT-116 cells transfected with HIF1α and/or P65. f HCT-116 cells treated with 200 μM cobalt chloride ± 10 μM misoprostol or vehicle control for 20 h. Live cells were stained were stained with calcein-AM (green)and necrotic cells were stained with ethidium homodimer-1 (red), cells were imaged by standard fluorescence microscopy. g Fluorescent images were quantified by calculating the percent of necrotic cells (ethidium homodimer-1 positive) cells in 10 random fields. h Immunoblot of HCT-116 cells transfected with si-BNIP3-FL or scrambled control. Cells were treated with 200 μM cobalt chloride or vehicle control for 20 h. i HCT-116 cells treated as in h and cells were stained as in f, and quantified as indicated in g. j Quantification of HCT-116 cells transfected with Bnip3-FL, Bnip3ΔExon3 or empty vector control. Cells were stained, and quantified as indicated in f. k Quantification of HCT-116 cells transfected with Bnip3-FL, BNIP3ΔExon2 or an empty vector control. Cells were stained, and quantified as indicated in f. Data are represented as mean ± S.E.M. *P < 0.05 compared with control, while **P < 0.05 compared with treatment, determined by 1-way ANOVA
Fig. 4
Fig. 4. Misoprostol opposes hypoxia-induced mitochondrial dysfunction in primary ventricular neonatal cardiomyocytes.
a Primary ventricular neonatal cardiomyocytes (PVNM) cells were treated with 10 μM misoprostol (Miso) ± 10% O2 (HPX) for 48 h. Cells were stained with TMRM (red) and Hoechst (blue) and imaged by standard fluorescence microscopy. b Quantification of TMRM in a, red fluorescent signal was normalized to cell area and quantified in 10 random fields. c PVNM cells were treated as described in a. Cells were stained with MitoSOX (red) to evaluate mitochondrial superoxides and Hoechst (blue) and imaged by standard fluorescence microscopy. d Quantification of (c), red fluorescent signal was normalized to cell area and quantified in 10 random fields. e Oxygen consumption rate (OCR) was evaluated on a Seahorse XF-24 in PVNM. To evaluate mitochondrial function, wells were injected with oligomycin (1 μM) (a), FCCP (1 μM) (b), and antimycin A (1 μM) and rotenone (1 μM) (c). f Calculated respiration rates from (e). g PVNM cells were transduced with Bnip3ΔExon3 ± 10% O2 (HPX) for 48 h. Cells were stained with TMRM (red) and Hoechst (blue) and imaged by standard fluorescence microscopy. h Quantification of g, red fluorescent signal was normalized to cell area and quantified in 10 random fields. Data are represented as mean ± S.E.M. *P < 0.05 compared with control, while **P < 0.05 compared with hypoxia treatment, determined by 1-way ANOVA
Fig. 5
Fig. 5. Bnip3 splice variants oppose mitochondrial perturbations.
a HCT-116 cells treated with 200 μM cobalt chloride ± 10 μM misoprostol or vehicle control for 20 h. Cells were stained with TMRM (red) and Hoechst (blue) and imaged by standard fluorescence microscopy. b Quantification of TMRM in a, red fluorescent signal was normalized to cell area and quantified in 10 random fields. c Quantification of H9c2 cells treated with 200 μM cobalt chloride ± 10 μM misoprostol or vehicle control for 20 h, and transfected with si-Bnip3ΔExon3 or a scrambled control. Cells were stained as in a and quantified as in b. d Quantification of H9c2 cells was transfected with Bnip3-FL, Bnip3ΔExon3, or an empty vector control. TMRM staining was quantified as in b. e H9c2 cells were transfected with Bnip3-FL, BNIP3ΔExon2, or empty vector control. Outlines indicate CMV-GFP positive cells, included to identify transfected cells. Cells were stained as in a. f Quantification of (e), red fluorescent signal was normalized to cell area and quantified in 10 random fields. g H9c2 cells were transfected with Bnip3-FL, Bnip3ΔExon3, or empty vector control. CMV-dsRed (red) was used to identify transfected cells. Cells were stained with calcein-AM and cobalt chloride (CoCl2, 5 μM) to assess permeability transition. h Quantification of g by calculating the percentage of cells with punctate calcein signal in 10 random fields. i Quantification of H9c2 cells transfected with Bnip3-FL, BNIP3ΔExon2, or empty vector control. CMV-dsRed was used to identify transfected cells. Cells were stained and quantified as indicated in h. j H9c2 cells transfected with Bnip3-FL, BNIP3ΔExon3, or empty vector control. Live cells were stained with calcein-AM (green), and necrotic cells were stained with ethidium homodimer-1 (red), cells were imaged by standard fluorescence microscopy. k Fluorescent images in j were quantified by calculating the percent of necrotic cells (ethidium homodimer-1 positive) cells in 10 random fields. Data are represented as mean ± S.E.M. *P < 0.05 compared with control, while **P < 0.05 compared with Bnip3-FL treatment, determined by 1-way ANOVA
Fig. 6
Fig. 6. Bnip3 splice variants differentially regulate subcellular calcium micro-domains.
a HCT-116 cells were transfected with Bnip3-FL, Bnip3ΔExon3, or an empty vector control. ER-LAR-GECO (red) was used to indicate endoplasmic reticulum calcium content in all conditions. Cells were stained with Hoechst (blue) and imaged by standard fluorescence microscopy. b Quantification of a, where red fluorescent signal was normalized to cell area and quantified in 10 random fields. c HCT-116 cells were transfected with Bnip3-FL, Bnip3ΔExon3, or an empty vector control. Mito-CAR-GECO (red) was used to indicate mitochondrial calcium content in all conditions. Cells were stained and imaged as in a. d Quantification of c. e Quantification of HCT-116 cells transfected with Mito-CAR-GECO, Bnip3-FL, BNIP3ΔExon2, or an empty vector control. f Quantification of HCT-116 cells transfected with Mito-CAR-GECO and treated with 200 μM cobalt chloride ± 10 μM misoprostol or vehicle control for 20 h. g Quantification of HCT-116 cells transfected with Mito-CAR-GECO, si-BNIP3-FL, or scramble control. Cells were treated with 200 μM cobalt chloride or vehicle control for 16 h. h Quantification of H9c2 cells treated with 200 μM cobalt chloride ± 10 μM misoprostol or vehicle control for 20 h, and transfected with Mito-CAR-GECO and si-Bnip3ΔExon3 or a scrambled control. i Quantification of HCT-116 cells transfected with Mito-CAR-GECO, Bnip3-FL ± 2 μM 2-APB for 16 h. j Quantification of HCT-116 cells treated with 10 μM DIDs and/or 10 μM Ru360 for 16 h (where both indicates DIDs + Ru360) and transfected Mito-CAR-GECO, Bnip3-FL, Bnip3ΔExon3 and/or empty vector control. k Quantification of HCT-116 cells treated with 1 μM Thapsigargin (Thaps) for 4 h and transfected with Mito-CAR-GECO, Bnip3ΔExon3, or empty vector control. Data are represented as mean ± S.E.M. *P < 0.05 compared with control, while **P < 0.05 compared with treatment, determined by 1-way ANOVA
Fig. 7
Fig. 7. Bnip3 splice variants regulate nuclear calcium content.
a HCT-116 cells were transfected with Flag-BCL2 and HA-Bnip3ΔExon3, as indicated. Protein extracts were subjected to fractionation and were immunoblotted, as indicated. b HCT-116 cells were transfected with Mito-CAR-GECO, Bnip3-FL, Flag-BCL2, or MCL-1, as indicated. Fluorescence was normalized to cell area and quantified in 10 random fields. c HCT-116 cells were transfected with Bnip3-FL, Bnip3ΔExon3, or an empty vector control. NLS-R-GECO (red) was used to indicate nuclear calcium content. Cells were stained with Hoechst (blue) and imaged by standard fluorescence microscopy. d Quantification of (c), where red fluorescent signal was normalized to nuclear area and quantified in 10 random fields. e HCT-116 cells were transfected with NLS-R-GECO, Bnip3-FL, BNIP3ΔExon2, or an empty vector control. f Quantification of e. g HCT-116 cells were transfected with NLS-R-GECO, Bnip3ΔExon3 ± 2 μM 2-APB for 16 h. h Quantification of g. i HCT-116 cells transfected with NLS-R-GECO, Bnip3ΔExon3 ± 1 μM Thapsigargin (Thaps) for 4 h. j H9c2 cells transfected NLS-R-GECO, si-Bnip3ΔExon3 (indicated as si-ΔEx3) or scrambled control, and treated with 10 μM misoprostol or vehicle control for 20 h. Cells were stained with Hoechst (blue) and imaged by standard fluorescence microscopy. k Quantification of j. Data are represented as mean ± S.E.M. *P < 0.05 compared with control, while **P < 0.05 compared with treatment, determined by 1-way ANOVA or unpaired t-test
Fig. 8
Fig. 8. Bnip3ΔExon3 regulates cardiomyocyte hypertrophy.
a HCT-116 cells were transfected with Bnip3ΔExon3 or an empty vector control. NFAT-YFP (green) was used to indicate subcellular localization of NFAT. Cells were stained with Hoechst (blue) and imaged by standard fluorescence microscopy. b Quantification of fluorescent images in a, by calculating the percentage of cells with nuclear NFAT signal over 10 random fields. c HCT-116 cells were transfected with Bnip3ΔExon3 or an empty vector control. HDAC5-GFP (green) was used to indicate subcellular localization of HDAC5. Cells were stained and imaged as in a. d Quantification of fluorescent images in (c), by calculating the percentage of cells with cytosolic HDAC5 signal over 10 random fields. e Primary ventricular neonatal cardiomyocytes (PVNM) cells were transduced with Bnip3ΔExon3 or control virus. Cells were fixed, stained with Hoechst (blue), and probed for myosin heavy chain (Anti-MF-20, red) expression. f Quantification of e, where cell size (μm2) was calculated based on the area of the red fluorescent signal and quantified in 10 random fields. g, h PVNM cells treated as in e. RNA was isolated and qRT-PCR was performed for myosin heavy chain isoform and ANF expression. i Quantification of PVNM cells treated with 10 μM misoprostol, 10 μM phenylephrine (PE), or vehicle control for 20 h. Cells were stained with calcein-AM (green) and assessed for cell size. Cell size (μm2) was calculated based on the area of the green fluorescent signal and quantified in 10 random fields. Data are represented as mean ± S.E.M. *P < 0.05 compared with control, determined by unpaired t-test

References

    1. Douglas-Escobar M, Weiss MD. Hypoxic-ischemic encephalopathy: a review for the clinician. JAMA Pediatr. 2015;169:397–403. doi: 10.1001/jamapediatrics.2014.3269. - DOI - PubMed
    1. Neu J, Walker WA. Necrotizing enterocolitis. N. Engl. J. Med. 2011;364:255–264. doi: 10.1056/NEJMra1005408. - DOI - PMC - PubMed
    1. Wang H, Zhang SX, Hartnett ME. Signaling pathways triggered by oxidative stress that mediate features of severe retinopathy of prematurity. JAMA Ophthalmol. 2013;131:80–85. doi: 10.1001/jamaophthalmol.2013.986. - DOI - PMC - PubMed
    1. Dakshinamurti S. Pathophysiologic mechanisms of persistent pulmonary hypertension of the newborn. Pediatr. Pulmonol. 2005;39:492–503. doi: 10.1002/ppul.20201. - DOI - PubMed
    1. Armstrong K, Franklin O, Sweetman D, Molloy EJ. Cardiovascular dysfunction in infants with neonatal encephalopathy. Arch. Dis. Child. 2012;97:372–375. doi: 10.1136/adc.2011.214205. - DOI - PubMed