. 2018 Sep 17:5:124.
doi: 10.3389/fcvm.2018.00124. eCollection 2018.

Medial Hypoxia and Adventitial Vasa Vasorum Remodeling in Human Ascending Aortic Aneurysm

Affiliations

Medial Hypoxia and Adventitial Vasa Vasorum Remodeling in Human Ascending Aortic Aneurysm

Marie Billaud et al. Front Cardiovasc Med. .

Abstract

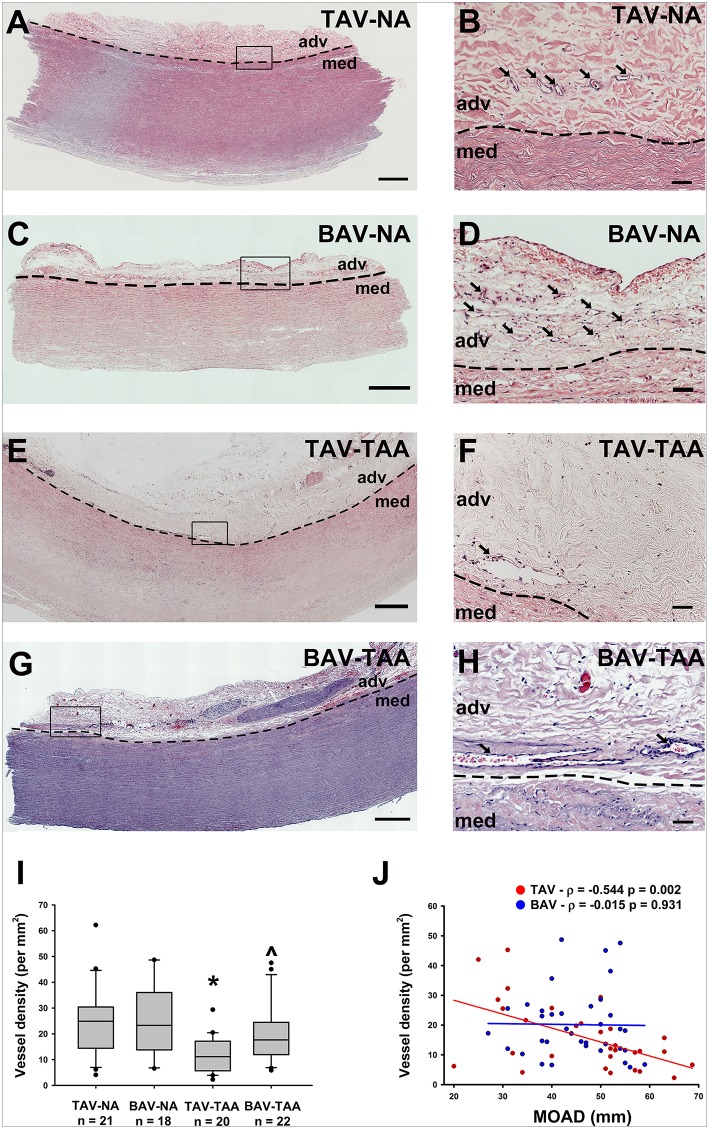
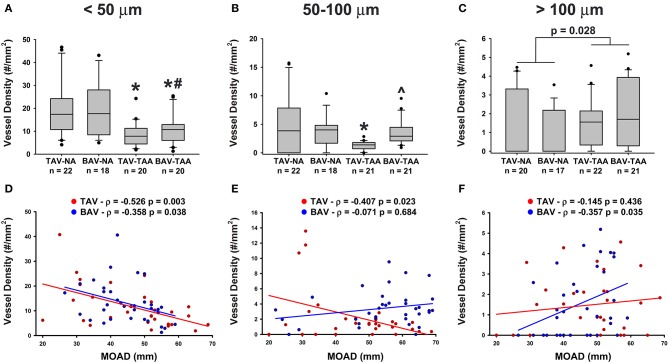
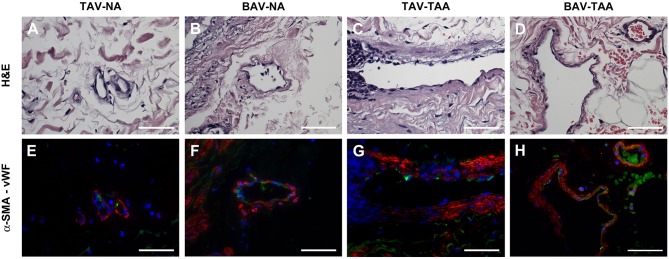
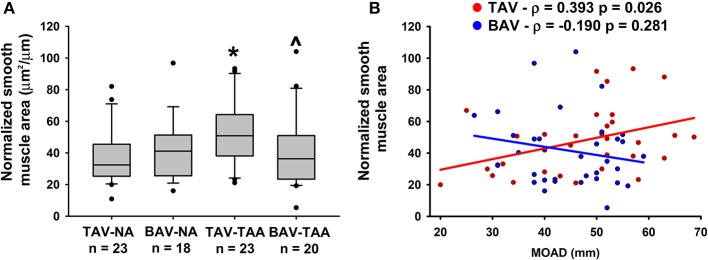
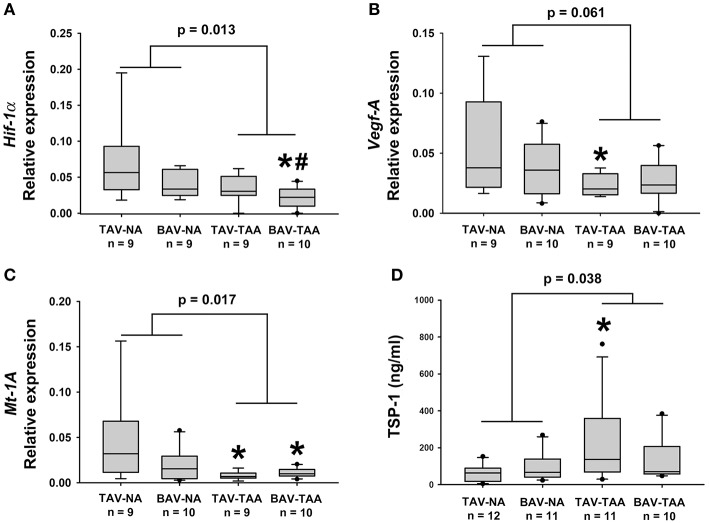
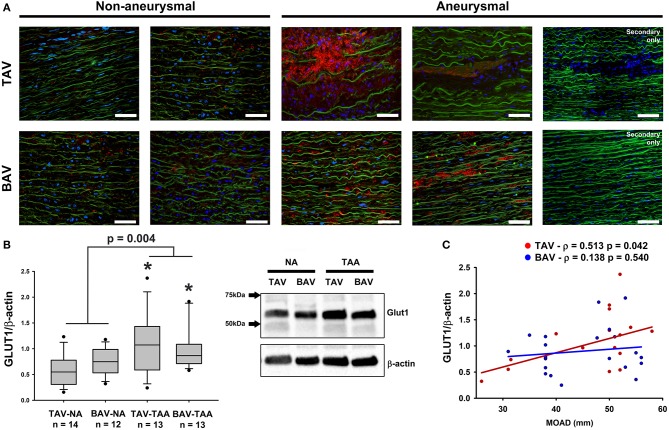
Human ascending aortic aneurysms characteristically exhibit cystic medial degeneration of the aortic wall encompassing elastin degeneration, proteoglycan accumulation and smooth muscle cell loss. Most studies have focused on the aortic media and there is a limited understanding of the importance of the adventitial layer in the setting of human aneurysmal disease. We recently demonstrated that the adventitial ECM contains key angiogenic factors that are downregulated in aneurysmal aortic specimens. In this study, we investigated the adventitial microvascular network (vasa vasorum) of aneurysmal aortic specimens of different etiology and hypothesized that the vasa vasorum is disrupted in patients with ascending aortic aneurysm. Morphometric analyses of hematoxylin and eosin-stained human aortic cross-sections revealed evidence of vasa vasorum remodeling in aneurysmal specimens, including reduced density of vessels, increased lumen area and thickening of smooth muscle actin-positive layers. These alterations were inconsistently observed in specimens of bicuspid aortic valve (BAV)-associated aortopathy, while vasa vasorum remodeling was typically observed in aneurysms arising in patients with the morphologically normal tricuspid aortic valve (TAV). Gene expression of hypoxia-inducible factor 1α and its downstream targets, metallothionein 1A and the pro-angiogenic factor vascular endothelial growth factor, were down-regulated in the adventitia of aneurysmal specimens when compared with non-aneurysmal specimens, while the level of the anti-angiogenic factor thrombospondin-1 was elevated. Immunodetection of glucose transporter 1 (GLUT1), a marker of chronic tissue hypoxia, was minimal in non-aneurysmal medial specimens, and locally accumulated within regions of elastin degeneration, particularly in TAV-associated aneurysms. Quantification of GLUT1 revealed elevated levels in the aortic media of TAV-associated aneurysms when compared to non-aneurysmal counterparts. We detected evidence of chronic inflammation as infiltration of lymphoplasmacytic cells in aneurysmal specimens, with a higher prevalence of lymphoplasmacytic infiltrates in aneurysmal specimens from patients with TAV compared to that of patients with BAV. These data highlight differences in vasa vasorum remodeling and associated medial chronic hypoxia markers between aneurysms of different etiology. These aberrations could contribute to malnourishment of the aortic media and could conceivably participate in the pathogenesis of thoracic aortic aneurysm.

Keywords: adventitia; aneurysm; angiogenesis; hypoxia; vasa vasorum.


Figures

Figure 1
Figure 1
Reduced vasa vasorum density in human ascending aortic adventitia of aneurysmal TAV patients. Representative H&E staining of specimens from a non-aneurysmal (NA) patient with a morphologically normal tricuspid aortic valve (TAV) (A, B) or with a bicuspid aortic valve (BAV) (C, D). Images in (E,F) show representative H&E staining of aneurysmal (TAA) specimens from a TAV patient and in (G,H), from a BAV patient. Images in (A,C,E,G) depict an aortic specimen that were captured with a 20X objective and tiled to comprise the entire section, scale bar = 500 μm. Panels (B,D,F,H) represent magnification of insets denoted in the corresponding image in the left panel and are representative of the observed reduced density of vasa vasorum (arrows) in aneurysmal specimens. Images were captured with a 20X objective, scale bar = 50 μm. Images of vasa vasorum in the adventitia (adv) were captured adjacent to the tunica media (med). Dashed line = adv-med border. (I) Quantification of vessel density as number of vessels per mm2 of adventitia. * and indicates p < 0.05 vs. TAV-NA and TAV-TAA, respectively and assessed with the Kruskal-Wallis test. (J) Graphical representation of vessel density as a function of the maximal orthogonal aortic diameter (MOAD) in TAV (red) and BAV (blue) specimens. ρ indicates the coefficient of correlation and p indicates the p-value obtained using a bivariate Pearson correlation analysis.
Figure 2
Figure 2
Increased vasa vasorum lumen area in human ascending aortic adventitia of aneurysmal patients. Representative images of aortic specimens stained with H&E collected from non-aneurysmal (NA) or aneurysmal (TAA) patients with a morphologically normal tricuspid aortic valve (TAV) (A,C) or with a bicuspid aortic valve (BAV) (B,D). Specimens were imaged with a 20X objective, scale bar = 50 μm. The border between the adventitia (adv) and the media (med) is denoted by a dashed line. Quantification of vasa vasorum lumen area (mm2) in the four patient cohorts is shown in (E). # indicates p < 0.05 vs. BAV-NA and was obtained using a Kruskal-Wallis test. The p-value indicated above the graph was determined using a Mann-Whitney test comparing data collected in all aneurysmal specimens to those collected in all non-aneurysmal specimens. Vessel density was expressed as a function of the maximal orthogonal aortic diameter (MOAD) in TAV (red) and BAV (blue) specimens (F). ρ indicates the coefficient of correlation and p indicates the p-value obtained using a bivariate Pearson correlation analysis.
Figure 3
Figure 3
Aneurysmal specimens are characterized by a lower density of small size vasa vasorum. (A–C) Quantification of small size (< 50 μm, A), mid-size (50–100 μm, B) and large (>100 μm, C) vasa vasorum density as number of vessels per mm2 of adventitia. *, #, and indicate p < 0.05 vs. TAV-NA, BAV-NA, and TAV-TAA, respectively and were obtained using a Kruskal-Wallis test. The p-value indicated above the graph in (C) was obtained using a Mann-Whitney test comparing data collected in all aneurysmal specimens to those collected in all non-aneurysmal specimens. (D–F) Graphical representation of small (D), mid-size (E), and large (F) vessel density as a function of the maximal orthogonal aortic diameter (MOAD) in TAV (red) and BAV (blue) patients. ρ indicates the coefficient of correlation and p indicates the p-value obtained using a bivariate Pearson correlation analysis.
Figure 4
Figure 4
Vasa vasorum in the adventitia of TAV-TAA specimens display smooth muscle remodeling. (A–D) H&E stained sections of non-aneurysmal (NA, A,B) and aneurysmal (TAA, C,D) specimens isolated from patients with TAV (A,C) or BAV (B,D). (E–H) Immunolabeling for α-SMA (red), Von Willebrand factor (vWF, green), and nuclei (DAPI, blue) performed on vessels displayed in A through D. All images were obtained with a 40X objective, scale bar = 50 μm.
Figure 5
Figure 5
Vasa vasorum wall thickening in the adventitia of TAV-TAA patients. (A) Quantification of vasa vasorum smooth muscle area from H&E stained sections and normalized to lumen diameter. * and indicate p < 0.05 vs. TAV-NA and TAV-TAA, respectively and were obtained using a Kruskal-Wallis test. (B) Graphical representation of the vasa vasorum wall thickness as a function of the maximal orthogonal aortic diameter (MOAD) in TAV (red) and BAV (blue) specimens. ρ indicates the coefficient of correlation and p indicates the p-value obtained using a bivariate Pearson correlation analysis.
Figure 6
Figure 6
Expression of angiogenesis and hypoxia-related target genes in human ascending aortic adventitia. Quantitative real-time PCR was employed to measure expression of Hif-1α (A), Vegf-A (B) and Mt-1A (C) in total mRNA isolated from adventitia of human ascending aortic specimens. Thrombospondin 1 (TSP1) levels were quantified via ELISA in 25 μg of adventitial lysates (D). * and # indicate p < 0.05 vs. TAV-NA and BAV-NA, respectively and were obtained using a Kruskal-Wallis test. The p-values indicated above the graphs were obtained using a Mann-Whitney test comparing data collected in all aneurysmal specimens to those collected in all non-aneurysmal specimens.
Figure 7
Figure 7
Detection of glucose transporter 1 (GLUT1) in the aortic media. (A) GLUT1 expression (red) was assessed via immunofluorescence on aortic cross section of aneurysmal and non-aneurysmal specimens excised from patients with TAV (top row) or BAV (bottom row). The elastin autofluorescence appears in green and DAPI-stained nuclei are shown in blue. Scale bar = 50 μm. (B) Quantification of GLUT1 expression via western blot on aortic media lysates of non-aneurysmal (NA) and aneurysmal (TAA) specimens from TAV and BAV patients. The intensity of the band corresponding to GLUT1 (54 kDa) was normalized to that of β-actin. * indicates p < 0.05 vs. TAV-NA and was obtained using a Kruskal-Wallis test. The p-value indicated above the graphs was obtained using a Mann-Whitney test comparing data collected in all aneurysmal specimens to those collected in all non-aneurysmal specimens. (C) Graphical representation of GLUT1 expression levels as a function of the maximal orthogonal aortic diameter (MOAD) in TAV (red) and BAV (blue) specimens. ρ indicates the coefficient of correlation and p denotes the p-value obtained using a bivariate Pearson correlation analysis.
Figure 8
Figure 8
Chronic inflammation in the ascending aortic adventitia of aneurysmal specimens. (A,B) Representative H&E staining of TAV-NA and BAV-NA, respectively where no inflammatory infiltrate was found. (C,D) Representative H&E staining of TAV-TAA and BAV-TAA exhibiting lymphoplasmacytic infiltration localized to small diameter vasa vasorum. Plasma cells are marked by arrowheads. These findings were more prevalent in specimens isolated from aneurysmal patients with TAV (E) and mostly absent from aneurysmal specimens of patients with BAV (F). Scale bar = 25 μm.

References

    1. Cabrera Fischer EI, Bia D, Camus JM, Zocalo Y, de Forteza E, Armentano RL. Adventitia-dependent mechanical properties of brachiocephalic ovine arteries in in vivo and in vitro studies. Acta Physiol (Oxf). (2006) 188:103–11. 10.1111/j.1748-1716.2006.01614.x - DOI - PubMed
    1. Stenmark KR, Yeager ME, El Kasmi KC, Nozik-Grayck E, Gerasimovskaya EV, Li M, et al. The adventitia: essential regulator of vascular wall structure and function. Annu Rev Physiol. (2013) 75:23–47. 10.1146/annurev-physiol-030212-183802 - DOI - PMC - PubMed
    1. Dutertre CA, Clement M, Morvan M, Schakel K, Castier Y, Alsac JM, et al. Deciphering the stromal and hematopoietic cell network of the adventitia from non-aneurysmal and aneurysmal human aorta. PLoS ONE (2014) 9:e89983. 10.1371/journal.pone.0089983 - DOI - PMC - PubMed
    1. Li N, Cheng W, Huang T, Yuan J, Wang X, Song M. Vascular adventitia calcification and its underlying mechanism. PLoS ONE (2015) 10:e0132506. 10.1371/journal.pone.0132506 - DOI - PMC - PubMed
    1. Majesky MW. Adventitia and perivascular cells. Arterioscler Thromb Vasc Biol. (2015) 35:e31–35. 10.1161/ATVBAHA.115.306088 - DOI - PMC - PubMed