

Do Incarcerated Populations Serve as a Reservoir for Tuberculosis in South Africa?
- PMID: 30277198
- PMCID: PMC6283479
- DOI: 10.4269/ajtmh.17-0652
Do Incarcerated Populations Serve as a Reservoir for Tuberculosis in South Africa?
Abstract
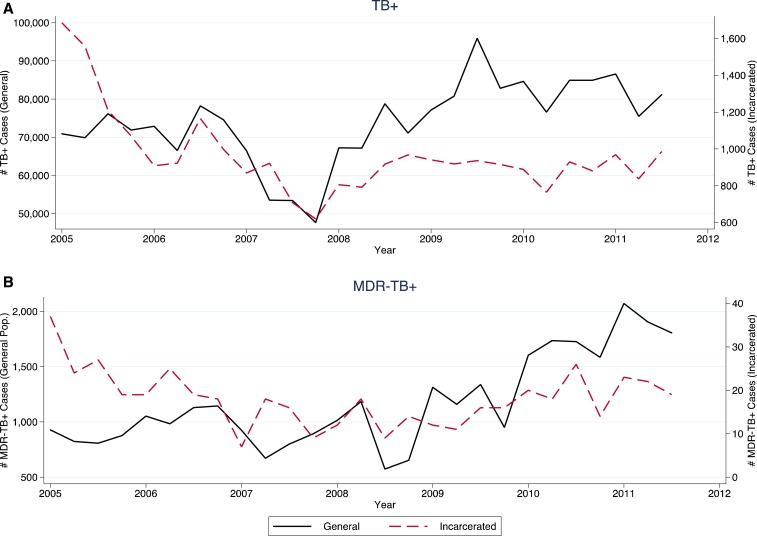
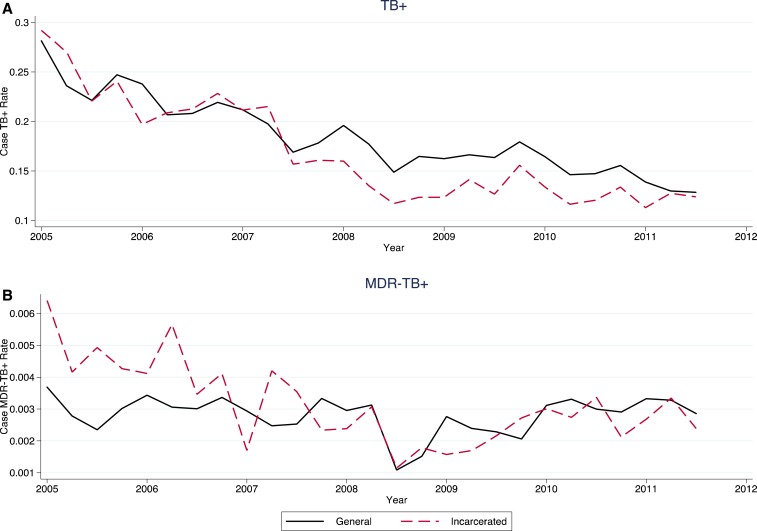
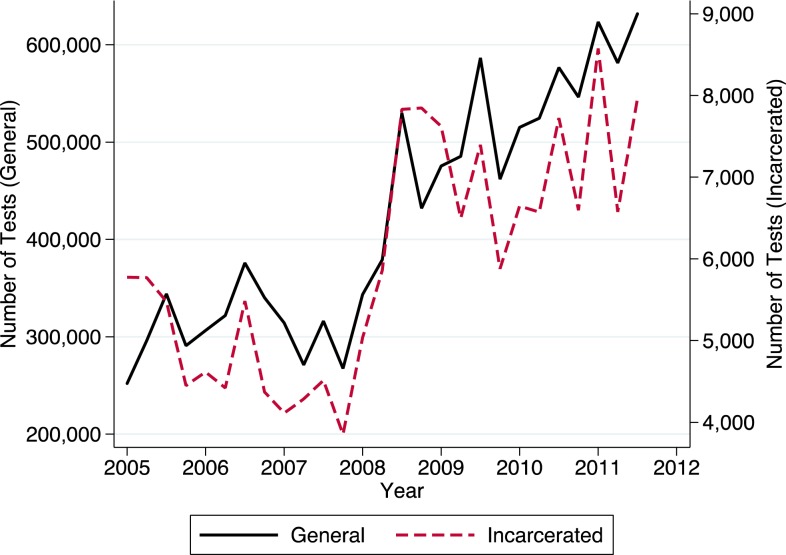
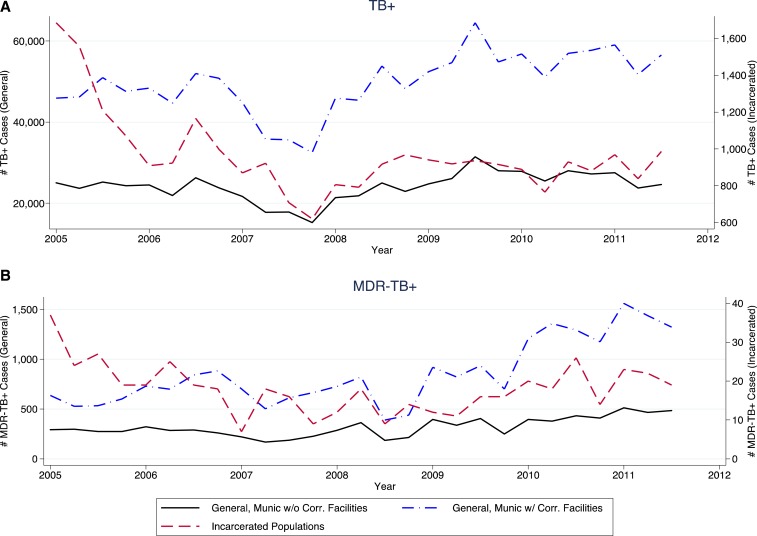
Tuberculosis (TB) prevalence among incarcerated populations is as much as 1,000 times higher than in the general population. This study evaluates whether correctional facilities serve as a reservoir through which TB is transmitted to surrounding communities. Tuberculosis test data were extracted from the South African National Health Laboratory Service database for patients tested for TB between 2005 and 2011. We conducted graphical analysis to assess the relationship of TB rates between incarcerated and non-incarcerated populations over time. We performed generalized linear modeling with a log link function to assess TB risk in communities surrounding correctional facilities, net of confounders. We assessed linkages between incarcerated and non-incarcerated populations over time using Granger causality analysis. Tuberculosis prevalence among incarcerated populations was four times higher than in the general population. Tuberculosis incidence rates in incarcerated and non-incarcerated populations followed similar trends over time. The presence of a correctional facility in a municipality was associated with 34.9% more detected TB cases (confidence interval: 11.6-63.2; P < 0.01), controlling for potential confounders. Detected TB in incarcerated populations did not have predictive power in explaining detected TB rates in the non-incarcerated population after controlling for serial correlation in the time series data. Despite high TB prevalence, trends in correctional facilities do not appear to be driving temporal trends in the general population. However, correctional facilities still act as a TB reservoir that raises the overall TB risk in the vicinity. Intensified TB control policies for correctional facilities, formerly incarcerated individuals, and surrounding communities will reduce TB prevalence overall.
Figures
Similar articles
-
Prevalence and risk factors of tuberculosis disease in South African correctional facilities in 2015.Int J Tuberc Lung Dis. 2019 Nov 1;23(11):1198-1204. doi: 10.5588/ijtld.18.0782. Int J Tuberc Lung Dis. 2019. PMID: 31718756 Free PMC article.
-
A situational analysis of latent tuberculosis infection among incarcerated population in Japan.PLoS One. 2018 Sep 7;13(9):e0203815. doi: 10.1371/journal.pone.0203815. eCollection 2018. PLoS One. 2018. PMID: 30192897 Free PMC article.
-
Prevalence of smear positive pulmonary tuberculosis and associated risk factors among prisoners in Hadiya Zone prison, Southern Ethiopia.BMC Res Notes. 2016 Apr 2;9:201. doi: 10.1186/s13104-016-2005-7. BMC Res Notes. 2016. PMID: 27038898 Free PMC article.
-
Incidence and prevalence of tuberculosis in incarcerated populations: a systematic review and meta-analysis.Lancet Public Health. 2021 May;6(5):e300-e308. doi: 10.1016/S2468-2667(21)00025-6. Epub 2021 Mar 22. Lancet Public Health. 2021. PMID: 33765455 Free PMC article.
-
Tuberculosis: a disease without boundaries.Tuberculosis (Edinb). 2015 Sep;95(5):527-31. doi: 10.1016/j.tube.2015.05.017. Epub 2015 Jun 25. Tuberculosis (Edinb). 2015. PMID: 26198113 Review.
Cited by
-
Tuberculosis control at a South African correctional centre: Diagnosis, treatment and strain characterisation.PLoS One. 2022 Nov 11;17(11):e0277459. doi: 10.1371/journal.pone.0277459. eCollection 2022. PLoS One. 2022. PMID: 36367892 Free PMC article.
-
Tuberculosis Case Finding Cascade and Treatment Outcomes among Male Inmates in Two Prisons in Zimbabwe.Tuberc Res Treat. 2020 Jul 8;2020:5829471. doi: 10.1155/2020/5829471. eCollection 2020. Tuberc Res Treat. 2020. PMID: 32695509 Free PMC article.
-
Prevalence and Predictors of Pulmonary Tuberculosis among Prison Inmates in Sub-Saharan Africa: A Systematic Review and Meta-Analysis.Tuberc Res Treat. 2023 May 22;2023:6226200. doi: 10.1155/2023/6226200. eCollection 2023. Tuberc Res Treat. 2023. PMID: 37260437 Free PMC article.
References
-
- Walmsley R, 2016. World Prison Population List, 11th edition. London, United Kingdom: International Centre for Prison Studies.
-
- Rubenstein LS, Amon JJ, McLemore M, Eba P, Dolan K, Lines R, Beyrer C, 2016. HIV, prisoners, and human rights. Lancet 388: 1202–1214. - PubMed
-
- Stop TB Partnership , 2016. Key Populations Brief: Prisoners Available at: http://www.stoptb.org/assets/documents/resources/publications/acsm/KP_Pr.... Accessed May 20, 2018.
-
- Stop TB Partnership , 2015. Global Plan to End TB: The Paradigm Shift 2016–2020 Available at: http://www.stoptb.org/assets/documents/global/plan/GlobalPlanToEndTB_The.... Accessed May 20, 2018.
Publication types
MeSH terms
Substances
LinkOut - more resources
Full Text Sources
