

A regional bolus tracking and real-time B1 calibration method for hyperpolarized 13 C MRI
- PMID: 30277268
- PMCID: PMC6289616
- DOI: 10.1002/mrm.27391
A regional bolus tracking and real-time B1 calibration method for hyperpolarized 13 C MRI
Abstract
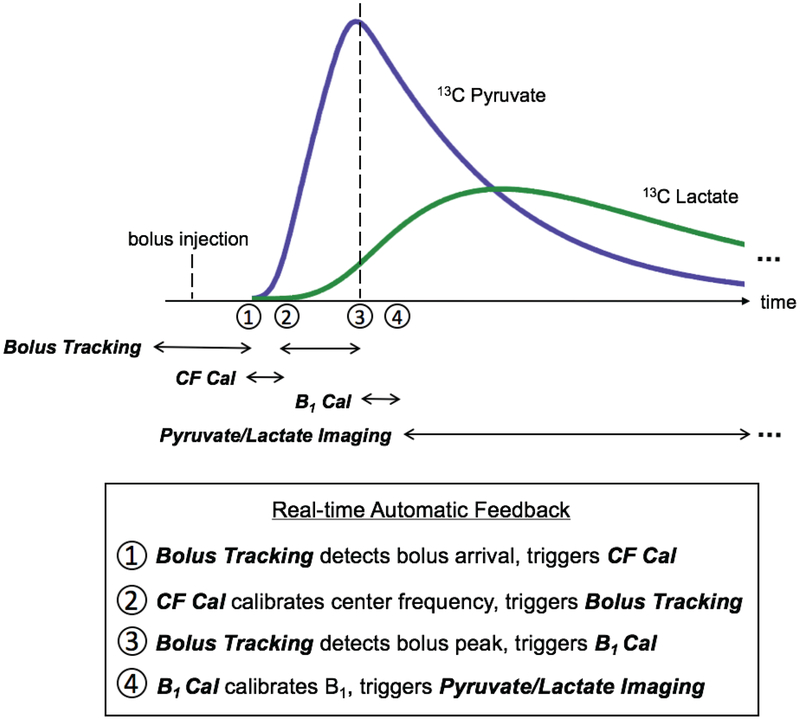
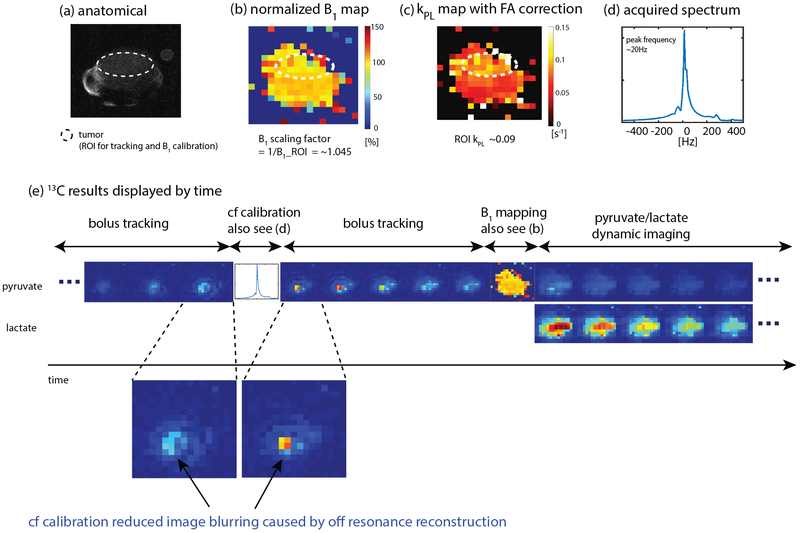
Purpose: Acquisition timing and B1 calibration are two key factors that affect the quality and accuracy of hyperpolarized 13 C MRI. The goal of this project was to develop a new approach using regional bolus tracking to trigger Bloch-Siegert B1 mapping and real-time B1 calibration based on regional B1 measurements, followed by dynamic imaging of hyperpolarized 13 C metabolites in vivo.
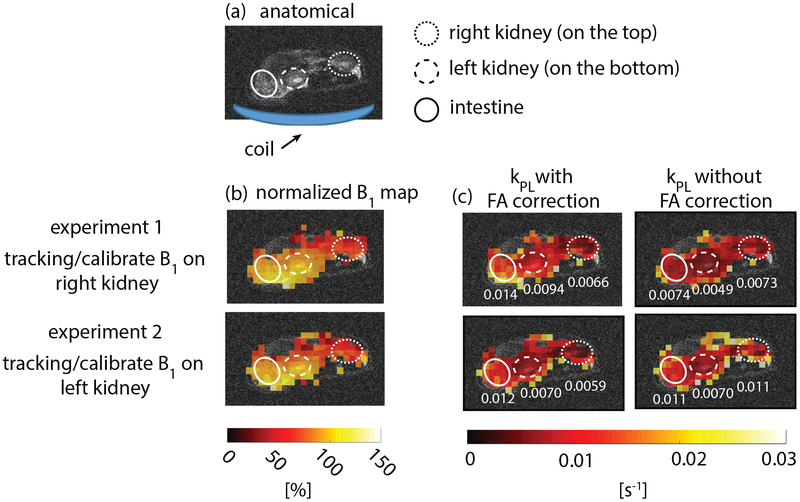
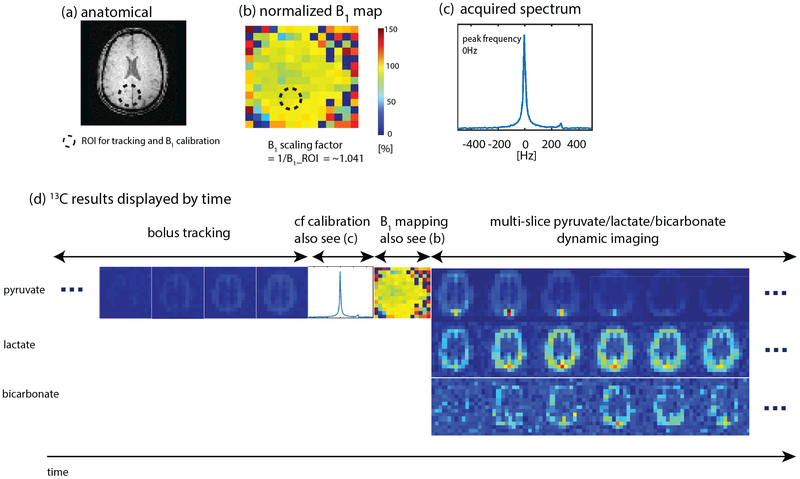
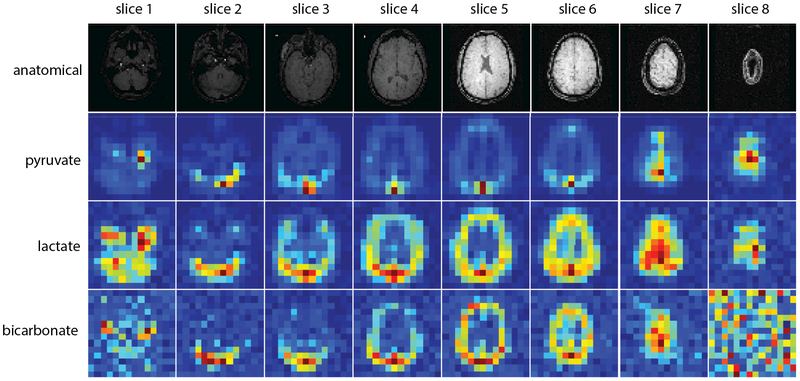
Methods: The proposed approach was implemented on a system which allows real-time data processing and real-time control on the sequence. Real-time center frequency calibration upon the bolus arrival was also added. The feasibility of applying the proposed framework for in vivo hyperpolarized 13 C imaging was tested on healthy rats, tumor-bearing mice and a healthy volunteer on a clinical 3T scanner following hyperpolarized [1-13 C]pyruvate injection. Multichannel receive coils were used in the human study.
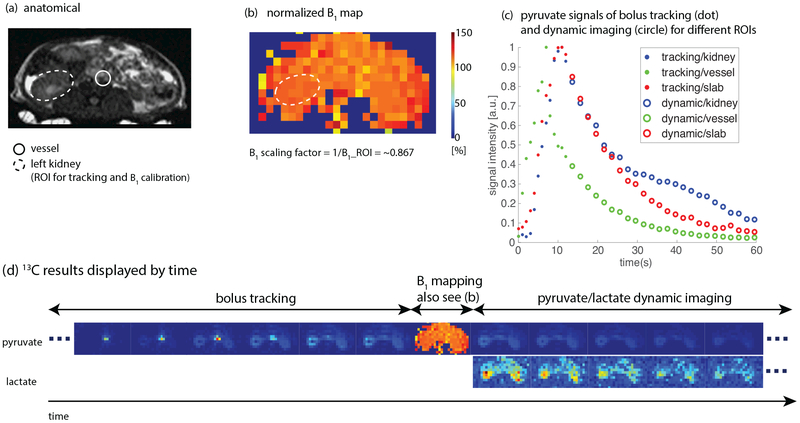
Results: Automatic acquisition timing based on either regional bolus peak or bolus arrival was achieved with the proposed framework. Reduced blurring artifacts in real-time reconstructed images were observed with real-time center frequency calibration. Real-time computed B1 scaling factors agreed with real-time acquired B1 maps. Flip angle correction using B1 maps results in a more consistent quantification of metabolic activity (i.e, pyruvate-to-lactate conversion, kPL ). Experiment recordings are provided to demonstrate the real-time actions during the experiment.
Conclusions: The proposed method was successfully demonstrated on animals and a human volunteer, and is anticipated to improve the efficient use of the hyperpolarized signal as well as the accuracy and robustness of hyperpolarized 13 C imaging.
Keywords: 13C; B1 mapping; Bloch-Siegert; Bolus tracking; Hyperpolarized; MRI; Pyruvate; Real-time; metabolic imaging.
© 2018 International Society for Magnetic Resonance in Medicine.
Figures
Similar articles
-
Investigation of analysis methods for hyperpolarized 13C-pyruvate metabolic MRI in prostate cancer patients.NMR Biomed. 2018 Nov;31(11):e3997. doi: 10.1002/nbm.3997. Epub 2018 Sep 19. NMR Biomed. 2018. PMID: 30230646 Free PMC article.
-
A 2DRF pulse sequence for bolus tracking in hyperpolarized 13C imaging.Magn Reson Med. 2015 Aug;74(2):506-12. doi: 10.1002/mrm.25427. Epub 2014 Aug 22. Magn Reson Med. 2015. PMID: 25154961 Free PMC article.
-
Evaluation of an integrated variable flip angle protocol to estimate coil B1 for hyperpolarized MRI.Magn Reson Med. 2025 Apr;93(4):1615-1628. doi: 10.1002/mrm.30378. Epub 2024 Nov 17. Magn Reson Med. 2025. PMID: 39552169 Free PMC article.
-
Fast Imaging for Hyperpolarized MR Metabolic Imaging.J Magn Reson Imaging. 2021 Mar;53(3):686-702. doi: 10.1002/jmri.27070. Epub 2020 Feb 10. J Magn Reson Imaging. 2021. PMID: 32039520 Free PMC article. Review.
-
Hyperpolarized agents for advanced MRI investigations.Q J Nucl Med Mol Imaging. 2009 Dec;53(6):604-17. Q J Nucl Med Mol Imaging. 2009. PMID: 20016452 Review.
Cited by
-
Clinically feasible B1 field correction for multi-organ sodium imaging at 3 T.NMR Biomed. 2023 Feb;36(2):e4835. doi: 10.1002/nbm.4835. Epub 2022 Oct 11. NMR Biomed. 2023. PMID: 36115017 Free PMC article.
-
Initial Experience of Metabolic Imaging with Hyperpolarized [1-13C]pyruvate MRI in Kidney Transplant Patients.ArXiv [Preprint]. 2024 Sep 10:arXiv:2409.06664v1. ArXiv. 2024. Update in: J Magn Reson Imaging. 2025 Apr;61(4):1969-1978. doi: 10.1002/jmri.29580. PMID: 39314508 Free PMC article. Updated. Preprint.
-
Advancements, challenges, and future prospects in clinical hyperpolarized magnetic resonance imaging: A comprehensive review.Biomed J. 2025 Jun;48(3):100802. doi: 10.1016/j.bj.2024.100802. Epub 2024 Oct 21. Biomed J. 2025. PMID: 39442802 Free PMC article. Review.
-
Consensus Recommendations for Hyperpolarized [1-13C]pyruvate MRI Multi-center Human Studies.ArXiv [Preprint]. 2025 Apr 29:arXiv:2504.20440v1. ArXiv. 2025. Update in: Magn Reson Med. 2025 Oct;94(4):1386-1400. doi: 10.1002/mrm.30570. PMID: 40342865 Free PMC article. Updated. Preprint.
-
Consensus recommendations for hyperpolarized [1-13C]pyruvate MRI multi-center human studies.Magn Reson Med. 2025 Oct;94(4):1386-1400. doi: 10.1002/mrm.30570. Epub 2025 Jun 16. Magn Reson Med. 2025. PMID: 40523079 Free PMC article.
References
-
- ArdenkjærLarsen JH, Golman K, Gram A, Lerche MH, Servin R, Thaning M, Wolber J. Increase of signal-to-noise of more than 10,000 times in liquid state nmr. Discov Med 2003; 3:37–9. - PubMed
-
- Day SE, Kettunen MI, Gallagher FA, Hu DE, Lerche M, Wolber J, Golman K, ArdenkjaerLarsen JH, Brindle KM. Detecting tumor response to treatment using hyperpolarized 13c magnetic resonance imaging and spectroscopy. Nat Med 2007; 13:1382–7. - PubMed
-
- Albers MJ, Bok R, Chen AP, Cunningham CH, Zierhut ML, Zhang VY, Kohler SJ, Tropp J, Hurd RE, Yen YF, Nelson SJ, Vigneron DB, Kurhanewicz J. Hyperpolarized 13c lactate, pyruvate, and alanine: noninvasive biomarkers for prostate cancer detection and grading. Cancer Res 2008; 68:8607–15. - PMC - PubMed
