Functional tractography of white matter by high angular resolution functional-correlation imaging (HARFI)
- PMID: 30277272
- PMCID: PMC6347525
- DOI: 10.1002/mrm.27512
Functional tractography of white matter by high angular resolution functional-correlation imaging (HARFI)
Abstract
Purpose: Functional magnetic resonance imaging with BOLD contrast is widely used for detecting brain activity in the cortex. Recently, several studies have described anisotropic correlations of resting-state BOLD signals between voxels in white matter (WM). These local WM correlations have been modeled as functional-correlation tensors, are largely consistent with underlying WM fiber orientations derived from diffusion MRI, and appear to change during functional activity. However, functional-correlation tensors have several limitations. The use of only nearest-neighbor voxels makes functional-correlation tensors sensitive to noise. Furthermore, adjacent voxels tend to have higher correlations than diagonal voxels, resulting in orientation-related biases. Finally, the tensor model restricts functional correlations to an ellipsoidal bipolar-symmetric shape, and precludes the ability to detect complex functional orientation distributions (FODs).
Methods: We introduce high-angular-resolution functional-correlation imaging (HARFI) to address these limitations. In the same way that high-angular-resolution diffusion imaging (HARDI) techniques provide more information than diffusion tensors, we show that the HARFI model is capable of characterizing complex FODs expected to be present in WM.
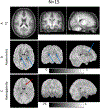
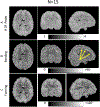
Results: We demonstrate that the unique radial and angular sampling strategy eliminates orientation biases present in tensor models. We further show that HARFI FODs are able to reconstruct known WM pathways. Finally, we show that HARFI allows asymmetric "bending" and "fanning" distributions, and propose asymmetric and functional indices which may increase fiber tracking specificity, or highlight boundaries between functional regions.
Conclusions: The results suggest the HARFI model could be a robust, new way to evaluate anisotropic BOLD signal changes in WM.
Keywords: functional connectivity; functional magnetic resonance imaging; functional pathways; high angular resolution.
© 2018 International Society for Magnetic Resonance in Medicine.
Figures


References
-
- Biswal B, Yetkin FZ, Haughton VM, Hyde JS. Functional connectivity in the motor cortex of resting human brain using echo-planar MRI. Magnetic resonance in medicine : official journal of the Society of Magnetic Resonance in Medicine / Society of Magnetic Resonance in Medicine 1995;34(4):537–541. - PubMed
-
- Fox MD, Raichle ME. Spontaneous fluctuations in brain activity observed with functional magnetic resonance imaging. Nat Rev Neurosci 2007;8(9):700–711. - PubMed
-
- Filippi M fMRI techniques and protocols. New York: Humana Press; 2016. xiii, 911 pages p.
Publication types
MeSH terms
Substances
Grants and funding
- T32 EB001628/EB/NIBIB NIH HHS/United States
- R01 EB017230/EB/NIBIB NIH HHS/United States
- R01EB017230/NH/NIH HHS/United States
- UL1RR024975-01/RR/NCRR NIH HHS/United States
- RR024975-01/RR/NCRR NIH HHS/United States
- T32EB001628/NH/NIH HHS/United States
- U54 HD083211/HD/NICHD NIH HHS/United States
- R01 NS093669/NS/NINDS NIH HHS/United States
- UL1 RR024975/RR/NCRR NIH HHS/United States
- RO1NS058639/NH/NIH HHS/United States
- R01NS093669/NH/NIH HHS/United States
- R01 NS113832/NS/NINDS NIH HHS/United States
- R01 NS058639/NS/NINDS NIH HHS/United States
LinkOut - more resources
Full Text Sources
Medical

