Caval to pulmonary 3D flow distribution in patients with Fontan circulation and impact of potential 4D flow MRI error sources
- PMID: 30277276
- PMCID: PMC6289652
- DOI: 10.1002/mrm.27455
Caval to pulmonary 3D flow distribution in patients with Fontan circulation and impact of potential 4D flow MRI error sources
Abstract
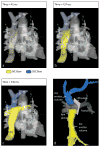
Purpose: Uneven flow distribution in patients with Fontan circulation is suspected to lead to complications. 4D flow MRI offers evaluation using time-resolved pathlines; however, the potential error is not well understood. The aim of this study was to systematically assess variability in flow distribution caused by well-known sources of error.
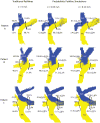
Methods: 4D flow MRI was acquired in 14 patients with Fontan circulation. Flow distribution was quantified by the % of caval venous flow pathlines reaching the left and right pulmonary arteries. Impact of data acquisition and data processing uncertainties were investigated by (1) probabilistic 4D blood flow tracking at varying noise levels, (2) down-sampling to mimic acquisition at different spatial resolutions, (3) pathline calculation with and without eddy current correction, and (4) varied segmentation of the Fontan geometry to mimic analysis errors.
Results: Averaged among the cohort, uncertainties accounted for flow distribution errors from noise ≤3.2%, low spatial resolution ≤2.3% to 3.8%, eddy currents ≤6.4%, and inaccurate segmentation ≤3.9% to 9.1% (dilation and erosion, respectively). In a worst-case scenario (maximum additive errors for all 4 sources), flow distribution errors were as high as 22.5%.
Conclusion: Inaccuracies related to postprocessing (segmentation, eddy currents) resulted in the largest potential error (≤15.5% combined) whereas errors related to data acquisition (noise, low spatial resolution) had a lower impact (≤5.5%-7.0% combined). Whereas it is unlikely that these errors will be additive or affect the identification of severe asymmetry, these results illustrate the importance of eddy current correction and accurate segmentation to minimize Fontan flow distribution errors.
Keywords: 4D flow MRI; Fontan circulation; background phase errors; congenital heart disease; flow distribution; probabilistic tracking; segmentation; uncertainty; velocity noise.
© 2018 International Society for Magnetic Resonance in Medicine.
Figures


Similar articles
-
Respiratory-resolved five-dimensional flow cardiovascular magnetic resonance : In-vivo validation and respiratory-dependent flow changes in healthy volunteers and patients with congenital heart disease.J Cardiovasc Magn Reson. 2024 Winter;26(2):101077. doi: 10.1016/j.jocmr.2024.101077. Epub 2024 Aug 2. J Cardiovasc Magn Reson. 2024. PMID: 39098573 Free PMC article.
-
Systemic-to-pulmonary collateral flow in patients with palliated univentricular heart physiology: measurement using cardiovascular magnetic resonance 4D velocity acquisition.J Cardiovasc Magn Reson. 2012 Apr 27;14(1):25. doi: 10.1186/1532-429X-14-25. J Cardiovasc Magn Reson. 2012. PMID: 22541134 Free PMC article.
-
Evaluation of blood flow distribution asymmetry and vascular geometry in patients with Fontan circulation using 4-D flow MRI.Pediatr Radiol. 2016 Oct;46(11):1507-19. doi: 10.1007/s00247-016-3654-3. Epub 2016 Jun 27. Pediatr Radiol. 2016. PMID: 27350377 Free PMC article.
-
4D flow MRI applications in congenital heart disease.Eur Radiol. 2021 Feb;31(2):1160-1174. doi: 10.1007/s00330-020-07210-z. Epub 2020 Sep 1. Eur Radiol. 2021. PMID: 32870392 Review.
-
Congenital heart disease assessment with 4D flow MRI.J Magn Reson Imaging. 2015 Oct;42(4):870-86. doi: 10.1002/jmri.24856. Epub 2015 Feb 24. J Magn Reson Imaging. 2015. PMID: 25708923 Review.
Cited by
-
Robust and fast stochastic 4D flow vector-field signature technique for quantifying composite flow dynamics from 4D flow MRI: Application to left atrial flow in atrial fibrillation.Med Image Anal. 2024 Feb;92:103065. doi: 10.1016/j.media.2023.103065. Epub 2023 Dec 15. Med Image Anal. 2024. PMID: 38113616 Free PMC article.
-
Patient-Specific Inverse Modeling of In Vivo Cardiovascular Mechanics with Medical Image-Derived Kinematics as Input Data: Concepts, Methods, and Applications.Appl Sci (Basel). 2022 Apr 2;12(8):3954. doi: 10.3390/app12083954. Epub 2022 Apr 14. Appl Sci (Basel). 2022. PMID: 36911244 Free PMC article.
-
Impact of pulmonary artery flow distribution on Fontan hemodynamics and flow energetics.Pediatr Radiol. 2023 May;53(5):900-909. doi: 10.1007/s00247-023-05591-z. Epub 2023 Mar 7. Pediatr Radiol. 2023. PMID: 36879047 Free PMC article.
-
Reduced scan time and superior image quality with 3D flow MRI compared to 4D flow MRI for hemodynamic evaluation of the Fontan pathway.Sci Rep. 2021 Mar 22;11(1):6507. doi: 10.1038/s41598-021-85936-6. Sci Rep. 2021. PMID: 33753790 Free PMC article.
-
Enhancement of cerebrovascular 4D flow MRI velocity fields using machine learning and computational fluid dynamics simulation data.Sci Rep. 2021 May 13;11(1):10240. doi: 10.1038/s41598-021-89636-z. Sci Rep. 2021. PMID: 33986368 Free PMC article.
References
-
- van der Linde D, Konings EE, Slager MA, et al. Birth prevalence of congenital heart disease worldwide: a systematic review and meta-analysis. J Am Coll Cardiol. 2011;58(21):2241–2247. - PubMed
-
- Elder RW, Wu FM. Clinical Approaches to the Patient with a Failing Fontan Procedure. Current cardiology reports. 2016;18(5):44. - PubMed
-
- Srivastava D, Preminger T, Lock JE, et al. Hepatic venous blood and the development of pulmonary arteriovenous malformations in congenital heart disease. Circulation. 1995;92(5):1217–1222. - PubMed
Publication types
MeSH terms
Grants and funding
- T32HL134633/National Institutes of Health, National Heart, Lung and Blood Institute (NHLBI)/International
- K25HL119608/National Institutes of Health, National Heart, Lung and Blood Institute (NHLBI)/International
- K25 HL119608/HL/NHLBI NIH HHS/United States
- R01HL115828/National Institutes of Health, National Heart, Lung and Blood Institute (NHLBI)/International
- R01 HL115828/HL/NHLBI NIH HHS/United States
LinkOut - more resources
Full Text Sources
Medical

