. 2018 Nov 1;128(11):4898-4911.
doi: 10.1172/JCI98353. Epub 2018 Oct 2.

Targeting nuclear receptor NR4A1-dependent adipocyte progenitor quiescence promotes metabolic adaptation to obesity

Affiliations

Targeting nuclear receptor NR4A1-dependent adipocyte progenitor quiescence promotes metabolic adaptation to obesity

Yang Zhang et al. J Clin Invest. .

Abstract

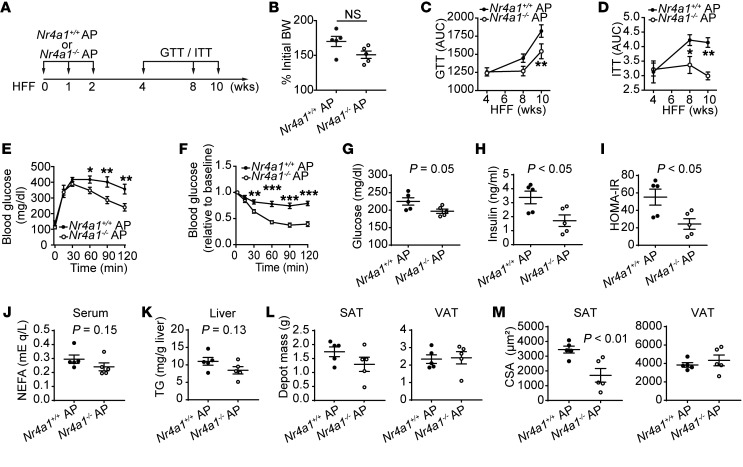
Adipocyte turnover in adulthood is low, suggesting that the cellular source of new adipocytes, the adipocyte progenitor (AP), resides in a state of relative quiescence. Yet the core transcriptional regulatory circuitry (CRC) responsible for establishing a quiescent state and the physiological significance of AP quiescence are incompletely understood. Here, we integrate transcriptomic data with maps of accessible chromatin in primary APs, implicating the orphan nuclear receptor NR4A1 in AP cell-state regulation. NR4A1 gain and loss of function in APs ex vivo decreased and enhanced adipogenesis, respectively. Adipose tissue of Nr4a1-/- mice demonstrated higher proliferative and adipogenic capacity compared with that of WT mice. Transplantation of Nr4a1-/- APs into the subcutaneous adipose tissue of WT obese recipients improved metrics of glucose homeostasis relative to administration of WT APs. Collectively, these data identify NR4A1 as a previously unrecognized constitutive regulator of AP quiescence and suggest that augmentation of adipose tissue plasticity may attenuate negative metabolic sequelae of obesity.

Keywords: Adipose tissue; Cell Biology; Diabetes; Metabolism; Obesity.


Conflict of interest statement

Conflict of interest: The authors have declared that no conflict of interest exists.

Figures

Figure 1
Figure 1. Identification of candidate transcriptional regulators of AP function.
(A and B) Relative adipogenesis measured as a function of postnatal age. 15N-thymidine administered for 2 weeks to mice of various ages ranging from less than 24 hours old to 15 weeks old. 15N-label in the adipocyte fraction, indicative of proliferating and differentiating APs, was measured by IRMS. Relative mass provided as reference in red (see also Supplemental Figure 1, A and B). Data expressed as mean ± SEM. n = 4–11 mice per time point. (C) Microarray analyses of freshly isolated AP-rich stromal vascular fractions (see also Supplemental Figure 1C) relative to whole AT from the same mice (n = 3 mice). Heatmap representation of top 150 upregulated AP genes and 7 representative adipocyte markers in subcutaneous (S) and visceral (V) depots. (D) Left: Venn diagram of the overlap of the top 150 genes between AT depots. Right: TF fraction of the top 150 genes. (E) Top 5 GO terms for biological processes of differently expressed genes annotated by DAVID. (F) Real-time qPCR of freshly isolated APs, inclusive of the 22 TFs in C and expressed relative to unfractionated AT. (G) Relative expression of terminal adipocyte markers in APs relative to unfractionated AT. (F and G) Data displayed as bar graphs ±  SEM, with dots showing individual values; n = 4 mice. *P < 0.05, 2-tailed, unpaired t test (pass Shapiro-Wilk normality test) and Mann-Whitney U test (values are not from Gaussian distribution).
Figure 2
Figure 2. NR4A1 is a constituent of AP core transcriptional circuitry.
(A) Bar plot of genomic distribution of ATAC-seq enrichment in APs expressed as a function of the distance to the TSS. (B) Pie chart of overlap between ATAC peaks in APs compared with DNase hypersensitivity maps generated in the mouse ENCODE project. (C) Consensus sequences for the most highly enriched de novo DNA sequence motifs present in unique ATAC peaks in APs. The motifs were then matched to the known TF motif that is closest in sequence composition to the discovered motifs. (D) All enhancers detected in APs ranked by increasing ATAC DNA length in kb. Enhancers are defined as regions of enrichment not fully contained within ±2.5 kb from a TSS. (E) Gene track of ATAC-seq signal (reads per million) at Nr4a1 locus in APs from SAT and VAT (see also Supplemental Figure 2B). Discrete regions used for motif search are highlighted in gray. (F) The presence of motif occurrences of selected TFs within an ATAC-seq hypersensitivity site (shaded gray in E) are indicated by red boxes. (G) Representative scatter plot of TFs present in the CRC comparing inward and outward binding. Circled size is scaled to represent the size of the largest enhancer regulating a given TF. (H) Bar graph displaying average IN-degree binding (IN-ward centrality) of the top 175 TFs. (I) A subnetwork is shown that includes all super-enhancer–regulated TFs that contain Nr4a1 motifs within their super-enhancers.
Figure 3
Figure 3. NR4A1 is constitutively expressed in APs.
(A) qPCR analysis of Nr4a1 expression in AT fractions: adipocytes (Adipo), APs, and unfractionated AT. Data expressed as bar graphs of mean ± SEM, normalized to SAT AT, and with individual data points shown as dots. n = 4. (B) Western blots of AP isolate versus adipocyte fraction. NR4A1 protein expression is compared relative to adipocyte markers FAS and FABP4.
Figure 4
Figure 4. NR4A1 regulates AP differentiation in vitro.
(A) ORO staining after induction of adipogenesis in primary APs isolated from SAT and VAT and transduced with retroviral vectors driving overexpression of Nr4a1 (MSCV-Nr4a1) or vector control (MSCV-vector). Data collected after 8 days of adipogenic differentiation. Relative quantification at 520 nm absorbance after ORO extraction was normalized to MSCV-vector control and expressed as mean of technical replicates. Three independent experiments are shown. Significance was assessed by 2-tailed, paired t test. Scale bar: 1 mm. (B) qPCR analysis of relative expression of Nr4a1 and late adipogenic genes after Nr4a1 overexpression as in A. Data displayed as bar graphs ± SEM with dots showing individual values. n = 5–6 technical replicates. *P < 0.05; ***P < 0.001, 2-tailed unpaired t test. (C) ORO staining after adipogenic differentiation of APs isolated from SAT and VAT of Nr4a1+/+ and Nr4a1–/– mice. Data collected after 8 days of adipogenic differentiation. Relative quantification at 520 nm absorbance after ORO extraction was normalized to Nr4a1+/+ and expressed as mean of technical replicates. Seven independent experiments are shown. Significance was assessed by 2-tailed, paired t test. Scale bar: 1 mm. (D) qPCR analysis of late adipogenic genes in AP isolated from SAT and VAT of Nr4a1+/+ and Nr4a1–/– mice after induction of adipogenesis. Data displayed as bar graphs ± SEM with dots showing individual values. n = 3–4 technical replicates. *P < 0.05; **P < 0.01, 2-tailed unpaired t test.
Figure 5
Figure 5. NR4A1 regulation of adipogenesis is dependent on an intact DBD.
ORO staining after retroviral overexpression of WT Nr4a1 or DBD mutants (shown in schematic, bottom left) during expansion and differentiation of AP from Nr4a1–/– mice. Data collected after 8 days of adipogenic differentiation. Scale bar: 1 mm. Bottom right shows relative quantification at 520 nm absorbance after ORO extraction was normalized to MSCV-vector control and expressed as mean of technical replicates. Three independent experiments are shown as box (with mean line) and whiskers (minimum to maximum). Significance was assessed by 1-way ANOVA with Tukey’s adjustment for multiple comparisons. ***P < 0.001.
Figure 6
Figure 6. Nr4a1 regulates a cell-cycle transcriptional program.
(A) Volcano plots of RNA-seq conducted on AP from Nr4a1+/+ (WT) and Nr4a1–/– (KO) mice (n = 4 mice). Red dots, positively regulated genes in KO group (adjusted P < 0.05); blue dots, negatively regulated genes in KO group (adjusted P < 0.05). (B) Venn diagrams show overlap of differentially expressed genes in APs from 2 adipose depots. (C) Hierarchical clustering analysis of common differentially expressed genes from the 2 adipose depots (198 genes). (D) GSEA enrichment plots for GO cell cycle (see also Supplemental Figure 4) in APs from Nr4a1-KO mice (P < 0.001) relative to WT. (E) Fold change of all genes in the TF network (Figure 1) versus all other expressed genes. TF network genes are as a group downregulated in KO group relative to all other expressed genes. **P < 0.01, Mann-Whitney U test.
Figure 7
Figure 7. Nr4a1 regulates adipogenesis in vivo.
(A) Two cohorts of juvenile (4 weeks old) Nr4a1+/+ and Nr4a1–/– male mice labeled for 2 weeks with 15N-thymidine. Relative labeling in stromal vascular cells from SAT and VAT (line indicates mean). Significance was assessed by 2-tailed, unpaired t test. (B) Three cohorts of juvenile (4 weeks old) Nr4a1+/+ and Nr4a1–/– male mice labeled for 2 weeks with15N-thymidine. Relative labeling in adipocyte fractions isolated from SAT and VAT (line indicates mean). Significance was assessed by 2-tailed, unpaired t test. (C) Adult (10 weeks old) Nr4a1+/+ and Nr4a1–/– mice receiving normal chow or high-fat feeding (HFF) were labeled for 8 weeks with15N-thymidine. Relative labeling in the adipocyte fractions isolated from SAT and VAT (line indicates mean). Two-way ANOVA, Šidák’s multiple comparisons adjustment. *P < 0.05; **P < 0.01; ***P < 0.001.
Figure 8
Figure 8. NR4A1 regulates AP function and systemic glucose homeostasis in obesity.
(A) Protocol of AP transplantation and high-fat feeding for adult (10 weeks old) C57BL/6 mice. (B) Weight gain expressed as percentage of initial body weight of the mice after Nr4a1+/+ or Nr4a1–/– AP transplantation and 10 weeks of HFF. (C) Evolution of the AUC of glucose tolerance test (GTT) during HFF and after AP transplantation. (D) Evolution of the AUC of insulin tolerance test (ITT) during HFF and after AP transplantation. (E) i.p. (1.5 g/kg) GTT from the 10-week time point shown in C. (F) i.p. (0.5 U/kg) ITT from the 10-week time point shown in D. (G) Glucose measured after 4-hour fast. (H) Serum insulin levels after 4-hour fast. (I) HOMA-IR derived from glucose/insulin as shown in H and I. (J) Serum NEFA. (K) Liver TG content. (L) Inguinal (SAT) and perigonadal (VAT) depot weights. (M) Adipocyte mean cross-sectional areas (CSA) for SAT (left) and VAT (right). (BM) n = 5, data expressed as mean ± SEM. Significance was assessed by 2-tailed, unpaired t test. *P < 0.05; **P < 0.01; ***P < 0.001.

References

    1. Nguyen NT, Nguyen XM, Lane J, Wang P. Relationship between obesity and diabetes in a US adult population: findings from the National Health and Nutrition Examination Survey, 1999-2006. Obes Surg. 2011;21(3):351–355. doi: 10.1007/s11695-010-0335-4. - DOI - PMC - PubMed
    1. Mokdad AH, et al. Prevalence of obesity, diabetes, and obesity-related health risk factors, 2001. JAMA. 2003;289(1):76–79. - PubMed
    1. Garg A. Acquired and inherited lipodystrophies. N Engl J Med. 2004;350(12):1220–1234. doi: 10.1056/NEJMra025261. - DOI - PubMed
    1. Majithia AR, et al. Rare variants in PPARG with decreased activity in adipocyte differentiation are associated with increased risk of type 2 diabetes. Proc Natl Acad Sci U S A. 2014;111(36):13127–13132. doi: 10.1073/pnas.1410428111. - DOI - PMC - PubMed
    1. Majithia AR, et al. Prospective functional classification of all possible missense variants in PPARG. Nat Genet. 2016;48(12):1570–1575. doi: 10.1038/ng.3700. - DOI - PMC - PubMed

Publication types

Substances