. 2019 Mar 18;21(4):517-526.
doi: 10.1093/neuonc/noy160.

Combined iron oxide nanoparticle ferumoxytol and gadolinium contrast enhanced MRI define glioblastoma pseudoprogression

Affiliations

Combined iron oxide nanoparticle ferumoxytol and gadolinium contrast enhanced MRI define glioblastoma pseudoprogression

Ramon F Barajas et al. Neuro Oncol. .

Abstract

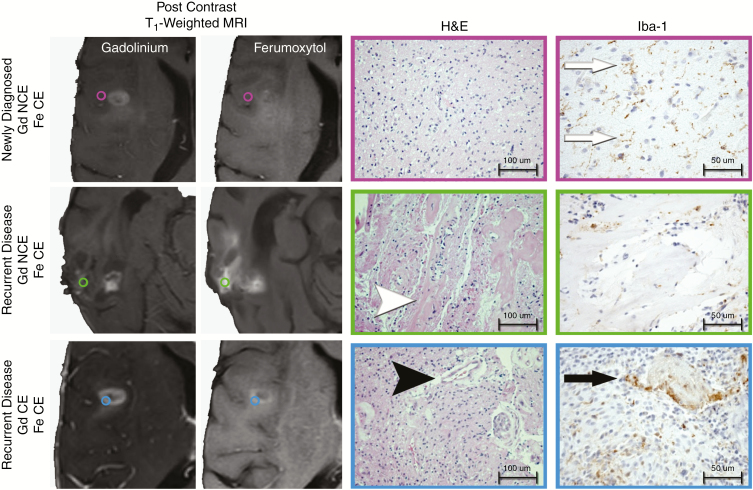
Background: Noninvasively differentiating therapy-induced pseudoprogression from recurrent disease in patients with glioblastoma is prospectively difficult due to the current lack of a biologically specific imaging metric. Ferumoxytol iron oxide nanoparticle MRI contrast characterizes innate immunity mediated neuroinflammation; therefore, we hypothesized that combined ferumoxytol and gadolinium enhanced MRI could serve as a biomarker of glioblastoma pseudoprogression.

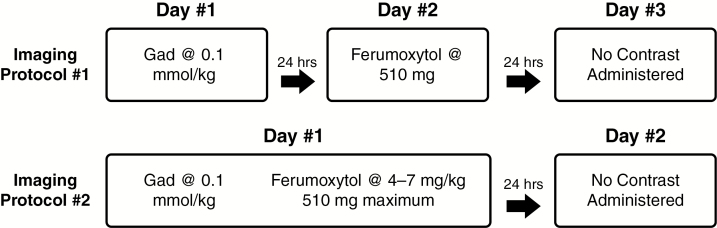
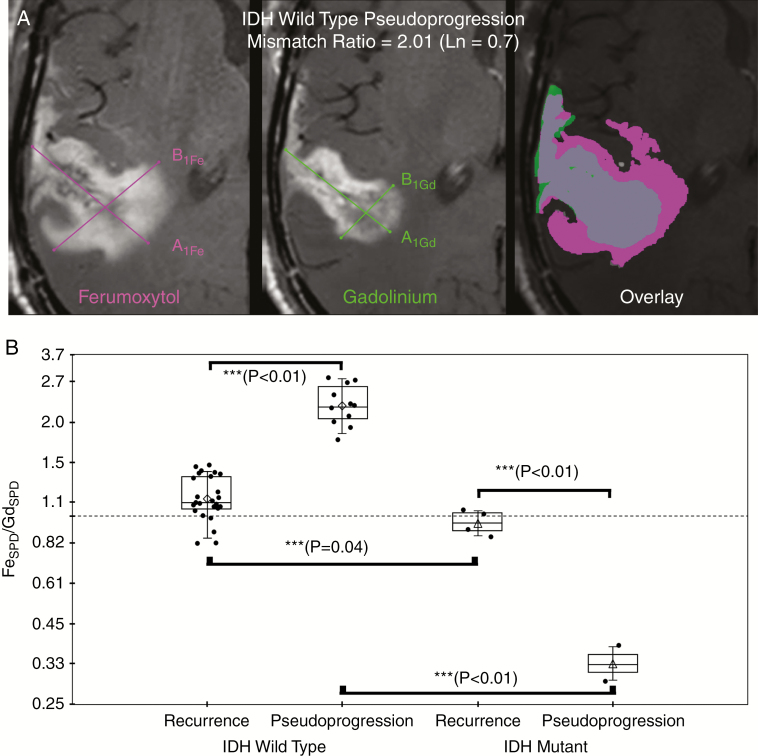
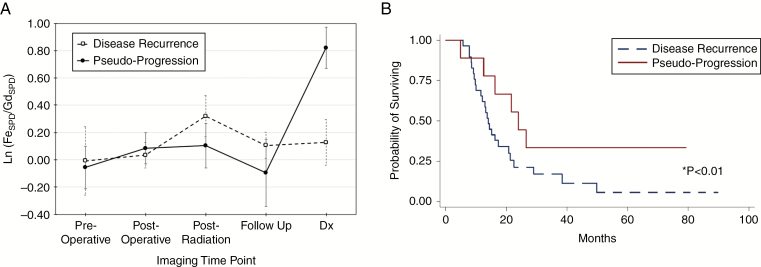
Methods: In this institutional review board-approved, retrospective study, we analyzed ferumoxytol and gadolinium contrast enhanced T1-weighted 3T MRI in 45 patients with glioblastoma over multiple clinical timepoints. Isocitrate dehydrogenase 1 (IDH-1) mutational status was characterized by exome sequencing. Sum of products diameter measurements were calculated according to Response Assessment in Neuro-Oncology criteria from both gadolinium and ferumoxytol enhanced sequences. Enhancement mismatch was calculated as the natural log of the ferumoxytol to gadolinium sum of products diameter ratio. Analysis of variance and Student's t-test assessed differences in mismatch ratios. P-value <0.05 indicated statistical significance.

Results: With the development of pseudoprogression we observed a significantly elevated mismatch ratio compared with disease recurrence (P < 0.01) within IDH-1 wild type patients. Patients with IDH-1 mutation demonstrated significantly reduced mismatch ratio with the development of pseudoprogression compared with disease recurrence (P < 0.01). Receiver operator curve analysis demonstrated 100% sensitivity and specificity for the use of mismatch ratios as a diagnostic biomarker of pseudoprogression.

Conclusion: Our study suggests that ferumoxytol to gadolinium contrast mismatch ratios are an MRI biomarker for the diagnosis of pseudoprogression in patients with glioblastoma. This may be due to the unique characterization of therapy-induced neuroinflammation.

Keywords: RANO; ferumoxytol; glioblastoma; macrophage; pseudoprogression.


Figures

Fig. 1
Fig. 1
Diagram of MRI protocols. Protocol #1 consisted of 3 days total MRI; day 1 included gadolinium enhanced imaging, day 2 consisted of vascular phase ferumoxytol enhanced MRI, and day 3 consisted of 24-hour delayed phase ferumoxytol MRI. Protocol #2 consisted of 2 days total MRI; day 1 consisted of gadolinium enhanced MRI followed by intravenous ferumoxytol contrast administration. Day 2 consisted of 24-hour delayed phase ferumoxytol enhanced MRI. No intravenous contrast was provided on the final day of MRI for either protocol.
Fig. 2
Fig. 2
Representative example of ferumoxytol (Fe, left) and gadolinium (Gd, middle) SPD measurement (A) and graph of mean natural log ratio measurements (B) categorized by final disease status and IDH-1 mutational status. (A) Sum of products diameter (SPD) was calculated for 24-hour delayed ferumoxytol enhanced phase (left image) and gadolinium enhanced (middle image) T1-weighted images; SPD = A1 × B1 at maximal site of enhancement according to RANO guidelines. Contrast enhancement mismatch was calculated as the natural log ratio of SPDFe/SPDGd. For statistical analysis, the natural log of the enhancement mismatch ratio was used so that nonlinearities in ratio variables could be linearized such that the ratios are equidistant and the dependent variable is not weighted in favor of the denominator. For illustrative purposes; fused imaged overlay (ferumoxytol enhancing region, pink; gadolinium enhancing region, green; enhancing overlap, gray; right image) demonstrates the degree of ferumoxytol/gadolinium mismatch in an IDH-1 wild type patient with pseudoprogression. (B) Box plot of cohort enhancement mismatch values as the ratio categorized by final disease status (disease recurrence or pseudoprogression) and IDH-1 mutational status demonstrates contrast enhancement mismatch ratio was found to be significantly different at all posttherapy timepoints when assessed by ANOVA (***denotes statistical significance). Significantly elevated enhancement mismatch ratios were observed in patients with recurrent IDH-1 wild type glioblastoma compared with patients with recurrent IDH-1 mutated glioblastoma (0.13 ± 0.17 vs −0.05 ± 0.09, P = 0.04). Additionally, IDH-1 wild type pseudoprogression was significantly elevated compared with IDH-1 wild type recurrent disease (0.82 ± 0.15 vs 0.13 ± 0.17, P < 0.01).
Fig. 3
Fig. 3
Graphs of contrast mismatch ratio by clinically relevant timepoints (A) and Kaplan–Meier survival curve of the entire patient cohort categorized by disease recurrence or pseudoprogression (B). (A) Graph of natural log contrast enhancement mismatch ratio as a function of imaging timepoints in patients with IDH-1 wild type glioblastoma. The mean enhancing mismatch ratio increases significantly at the time of pseudoprogression (solid line) compared with prior imaging timepoints (P < 0.01). Conversely, mean enhancing mismatch ratio in patients with disease recurrence (dashed line) does not significantly change compared with prior imaging timepoints. (B) Kaplan–Meier survival curve of the patient cohort demonstrates significantly prolonged survival for patients with pseudoprogression (red line) compared with disease recurrence (blue dashed line).
Fig. 4
Fig. 4
Histopathological observation of regional image guided tissue samples based on ferumoxytol and gadolinium contrast enhancing patterns. Standard of care stereotactic tissue sampling was performed in 3 patients with IDH-1 wild type glioblastoma at the time of initial diagnosis or at the time of disease recurrence. Tissue samples were classified by the presence of gadolinium (Gd, left column) or ferumoxytol (Fe, middle left column) contrast enhancement (CE). Tissue specimens were histopathologically characterized for the presence of tumor and microvascular proliferation (hematoxylin and eosin; middle right column; 100 μm scale bar) and the presence of activated microglia/macrophage (ionized calcium binding adaptor molecule 1 [Iba-1; 50 μm scale bar]). Regions of ferumoxytol contrast enhancement and gadolinium noncontrast enhancement (NCE) were observed in patients with newly diagnosed glioblastoma (top) and disease recurrence (middle). Ferumoxytol-only enhancing regions in patients with newly diagnosed IDH-1 wild type glioblastoma demonstrated infiltrating glioma with low cellularity, delicate vasculature, and activated microglia (white arrows; brown staining Iba-1 cells). Ferumoxytol-only enhancing regions in patients with recurrent IDH-1 wild type glioblastoma demonstrated therapeutic changes evidenced by widespread vascular hyalinization (white arrow head) with scattered macrophages without evidence of viable tumor. Dual contrast enhancing sites (bottom row) appeared biologically similar in the newly diagnosed and disease recurrence setting being characterized by highly cellular tumor with microvascular proliferation (black arrow head) and TAMs with an epithelioid appearance (black arrow).

Similar articles

Cited by

References

    1. Hottinger AF, Stupp R, Homicsko K. Standards of care and novel approaches in the management of glioblastoma multiforme. Chin J Cancer. 2014;33(1):32–39. - PMC - PubMed
    1. Stupp R, Mason WP, van den Bent MJ, et al. ; European Organisation for Research and Treatment of Cancer Brain Tumor and Radiotherapy Groups; National Cancer Institute of Canada Clinical Trials Group Radiotherapy plus concomitant and adjuvant temozolomide for glioblastoma. N Engl J Med. 2005;352(10):987–996. - PubMed
    1. Stupp R, Hegi ME, Mason WP, et al. ; European Organisation for Research and Treatment of Cancer Brain Tumour and Radiation Oncology Groups; National Cancer Institute of Canada Clinical Trials Group Effects of radiotherapy with concomitant and adjuvant temozolomide versus radiotherapy alone on survival in glioblastoma in a randomised phase III study: 5-year analysis of the EORTC-NCIC trial. Lancet Oncol. 2009;10(5):459–466. - PubMed
    1. Mirimanoff R, Stupp R. Long-term survival in glioblastoma possible. Updated results of the EORTC/NCIC phase III randomized trial on radiotherapy (RT) and concomitant and adjuvant temozolomide (TMZ) versus RT alone. Int J Radiat Oncol Biol Phys. 2007;69:S2.
    1. Hegi ME, Diserens AC, Gorlia T, et al. . MGMT gene silencing and benefit from temozolomide in glioblastoma. N Engl J Med. 2005;352(10):997–1003. - PubMed

Publication types