Published Erratum
. 2018 Oct 2;13(10):e0205269.
doi: 10.1371/journal.pone.0205269. eCollection 2018.

Correction: Intra- and Inter-Task Reliability of Spatial Attention Measures in Pseudoneglect

Published Erratum

Correction: Intra- and Inter-Task Reliability of Spatial Attention Measures in Pseudoneglect

Gemma Learmonth et al. PLoS One. .

Abstract

[This corrects the article DOI: 10.1371/journal.pone.0138379.].


Figures

Fig 3
Fig 3. Mean psychometric function curves for the LM, GRE and GRA tasks.
The asymmetry of the presented stimulus is shown on the x-axis, where 0 = “both sides equal length” (LM) or “both bars equal darkness/thin stripes” (GRE/GRA respectively). Negative asymmetry values represent trials where the target feature is located on the left side and positive values on the right side. One unit on the x-axis equates to 3 pixels (0.07°) for the LM task, 10 pixels (0.24°) for GRE and 12 pixels (0.29°) for GRA.
Fig 5
Fig 5. Grand average spatial attention bias for the 5 tasks.
Negative and positive values represent leftward and rightward biases respectively. The LM and MLB tasks show significantly leftward biases on both days and the GRE leftward on Day 1 only (± standard error of the mean (SEM)). The LVD task (d’ and PF 50%) is presented separately on the lower axes for clarity, due to smaller bias values. * represents a significant attentional bias compared to zero (p<0.05).
Fig 6
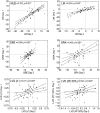
Fig 6. Intra-task correlations.
Day 1 vs Day 2 biases are significantly correlated for all 5 tasks (i.e. each task provides a stable measure) over the two testing days (all p-values <0.05). Line of best fit and 95% confidence intervals are marked. * represents a significant correlation at α = 0.05.
Fig 7
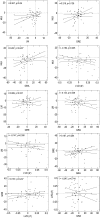
Fig 7. Inter-task correlations.
Only the mean task biases (Day 1 and Day 2 averaged) for the MLB and GRA tasks were significantly correlated at α = 0.05 prior to correction, with all other comparisons p>0.05. * represents significant correlation at α = 0.05 but not when Bonferroni corrected to α = 0.005.
Fig 8
Fig 8. Visualisation of principal component analysis (PCA) loadings.

Erratum for

References

    1. Learmonth G, Gallagher A, Gibson J, Thut G, Harvey M (2015) Intra- and Inter-Task Reliability of Spatial Attention Measures in Pseudoneglect. PLoS ONE 10(9): e0138379 10.1371/journal.pone.0138379 - DOI - PMC - PubMed

Publication types