. 2018 Oct:36:18-28.
doi: 10.1016/j.ebiom.2018.09.015. Epub 2018 Sep 29.

Fisetin is a senotherapeutic that extends health and lifespan

Affiliations

Fisetin is a senotherapeutic that extends health and lifespan

Matthew J Yousefzadeh et al. EBioMedicine. 2018 Oct.

Abstract

Background: Senescence is a tumor suppressor mechanism activated in stressed cells to prevent replication of damaged DNA. Senescent cells have been demonstrated to play a causal role in driving aging and age-related diseases using genetic and pharmacologic approaches. We previously demonstrated that the combination of dasatinib and the flavonoid quercetin is a potent senolytic improving numerous age-related conditions including frailty, osteoporosis and cardiovascular disease. The goal of this study was to identify flavonoids with more potent senolytic activity.

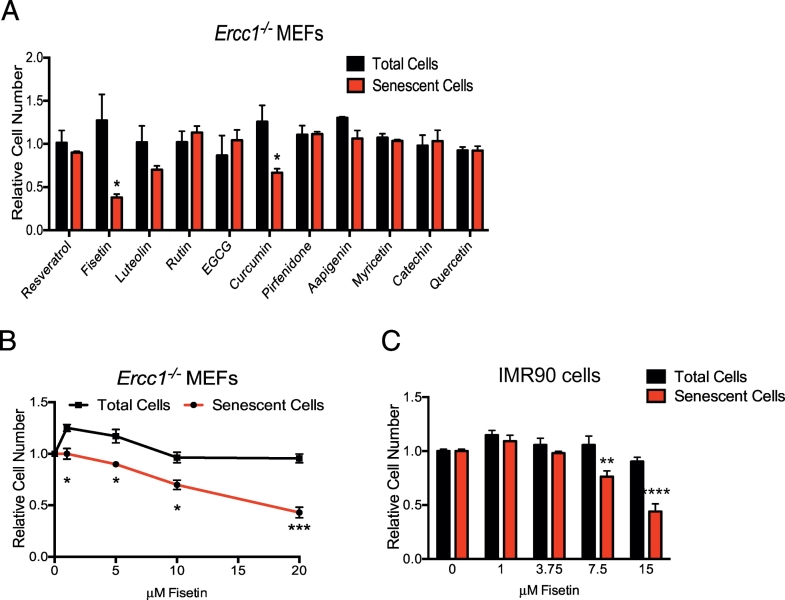
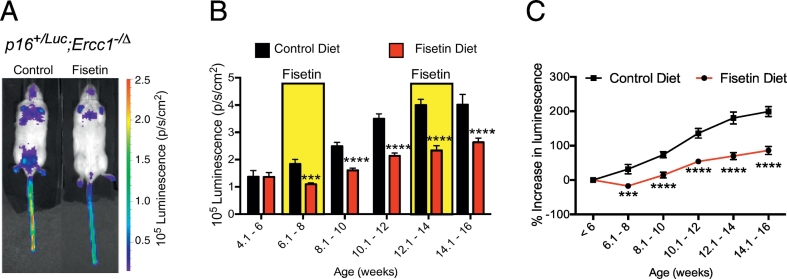
Methods: A panel of flavonoid polyphenols was screened for senolytic activity using senescent murine and human fibroblasts, driven by oxidative and genotoxic stress, respectively. The top senotherapeutic flavonoid was tested in mice modeling a progeroid syndrome carrying a p16INK4a-luciferase reporter and aged wild-type mice to determine the effects of fisetin on senescence markers, age-related histopathology, disease markers, health span and lifespan. Human adipose tissue explants were used to determine if results translated.

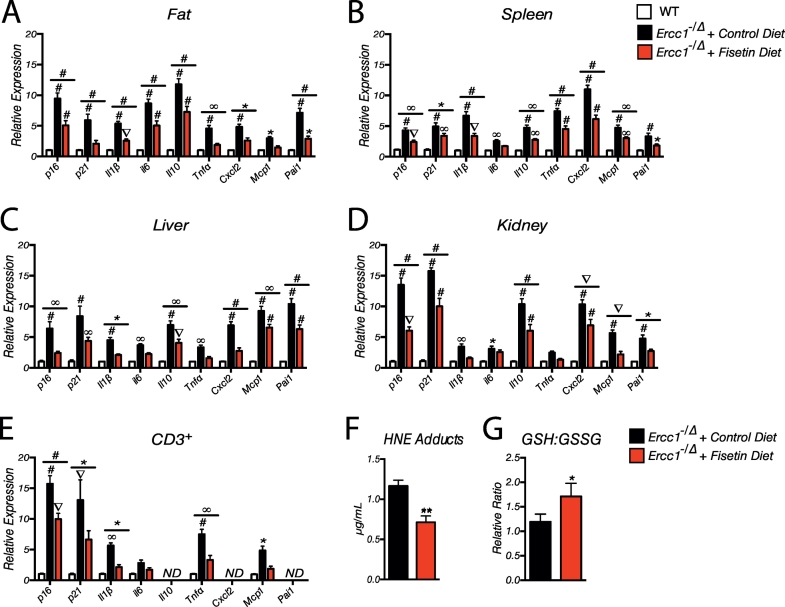
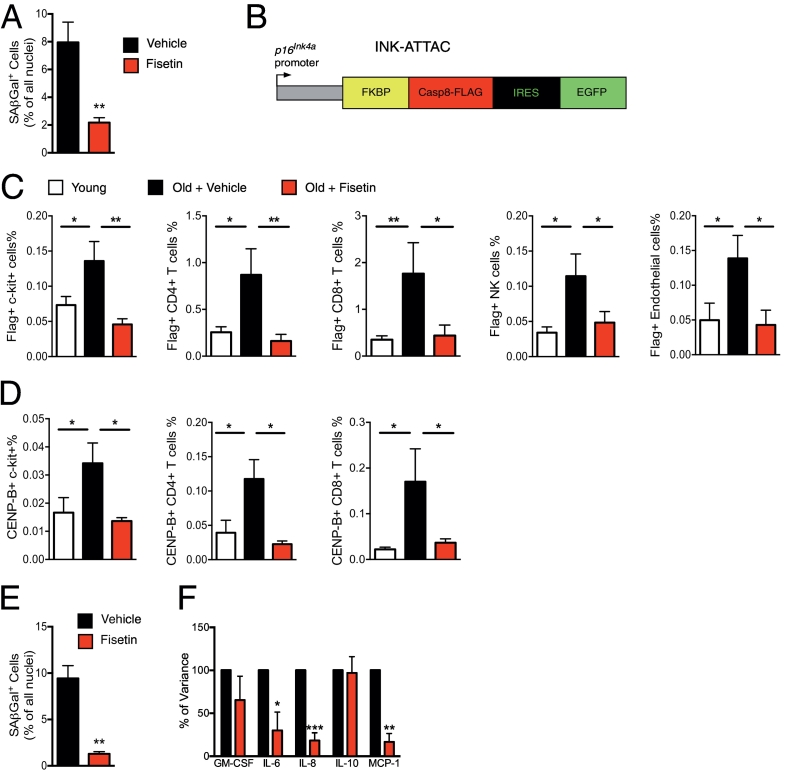
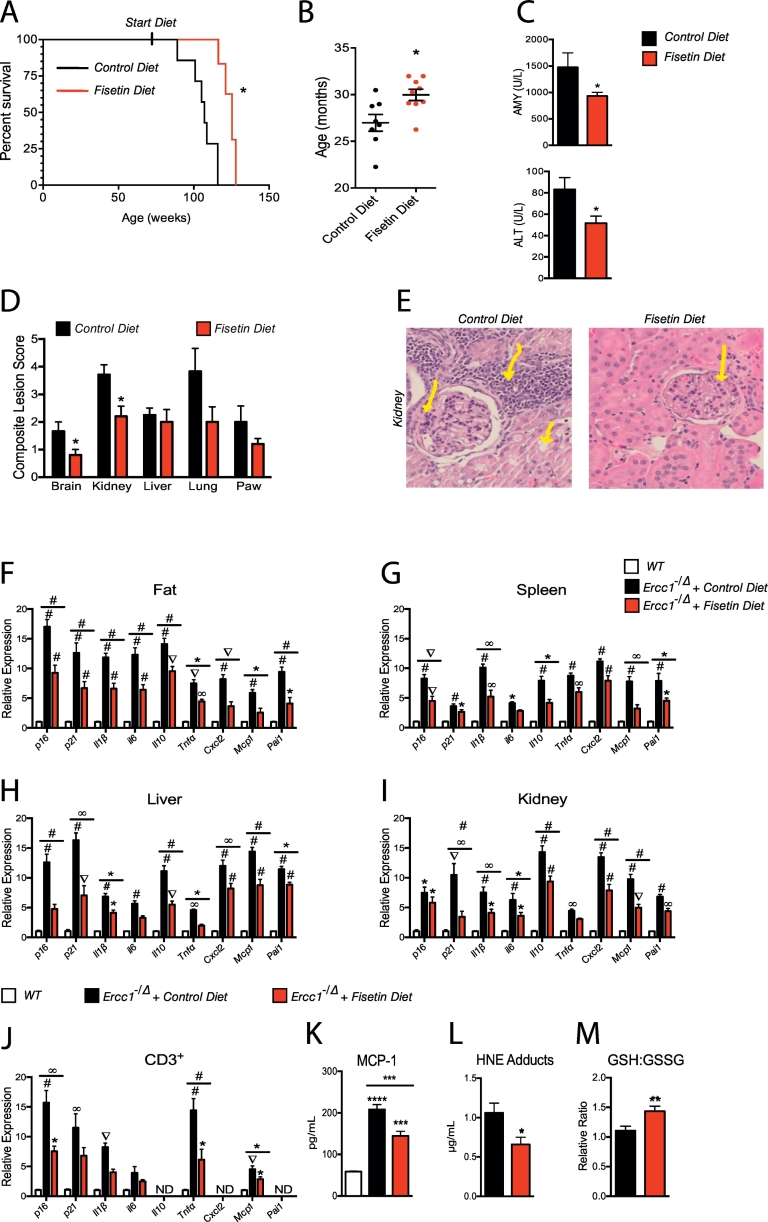
Findings: Of the 10 flavonoids tested, fisetin was the most potent senolytic. Acute or intermittent treatment of progeroid and old mice with fisetin reduced senescence markers in multiple tissues, consistent with a hit-and-run senolytic mechanism. Fisetin reduced senescence in a subset of cells in murine and human adipose tissue, demonstrating cell-type specificity. Administration of fisetin to wild-type mice late in life restored tissue homeostasis, reduced age-related pathology, and extended median and maximum lifespan.

Interpretation: The natural product fisetin has senotherapeutic activity in mice and in human tissues. Late life intervention was sufficient to yield a potent health benefit. These characteristics suggest the feasibility to translation to human clinical studies. FUND: NIH grants P01 AG043376 (PDR, LJN), U19 AG056278 (PDR, LJN, WLL), R24 AG047115 (WLL), R37 AG013925 (JLK), R21 AG047984 (JLK), P30 DK050456 (Adipocyte Subcore, JLK), a Glenn Foundation/American Federation for Aging Research (AFAR) BIG Award (JLK), Glenn/AFAR (LJN, CEB), the Ted Nash Long Life and Noaber Foundations (JLK), the Connor Group (JLK), Robert J. and Theresa W. Ryan (JLK), and a Minnesota Partnership Grant (AMAY-UMN#99)-P004610401-1 (JLK, EAA).

Keywords: Aging; Healthspan; Lifespan; Progeria; Senescence; Senolytic.


Figures

Fig. 1
Fig. 1
Identification of fisetin as a putative senolytic. (A) Passage 5 Ercc1−/− MEFs were treated with a panel of flavonoid compounds at a dose of 5 μM and the viability of senescent cells (SA-β-gal+ cells detected by C12FDG staining; red bars) and total cells (black bars) measured using an IN Cell Analyzer 6000. The number of viable cells is calculated relative to cells treated with vehicle only (DMSO). n = 3 independent experiments, one-way ANOVA. (B) Quantitation of the total number of viable Ercc1−/− MEFs and viable senescent Ercc1−/− MEFs after treating mixed cultures of proliferating and senescent cells with various doses of fisetin from two biological replicates conducted in triplicate. Two-tailed unpaired Student's t-test. (C) Early passage IMR90 cells were treated for 24 h with 20 μM etoposide. Two days after etoposide removal, ~70% of the cells were SA-β-gal+. Cells were treated for 48 h with different concentrations of fisetin (1–15 μM) and the percentage of SA-β-gal+ cells was determined using C12FDG, as described above. Graphed are the relative number of viable cells compared to cultures treated with vehicle only (DMSO). All samples were analyzed in duplicate with 3–5 fields per well and reported as the mean ± S.D. Two-tailed unpaired Student's t-test. Plotted is the mean ± SEM. *p < .05, **p < .01, ***p < .001, ****p < .0001.
Fig. 2
Fig. 2
Intermittent treatment of progeroid mice with fisetin reduces senescent cell burden. (A) Representative image of age-matched, 12 week-old male p16+/Luc;Ercc1−/∆ mice fed a diet containing 500 ppm (500 mg/kg) fisetin, or drug-free control diet. (B) Luciferase signal was measured biweekly in p16+/Luc;Ercc1−/∆ mice fed either control chow or chow containing 500 ppm fisetin, n = 4–10 mice per group and time point. The fisetin was administrated intermittently for two weeks at a time (yellow bars). Otherwise the mice were fed a control diet. (C) The same data as seen in (B), but plotted as the percent change in luciferase signal as the animals aged. Values represented as the mean ± SEM. Two-tailed unpaired Student's t-test. ***p < .001, ****p < .0001.
Fig. 3
Fig. 3
Chronic fisetin treatment reduces senescence in progeroid mice. (A-D) Tissues from 20-week-old male and female Ercc1−/∆ mice chronically exposed to fisetin through their diet or fed a control diet were analyzed for the expression of senescence (p16Ink4a and p21) and senescence-associated secretory phenotype (SASP) (Il1β, Il6, Il10, Tnfα, Cxcl2, Mcp1, and Pai1) markers using qRT-PCR. Age-matched WT mouse tissues were used to normalize expression. n = 4–10 mice per group. Graphed is the mean ± S.E.M. One-way ANOVA with Tukey's multiple comparison test. (E) Quantitation of senescence and SASP markers in CD3+ peripheral T cells isolated from the same mice. mRNA levels were measured by qRT-PCR. (F) 4-hydroxynonenal (HNE) adducts were measured in liver (n = 4–5 mice per group) by ELISA as an index of oxidative stress. (G) Reduced (GSH) and oxidized glutathione (GSSG) were quantified in liver (n = 4–5 mice per group) as an index of antioxidant buffering capacity. Differences were assessed by two-tailed unpaired Student's t-test. Values represented as the mean ± SEM. *p < .05, **p < .01, ***p < .001, ****p < .0001.
Fig. 4
Fig. 4
Acute fisetin treatment reduces senescent cell burden in aged wild-type mice and human explants. (A) 22–24-month-old WT C57BL/6 mice were given fisetin (100 mg/kg) or vehicle for 5 days by oral gavage. 72 h after the final dose, the mice were sacrificed and the SA-β-gal+ cells were quantified in inguinal fat (n = 6–7 mice per group). Two-tailed unpaired Student's t-test, **p < .01. (B) Schematic diagram of the INK-ATTAC transgene [25]. Expression of FLAG-tagged FKBP-Caspase-8 protein is driven by the p16Ink4a promoter enabling detection of p16-expressing cells in tissues using immunodetection of FLAG. (C) Aged INK-ATTAC male mice (22–24 months) were acutely treated with fisetin as described above and CyTOF analysis used to quantify p16Ink4a/FLAG+ cell populations in subcutaneous fat tissue (c-kit+ mesenchymal stem cells, CD4+ and CD8+ T cells, NK-1.1+ NK cells, and CD146+CD31+ for endothelial cells). Subcutaneous fat tissue from 6 month-old male mice was used as a control. (D) Quantification of another marker of cellular senescence in the same cell populations (CENP-B+ cells). The data are plotted as the mean ± SEM based on n = 9 mice per group. One-way ANOVA with Tukey's multiple comparison test. (E) Human adipose tissue explants (n = 3) were treated with 20 μM fisetin for 48 h, then washed and placed in fresh media for 24 h in order to condition the media. The adipose tissue explants were then stained to measure the percent of SA-ß-gal+ cells. (F) Cytokine and chemokine levels were measured in the conditioned media from the adipose tissue explants using multiplex protein analyses and normalized to adipose tissue weight (n = 3 biological replicates). The results are plotted as the percent expression of various cytokines relative to samples from the same individual treated with vehicle only. Two-tailed paired Student's t-test. Values represented as the mean ± SEM. *p < .05, **p < .01, ***p < .001.
Fig. 5
Fig. 5
Late-life intervention with fisetin in aged wild-type mice extends health span and lifespan. (A) At 85-weeks of age (>20 mth), male and female mice were administered a diet containing 500 ppm (500 mg/kg) fisetin or fed a control diet with no drug. Lifespan was measured. n = 8–9 mice per group. Log rank (Mantel-Cox) test. (B) Median lifespan of the same cohort of mice. Each dot represents an individual animal. Black bars indicate the mean ± S.E.M. Two-tailed unpaired Student's t-test. (C) Clinical chemistry on blood from the above mice to measure markers of liver (alanine aminotransferase/ALT) and pancreatic (amylase/AMY) dysfunction. n = 3–6 mice per group. Two-tailed unpaired Student's t-test. (D) Composite lesion scores for aged-related pathologies in multiple tissues determined by histopathologic analysis according to the criteria of the Geropathology Grading Platform [63]. n = 3–8 mice per group. Two-tailed unpaired Student's t-test. (E) Representative images of the kidney of a mouse fed control chow or fisetin chow. In the control mouse, arrows (from left to right) indicate increased cellularity at a segment of the glomerular capsule border, moderate levels of lymphoid aggregates, and tubular cell vacuolization. In the fisetin-treated mouse, the arrow indicates only mild segmental cellularity at the glomerular capsule border and a few scattered lymphoid cells near the glomerulus (200× magnification). (F-I)—Tissues from >120-week-old mice (~30 mth) fed control or fisetin chow were analyzed for the presence of senescence (p16Ink4a and p21) and senescence-associated secretory phenotype (SASP) (Il1β, Il6, Il10, Tnfα, Cxcl2, Mcp1, and Pai1) markers by qRT-PCR. Results are expressed as a function of values in 16–18-week-old “Young” WT mice. n = 4–10 mice per group. One-way ANOVA with Tukey's multiple comparison test. (J) Senescence and SASP marker expression were measured in CD3+ peripheral T cells by qRT-PCR. Results are expressed as a function of values in 16–18-week-old “Young” WT mice. n = 4–6 mice per group. One-way ANOVA with Tukey's multiple comparison test. (K) Circulating levels of the SASP factor chemokine MCP-1 were measured by ELISA. n = 5 mice per group. One-way ANOVA with Tukey's multiple comparison test. (L) 4-hydroxynonenal (HNE) adducts a marker of lipid peroxidation and oxidative stress measured by ELISA in liver. n = 5–6 mice per group. Two-tailed unpaired Student's t-test. (M) The ratio of reduced (GSH) to oxidized (GSSG) glutathione was measured as an index oxidative stress. n = 6–7 mice per group. Values represented as the mean ± SEM. Two-tailed unpaired Student's t-test. *p < .05, **p < .01, ***p < .001, ****p < .0001.

Comment in

References

    1. Tchkonia T., Zhu Y., van Deursen J., Campisi J., Kirkland J.L. Cellular senescence and the senescent secretory phenotype: therapeutic opportunities. J Clin Invest. 2013;123(3):966–972. - PMC - PubMed
    1. Lebrasseur N.K., Tchkonia T., Kirkland J.L. Cellular senescence and the biology of aging, disease, and frailty. Nestle Nutr Inst Workshop Ser. 2015;83:11–18. - PMC - PubMed
    1. Zhu Y., Armstrong J.L., Tchkonia T., Kirkland J.L. Cellular senescence and the senescent secretory phenotype in age-related chronic diseases. Curr Opin Clin Nutr Metab Care. 2014;17(4):324–328. - PubMed
    1. Swanson E.C., Manning B., Zhang H., Lawrence J.B. Higher-order unfolding of satellite heterochromatin is a consistent and early event in cell senescence. J Cell Biol. 2013;203(6):929–942. - PMC - PubMed
    1. Kirkland J.L. Translating the science of aging into therapeuticiInterventions. Cold Spring Harb Perspect Med. 2016;6(3) - PMC - PubMed

MeSH terms