. 2018 Nov;28(11):1688-1700.
doi: 10.1101/gr.239913.118. Epub 2018 Oct 2.

Chromatin conformation and transcriptional activity are permissive regulators of DNA replication initiation in Drosophila

Affiliations

Chromatin conformation and transcriptional activity are permissive regulators of DNA replication initiation in Drosophila

Robin L Armstrong et al. Genome Res. 2018 Nov.

Abstract

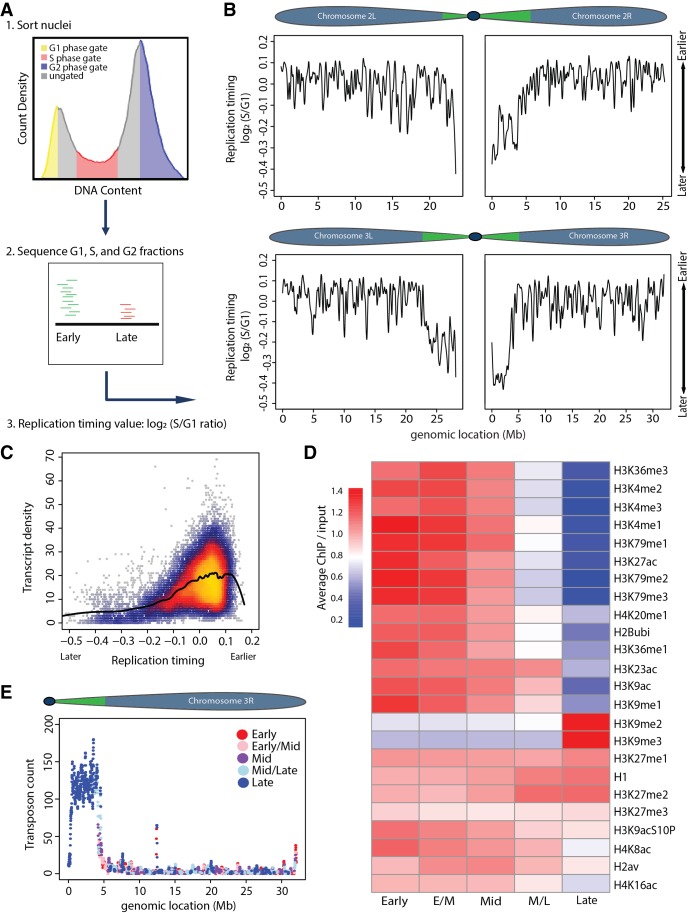
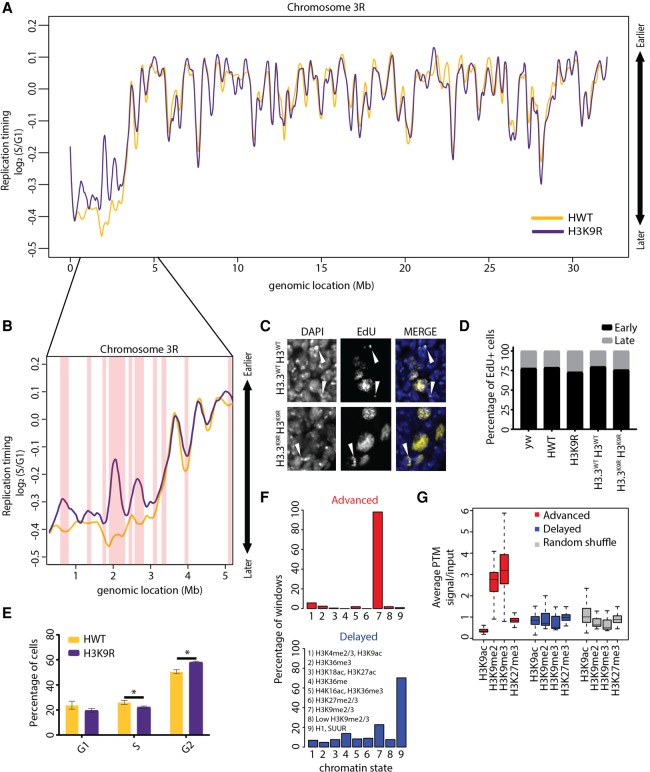
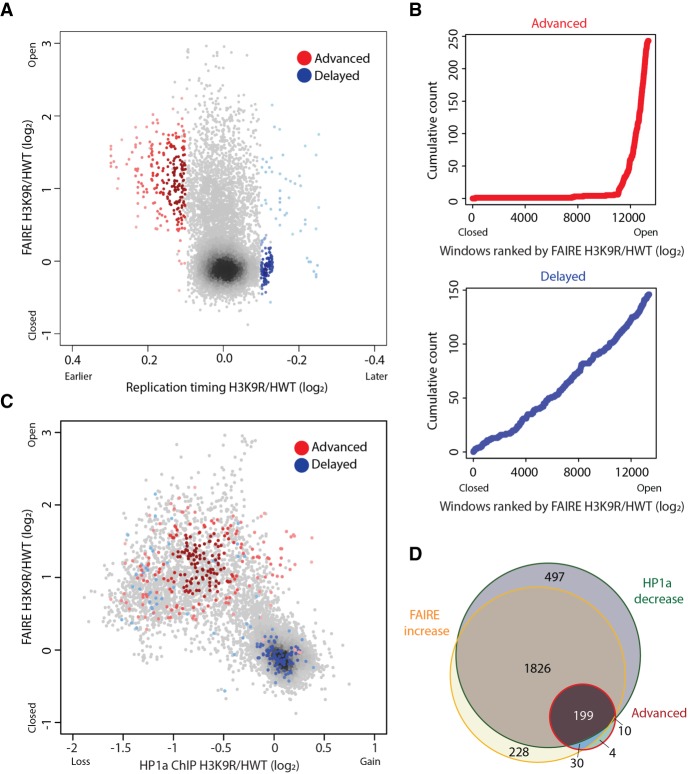
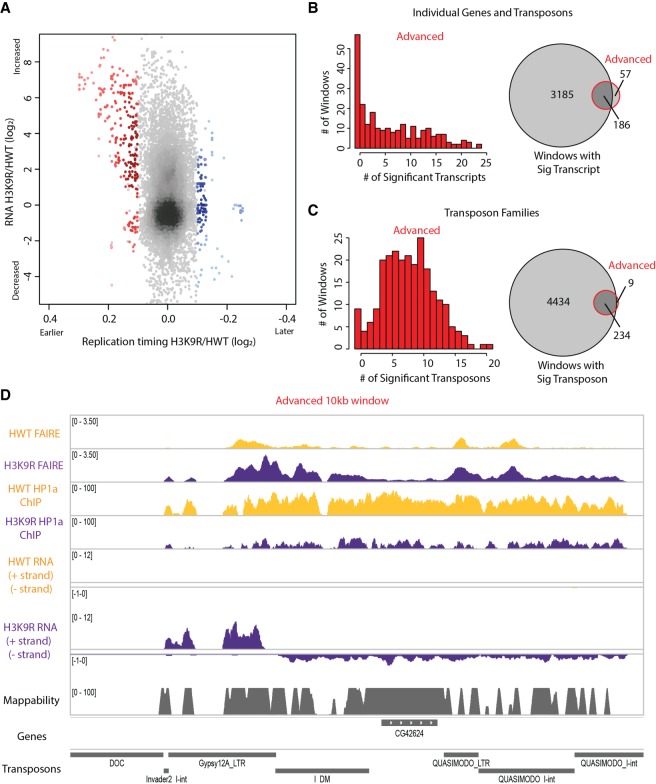
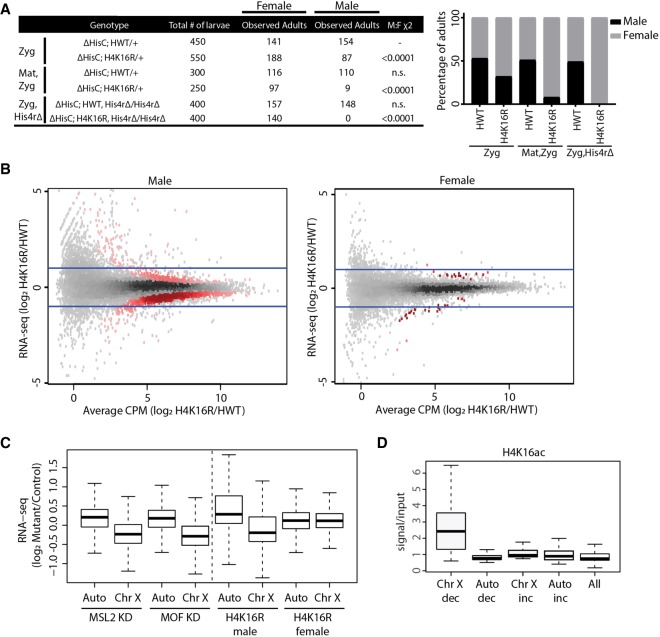
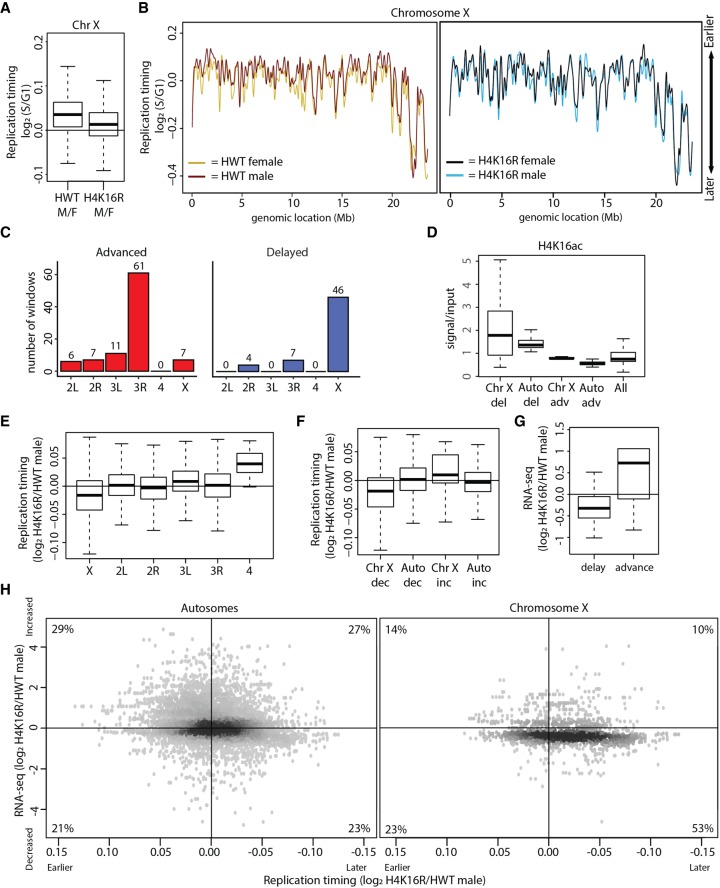
Chromatin structure has emerged as a key contributor to spatial and temporal control over the initiation of DNA replication. However, despite genome-wide correlations between early replication of gene-rich, accessible euchromatin and late replication of gene-poor, inaccessible heterochromatin, a causal relationship between chromatin structure and replication initiation remains elusive. Here, we combined histone gene engineering and whole-genome sequencing in Drosophila to determine how perturbing chromatin structure affects replication initiation. We found that most pericentric heterochromatin remains late replicating in H3K9R mutants, even though H3K9R pericentric heterochromatin is depleted of HP1a, more accessible, and transcriptionally active. These data indicate that HP1a loss, increased chromatin accessibility, and elevated transcription do not result in early replication of heterochromatin. Nevertheless, a small amount of pericentric heterochromatin with increased accessibility replicates earlier in H3K9R mutants. Transcription is de-repressed in these regions of advanced replication but not in those regions of the H3K9R mutant genome that replicate later, suggesting that transcriptional repression may contribute to late replication. We also explored relationships among chromatin, transcription, and replication in euchromatin by analyzing H4K16R mutants. In Drosophila, the X Chromosome gene expression is up-regulated twofold and replicates earlier in XY males than it does in XX females. We found that H4K16R mutation prevents normal male development and abrogates hyperexpression and earlier replication of the male X, consistent with previously established genome-wide correlations between transcription and early replication. In contrast, H4K16R females are viable and fertile, indicating that H4K16 modification is dispensable for genome replication and gene expression.


Figures

Figure 1.
Figure 1.
Measuring genome-wide replication timing in vivo. (A) Experimental paradigm: (1) Nuclei were FACS sorted into G1 (yellow), S (red), and G2 (blue) populations based on DNA content. (2) Sequenced DNA was mapped to the dm6 genome. More reads map to early than late replicating sequences. (3) Log2 S/G1 ratio generates RT profiles. Normalizing to G1 or G2 phase controls gave similar results. (B) LOESS regression line showing average yw (“yellow, white” control genetic background used for all fly lines) RT values (log2 S/G1) in 100-kb windows with 10-kb slide across Chr 2 and 3. Chromosome schematics show approximate locations of constitutive pericentric heterochromatin (green) and largely euchromatic arms (blue) (Riddle et al. 2011; Hoskins et al. 2015). (C) Heatscatter plot of yw log2 S/G1 (RT) versus gene density at all 10-kb windows across the genome with LOESS regression line (black). (D) Heat map of relative modENCODE histone PTM enrichment in bins of equally sized RT quintiles (early, early/mid, mid, mid/late, and late) generated using RT values (log2 S/G1) within 100-kb windows. modENCODE data are from third instar larvae (Celniker et al. 2009; see Supplemental Materials for accession numbers). Color indicates average enrichment of all windows within a quintile. Scale of heat map was capped at 1.4 to better represent distribution of values, as H3K9me2/me3 was greatly enriched in late replicating domains compared to other PTMs (see Supplemental Fig. S2E for noncapped H3K9me2/me3 heat map). (E) Plot of transposon number in 100-kb windows across Chr 3R with RT quintile (as determined in D) indicated by color.
Figure 2.
Figure 2.
Analysis of replication timing in H3K9R mutants. (A) Log2 S/G1 RT values at 100-kb windows with 10-kb slide for 12× HWT (histone wild type; yellow) and 12× H3K9R (purple) plotted across Chr 3R. See Supplemental Figure S5 for other chromosomes. (B) Approximately 5-Mb region of the pericentromeric heterochromatin of Chr 3R. Red vertical bars designate significant RT changes between H3K9R and HWT (P < 0.01, P value adjusted for multiple testing; absolute log2 fold change > 0.1; limma). (C) H3.3WT H3WT and H3.3K9R H3K9R (see Supplemental Materials for full genotype) first instar brains pulse-labeled for 1 h with EdU (yellow) and stained for DNA (blue; DAPI). White arrowheads designate late patterned EdU incorporation. (D) Percentage of EdU+ cells with early or late EdU incorporation patterns from ∼200 cells per genotype. There is no difference between genotypes (P > 0.05, χ2 test). (E) Cell cycle indices for HWT (yellow) and H3K9R (purple) wing disc cells acquired via FACS (calculated using the Dean-Jett-Fox model). Error bars indicate standard deviation of three experiments. (*) P < 0.05. (F) All advanced (red) or delayed (blue) 10-kb windows in H3K9R mutants were assigned to the nine chromatin states defined in flies (Kharchenko et al. 2011). Shown are the percentages of windows that overlap each chromatin state. (G) Average enrichment of modENCODE H3K9ac, me2, me3, and H3K27me3 signal from third instar larvae at 10-kb windows of advanced (red), delayed (blue), or randomized set of windows (Celniker et al. 2009).
Figure 3.
Figure 3.
Open chromatin is permissive to advancement but not delay of replication timing. (A) Heatscatter plot of the H3K9R/HWT ratio of RT values (log2 S/G1) versus the H3K9R/HWT ratio of FAIRE signal at all 10-kb windows across the major chromosome scaffolds; 10-kb windows with significantly advanced (red) or delayed (blue) RT are indicated. Darker color indicates higher density of windows. (B) Cumulative count of advanced (red) or delayed (blue) 10-kb windows ordered by increasing FAIRE signal in H3K9R compared to HWT. (C) Heatscatter plot of the H3K9R/HWT ratio of HP1a ChIP signal versus the H3K9R/HWT ratio of FAIRE signal at all 10-kb windows across the major chromosome scaffolds. (D) Venn diagram of all 10-kb windows with significantly altered FAIRE or HP1a signal in H3K9R compared to HWT (P < 0.01; edgeR). For all panels, significantly different RT was determined as P < 0.05, log2 fold change > 0.1 using limma.
Figure 4.
Figure 4.
Altered transposon expression occurs at advanced replication domains in H3K9R mutants. (A) Heatscatter plot of the H3K9R/HWT ratio of RT values (log2 S/G1) plotted versus the H3K9R/HWT ratio of RNA-seq signal at all 10-kb windows across major chromosome scaffolds. RNA-seq differences were determined based on the transcript with the lowest P-value across the 10-kb window; 10-kb windows with significantly advanced (red) and delayed (blue) RT are indicated (P < 0.05, log2 fold change > 0.1; limma). (B) Histogram of the number of differentially expressed transcripts in 10-kb windows of advanced replication (red; left). Venn diagram comparing the number of windows with differentially expressed transcripts and number of windows with advanced replication (right). (C) Histogram of the number of transposons belonging to a differentially expressed transposon family in 10-kb windows of advanced replication (red; left). Venn diagram comparing the number of windows with a transposon belonging to a differentially expressed transposon family to the number of windows with advanced replication (right). (D) Browser shot of a 10-kb window (Chr 3R: 2,130,000–2,140,000) with advanced replication. HWT (yellow) and H3K9R (purple) FAIRE-seq, HP1a ChIP-seq, and RNA-seq data plotted in the context of mappability, genes, and transposons.
Figure 5.
Figure 5.
H4K16 promotes hyperexpression of the Drosophila male X Chromosome. (A) Table showing the number of adult females and males resulting from homogeneous vial cultures of 50 first instar larvae of the indicated genotypes (see Supplemental Materials for crosses and complete genotypes). Either only the zygotic (rows 1 and 2) or the maternal and zygotic histones (rows 3 and 4) were of the replication-dependent HWT and H4K16R genotypes. In rows 5 and 6, homozygous deletion of the His4r gene was combined with zygotic, replication-dependent HWT and H4K16R genotypes. The χ2 comparisons were performed using the zygotic HWT male to female results (row 1) as the expected classes. The right panel shows the percentage of viable male (black) and female (gray) adults for H4K16R and HWT. (B) Heatscatter plot of the H4K16R/HWT ratio of RNA-seq signal of individual genes from third instar wing imaginal discs. Statistically different transcripts between H4K16R and HWT males (left panel) or females (right panel) are indicated in red (P < 0.05, edgeR). Blue lines indicate a twofold change. (C) Box plot of RNA-seq signal from autosomes and Chr X after MSL2 or MOF knockdown in male S2 cells (Zhang et al. 2010) and in H4K16R/HWT male and female wing discs on autosomes (Auto) and Chr X. (D) Average enrichment of modENCODE H4K16ac signal from male third instar larvae at 10-kb windows of significantly (P < 0.05) decreased (dec) or increased (inc) transcript expression between H4K16R and HWT males on Chr X and autosomes (Auto) or at all 10-kb windows (GSE49497) (Celniker et al. 2009).
Figure 6.
Figure 6.
H4K16R mutation reduces gene expression and delays replication of the male X Chromosome. (A) Box plot of HWT male/female and H4K16R male/female ratios of RT values (log2 S/G1) on Chr X. (B) LOESS regression line applied to log2 S/G1 averaged replicates from HWT female (yellow) and HWT male (maroon) and H4K16R female (black) and HWT male (blue) plotted across Chr X (100-kb windows, 10-kb slide). Note that the male X Chromosome generally replicates earlier in HWT, but not in H4K16R mutants. (C) Histogram of 10-kb windows with advanced (red) or delayed (blue) RT between H4K16R and HWT males on major chromosome scaffolds (P < 0.05; absolute log2 fold change > 0.1; limma). (D) Average enrichment of modENCODE H4K16ac signal from male third instar larvae at 10-kb windows of delayed (del) or advanced (adv) replication between H4K16R and HWT males on Chr X and autosomes (Auto) or at all 10-kb windows (GSE49497) (Celniker et al. 2009). (E) Box plot of the H4K16R/HWT ratio of male RT values (log2 S/G1) on all major chromosome scaffolds. (F) Box plot of the H4K16R/HWT ratio of male RT values (log2 S/G1) at 10-kb windows of decreased or increased RNA-seq signal on Chr X or autosomes (Auto) (P < 0.05). (G) Box plot of the H4K16R/HWT ratio of male RNA-seq signal at 10-kb windows of delayed or advanced RT (P < 0.05). (H) Heatscatter plot of the H4K16R/HWT ratio of male RT values (log2 S/G1) plotted versus the H4K16R/HWT ratio of male RNA-seq signal at all 10-kb windows across the autosomes (left) and Chr X (right). RNA-seq differences were determined based on the transcript with the lowest P-value across the 10-kb window. The percentage of 10-kb windows present in each quadrant is indicated.

References

    1. Aggarwal BD, Calvi BR. 2004. Chromatin regulates origin activity in Drosophila follicle cells. Nature 430: 372–376. - PubMed
    1. Almeida R, Fernández-Justel JM, Santa-María C, Cadoret J-C, Cano-Aroca L, Lombraña R, Herranz G, Agresti A, Gómez M. 2018. Chromatin conformation regulates the coordination between DNA replication and transcription. Nat Commun 9: 1590. - PMC - PubMed
    1. Bell SP, Stillman B. 1992. ATP-dependent recognition of eukaryotic origins of DNA replication by a multiprotein complex. Nature 357: 128. - PubMed
    1. Bell O, Schwaiger M, Oakeley EJ, Lienert F, Beisel C, Stadler MB, Schubeler D. 2010. Accessibility of the Drosophila genome discriminates PcG repression, H4K16 acetylation and replication timing. Nat Struct Mol Biol 17: 894–900. - PubMed
    1. Buscaino A, Kocher T, Kind JH, Holz H, Taipale M, Wagner K, Wilm M, Akhtar A. 2003. MOF-regulated acetylation of MSL-3 in the Drosophila dosage compensation complex. Mol Cell 11: 1265–1277. - PubMed

Publication types