

Gene Expression Profiling Reveals Aberrant T-cell Marker Expression on Tumor Cells of Waldenström's Macroglobulinemia
- PMID: 30279229
- PMCID: PMC6320275
- DOI: 10.1158/1078-0432.CCR-18-1435
Gene Expression Profiling Reveals Aberrant T-cell Marker Expression on Tumor Cells of Waldenström's Macroglobulinemia
Abstract
Purpose: That the malignant clone of Waldenström's macroglobulinemia (WM) demonstrates significant intraclonal heterogeneity with respect to plasmacytoid differentiation indicates the mechanistic complexity of tumorigenesis and progression. Identification of WM genes by comparing different stages of B cells may provide novel druggable targets.
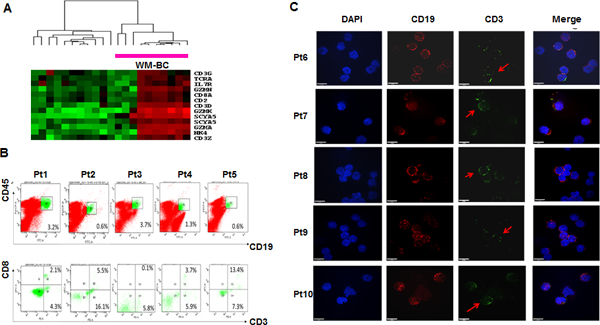
Experimental design: The gene expression signatures of CD19+ B cells (BC) and CD138+ plasma cells (PC) from 19 patients with WM were compared with those of BCs from peripheral blood and tonsil and to those of PCs from the marrow of healthy (N-PC) and multiple myeloma donors (MM-PC), as well as tonsil (T-PC). Flow cytometry and immunofluorescence were used to examine T-cell marker expression on WM tumor cells.
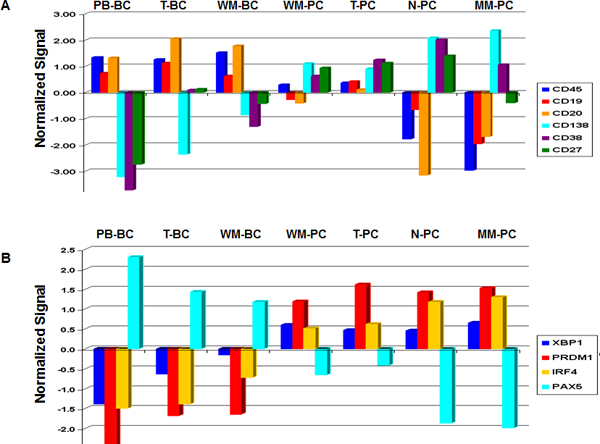
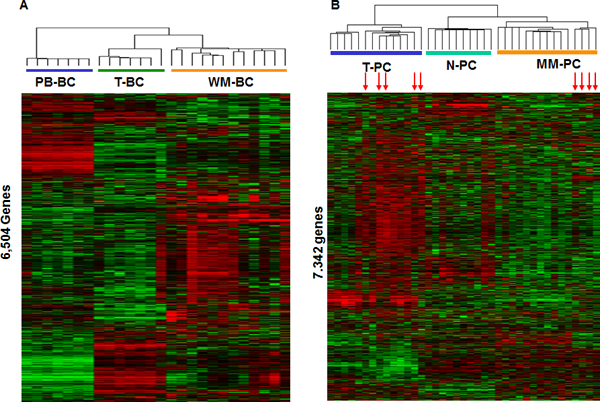
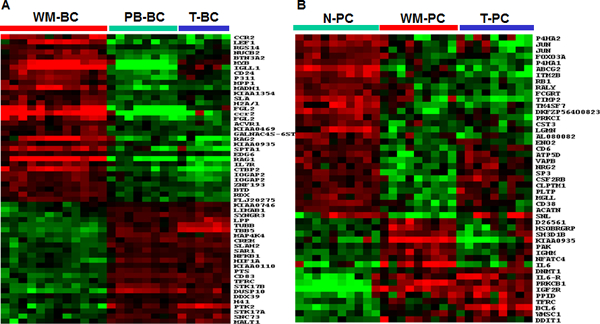
Results: Consistent with defective differentiation, both BCs and PCs from WM cases expressed abnormal differentiation markers. Sets of 55 and 46 genes were differentially expressed in WM-BC and WM-PC, respectively; and 40 genes uniquely dysregulated in WM samples were identified. Dysregulated genes included cytokines, growth factor receptors, and oncogenes not previously implicated in WM or other plasma cell dyscrasias. Interestingly, strong upregulation of both IL6 and IL6R was confirmed. Supervised cluster analysis of PC revealed that marrow-derived WM-PC was either MM-PC-like or T-PC-like, but not N-PC-like. The aberrant expression of T-cell markers was confirmed at the protein level in WM-BC.
Conclusions: We showed that comparative microarray profiles allowed gaining more comprehensive insights into the biology of WM. The data presented here have implications for the development of novel therapies, such as targeting aberrant T-cell markers in WM.
©2018 American Association for Cancer Research.
Conflict of interest statement
Disclosure of Potential Conflicts of Interest
No potential conflicts of interest were disclosed.
Figures
Similar articles
-
Gene expression profiling of B lymphocytes and plasma cells from Waldenström's macroglobulinemia: comparison with expression patterns of the same cell counterparts from chronic lymphocytic leukemia, multiple myeloma and normal individuals.Leukemia. 2007 Mar;21(3):541-9. doi: 10.1038/sj.leu.2404520. Epub 2007 Jan 25. Leukemia. 2007. PMID: 17252022
-
Proteomic analyses in Waldenstrom's macroglobulinemia and other plasma cell dyscrasias.Semin Oncol. 2003 Apr;30(2):156-60. doi: 10.1053/sonc.2003.50066. Semin Oncol. 2003. PMID: 12720127
-
Abnormalities in lymphocyte profile and specificity repertoire of patients with Waldenstrom's macroglobulinemia, multiple myeloma, and IgM monoclonal gammopathy of undetermined significance.Am J Hematol. 1989 Feb;30(2):53-60. doi: 10.1002/ajh.2830300202. Am J Hematol. 1989. PMID: 2536515
-
Angiogenesis in Waldenstrom's macroglobulinemia.Semin Oncol. 2003 Apr;30(2):262-4. doi: 10.1053/sonc.2003.50071. Semin Oncol. 2003. PMID: 12720149 Review.
-
Origins of Waldenstrom's macroglobulinemia: does it arise from an unusual B-cell precursor?Clin Lymphoma. 2005 Mar;5(4):217-9. doi: 10.3816/clm.2005.n.002. Clin Lymphoma. 2005. PMID: 15794851 Review.
Cited by
-
Therapeutic effects of oligo-single-stranded DNA mimicking of hsa-miR-15a-5p on multiple myeloma.Cancer Gene Ther. 2020 Dec;27(12):869-877. doi: 10.1038/s41417-020-0161-3. Epub 2020 Jan 28. Cancer Gene Ther. 2020. PMID: 31988477
-
Identification of a Candidate Gene Set Signature for the Risk of Progression in IgM MGUS to Smoldering/Symptomatic Waldenström Macroglobulinemia (WM) by a Comparative Transcriptome Analysis of B Cells and Plasma Cells.Cancers (Basel). 2021 Apr 12;13(8):1837. doi: 10.3390/cancers13081837. Cancers (Basel). 2021. PMID: 33921415 Free PMC article.
-
Aberrant Scinderin Expression Correlates With Liver Metastasis and Poor Prognosis in Colorectal Cancer.Front Pharmacol. 2019 Oct 31;10:1183. doi: 10.3389/fphar.2019.01183. eCollection 2019. Front Pharmacol. 2019. PMID: 31736743 Free PMC article.
-
Bispecific BCMA/CD24 CAR-T cells control multiple myeloma growth.Nat Commun. 2024 Jan 19;15(1):615. doi: 10.1038/s41467-024-44873-4. Nat Commun. 2024. PMID: 38242888 Free PMC article.
-
A biphenotypic lymphocyte subset displays both T- and B-cell functionalities.Commun Biol. 2024 Jan 5;7(1):28. doi: 10.1038/s42003-023-05719-9. Commun Biol. 2024. PMID: 38182721 Free PMC article.
References
Publication types
MeSH terms
Substances
Grants and funding
LinkOut - more resources
Full Text Sources
Research Materials
