. 2018 Nov 23;293(47):18337-18352.
doi: 10.1074/jbc.RA118.003975. Epub 2018 Oct 2.

Crystal structure of a human ubiquitin E1-ubiquitin complex reveals conserved functional elements essential for activity

Affiliations

Crystal structure of a human ubiquitin E1-ubiquitin complex reveals conserved functional elements essential for activity

Zongyang Lv et al. J Biol Chem. .

Abstract

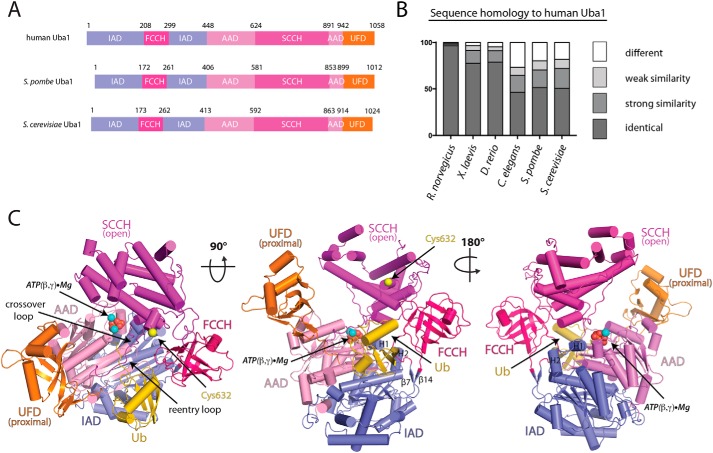
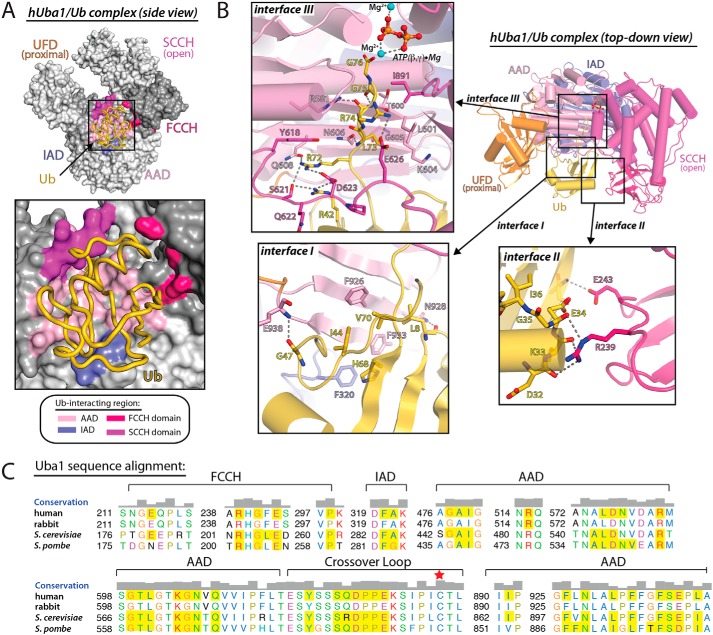
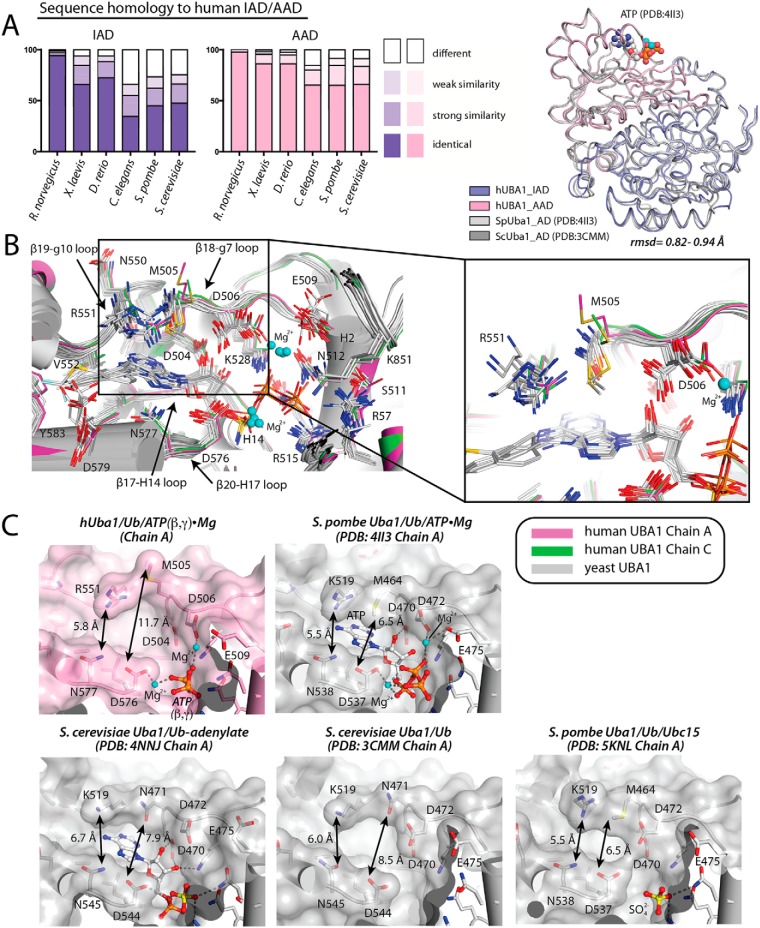
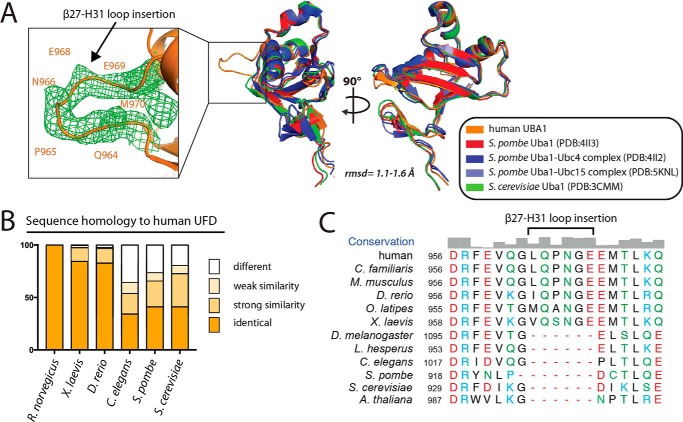
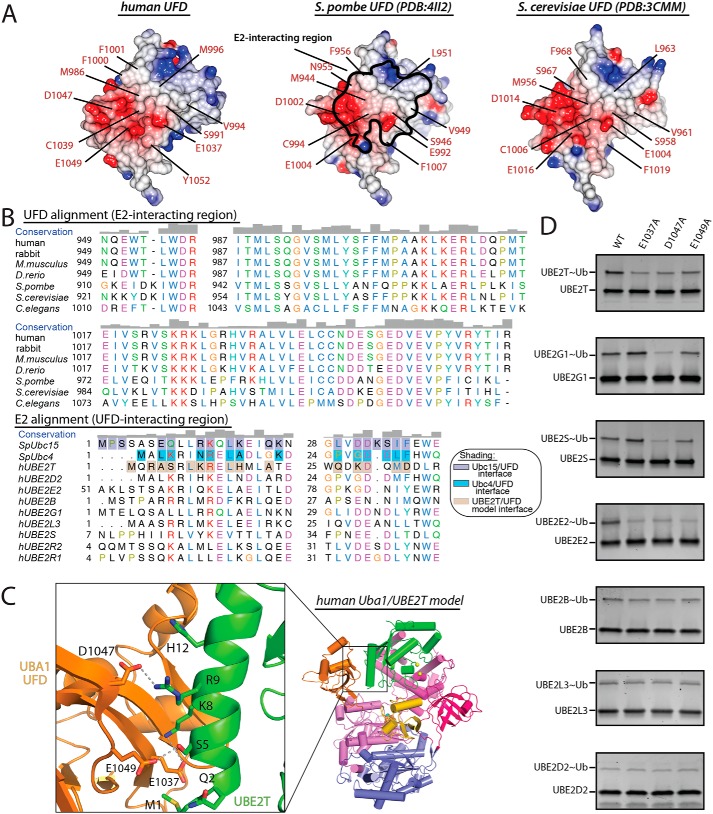
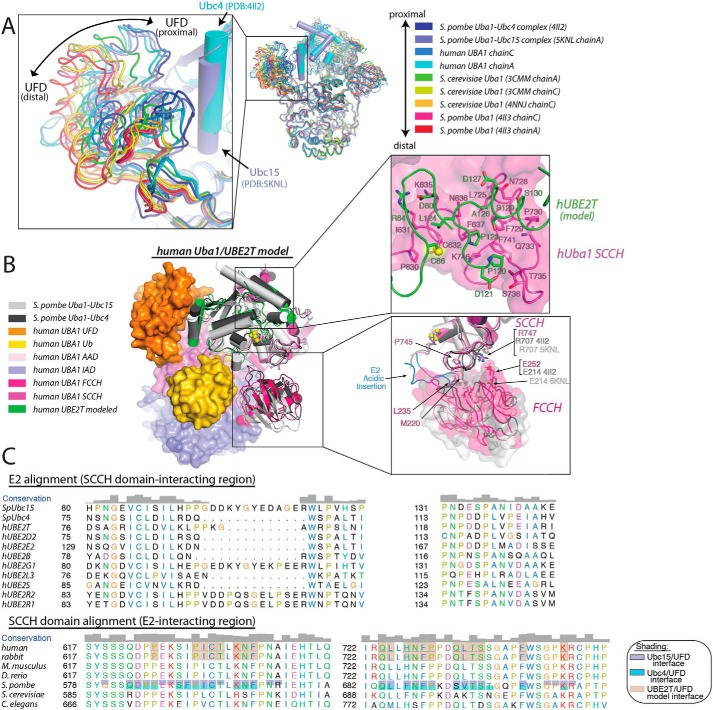
Ubiquitin (Ub) signaling plays a key regulatory role in nearly every aspect of eukaryotic biology and is initiated by E1 enzymes that activate and transfer Ub to E2 Ub-conjugating enzymes. Despite Ub E1's fundamental importance to the cell and its attractiveness as a target for therapeutic intervention in cancer and other diseases, its only available structural information is derived from yeast orthologs of human ubiquitin-like modifier-activating enzyme 1 (hUBA1). To illuminate structural differences between yeast and hUBA1 structures that might be exploited for the development of small-molecule therapeutics, we determined the first crystal structure of a hUBA1-Ub complex. Using structural analysis, molecular modeling, and biochemical analysis, we demonstrate that hUBA1 shares a conserved overall structure and mechanism with previously characterized yeast orthologs, but displays subtle structural differences, particularly within the active site. Computational analysis revealed four potential ligand-binding hot spots on the surface of hUBA1 that might serve as targets to inhibit hUBA1 at the level of Ub activation or E2 recruitment or that might potentially be used in approaches such as protein-targeting chimeric molecules. Taken together, our work enhances our understanding of the hUBA1 mechanism, provides an improved framework for the development of small-molecule inhibitors of UBA1, and serves as a stepping stone for structural studies that involve the enzymes of the human Ub system at the level of both E1 and E2.

Keywords: E1; X-ray crystallography; adenylation; conformational change; enzyme mechanism; enzyme structure; protein degradation; structure-function; thioester; ubiquitin.


Conflict of interest statement

The authors declare that they have no conflicts of interest with the contents of this article

Figures

Figure 1.
Figure 1.
Domain organization of Uba1 and overall structure of the human Uba1–Ub complex. A, domain organization of previously crystallized Uba1 orthologs with residue numbers at the domain boundaries listed above. B, overall amino acid sequence homology of select Uba1 orthologs to human Uba1. Strongly similar, weakly similar, and different residues were assigned according to ClustalX. C, hUba1–Ub complex is shown as a cartoon representation with Uba1 domains labeled and color-coded. Ub is colored gold. Only the β- and γ-phosphates of ATP and two accompanying magnesium ions (shown as spheres and labeled “ATP(β,γ)·Mg”) were included in the final model due to poor ordering of the adenine and ribose of ATP. The side chain of the catalytic cysteine of hUba1 (Cys-632) is shown as a yellow sphere.
Figure 2.
Figure 2.
Human Uba1–Ub interface involves a conserved network of interactions. A, top, hUba1 is shown as a surface representation with domains labeled and colored various shades of gray. hUba1 residues involved with contacts with ubiquitin are colored according to the domain where they reside (colored as in Fig. 1C). Ub is shown as a worm representation. Bottom, magnified view of the Uba1–Ub interface. B, hUba1–Ub structure is shown as a ribbon representation as in Fig. 1C with magnified views of Interfaces 1–3 interaction networks. Hydrogen bonds are indicated by dashed lines. C, sequence alignment of the Ub-interacting regions of Uba1 from the indicated species. Residue coloring and sequence conservation (shown as a bar graph above the alignment) were determined using default ClustalX parameters. Residues involved in contacts with Ub based on crystal structures are shaded yellow. Residue numbers are indicated to the left, and the domain to which the residues reside are indicated at top of the alignment.
Figure 3.
Figure 3.
Comparison of the human Uba1 active site to other Uba1 orthologs. A, left, amino acid sequence homology of the AAD and IAD of select Uba1 orthologs to human Uba1. Right, superposition of the AAD/IAD of S. pombe and S. cerevisiae Uba1 onto hUba1 with the r.m.s.d. range indicated below the structure (516 of 531 equivalent Cα atoms superimposed). ATP from the S. pombe Uba1–Ub/ATP·Mg structure (PDB code 4II3) is shown as spheres. B, left, adenylation domains of S. pombe and S. cerevisiae Uba1 (shown as cartoon representations and colored gray) from existing Uba1–Ub structures (PDB codes 4II2, 4II3, 3CMM, 4NNJ, 5KNL, 5L6H, 5L6I, and 5L6J) were superimposed onto hUba1. Residues involved in contacts with ATP, Uba1 inhibitor molecules, and magnesium are shown as sticks. Magnesium ions are shown as cyan spheres. Right, magnified view of three regions in the active site that exhibit sequence and conformational variability. C, ATP-binding pockets of the indicated structures of Uba1 are shown as semitransparent surface representations with cofactors and select Uba1 residues involved in contacts with cofactors shown as sticks. Regions of sequence and conformational divergence that result in differences in the shape of the ATP-binding pocket are labeled.
Figure 4.
Figure 4.
UFD of human Uba1 contains a unique loop insertion within a conserved overall structure. A, right, UFDs from the indicated Uba1 structures were superimposed onto the hUba1 UFD with the r.m.s.d. range indicated below the structure (110 of 119 eq Cα atoms superimposed). Left, magnified view of the β27–H31 loop insertion of hUba1 UFD, which is unique to vertebrates, with 2FoFc composite omit map electron density for the insertion shown as green mesh (contoured at 1σ). B, amino acid sequence homology of the UFD from select Uba1 orthologs to human Uba1. C, sequence alignment of the indicated Uba1 orthologs around the β27–H31 loop insertion of the hUba1 UFD. Residues are colored as in Fig. 2C.
Figure 5.
Figure 5.
Structural plasticity in human Uba1–E2 interactions. A, UFDs from the indicated Uba1 structures are shown as surface electrostatic representations. The E2-interacting region of S. pombe UFD is indicated with black outline, and residues involved in contacts with Ubc4 (PDB code 4II2) and Ubc15 (PDB code 5KNL) are highlighted in the middle panel. The corresponding residues of human and S. cerevisiae UFD are highlighted in the left and right panels. B, top, sequence alignment of the E2-interacting region of UFD, and bottom, the UFD-interacting region of E2s from the indicated species. Residues involved in intermolecular contacts in the Uba1–Ubc15 and Uba1–Ubc4 structures are shaded purple and cyan, respectively. Uba1 and UBE2T residues involved in contacts in the hUba1/UBE2T model are shaded gray. Residues are colored as in Fig. 2C. C, UFD/E2 interface of the hUba1/UBE2T model is shown as a cartoon representation with residues involved in intermolecular interactions shown as sticks. Putative hydrogen bonds are indicated by dashed lines. D, E1–E2 thioester assays of the indicated human E2s and hUba1 variants were performed as described under “Experimental procedures”.
Figure 6.
Figure 6.
Human Uba1 UFD adopts the E1–E2 thioester transfer-active proximal conformation. A, right, indicated Uba1 structures were superimposed by their adenylation domains with Uba1 shown as worm representations, and the E2s from the S. pombe Uba1–Ubc4 and Uba1–Ubc15 structures shown as cartoon representations. Left, magnified view of the UFDs of the superimposed structures, with the distal- and proximal-most conformations indicated. B, left, hUba1 from the Uba1/UBE2T model is shown as surface representation, and UBE2T is shown as a cartoon representation (green). Ubc4 (dark gray) from the S. pombe Uba1–Ubc4 structure and Ubc15 (light gray) and the FCCH domain (light gray) from Uba1–Ubc15 structure are also shown as cartoon representations for comparison. Top right, SCCH domain–UBE2T interface from the hUba1–UBE2T model is shown with Uba1 shown as semitransparent surface. hUba1 and UBE2T regions at the SCCH domain–UBE2T interface are shown as cartoon representations with residues involved in direct interactions shown as sticks. Bottom right, magnified view of the region around the FCCH/SCCH domain interface of the hUba1–UBE2T model and the S. pombe Uba1–Ubc15 structure. The SCCH domain is shown as semitransparent surface. Residues involved in conserved interactions between the SCCH and FCCH domain are shown as sticks. These interactions are disrupted in the Uba1–Ubc15 structure due to a rotation of the FCCH domain. C, top, sequence alignment of the SCCH domain-interacting region of E2s, and bottom, E2-interacting region of SCCH domains from the indicated species. Residues involved in intermolecular contacts in the Uba1–Ubc4 and Uba1–Ubc15 structures are shaded cyan and purple, respectively. Uba1 and UBE2T residues involved in contacts in the hUba1/UBE2T model are shaded gray.
Figure 7.
Figure 7.
Ligand-binding hot spots on human Uba1 predicted by FTmap analysis. A, center, hUba1 structure is shown as a cartoon representation as in Fig. 1C with the four top-scoring probe clusters identified by FTMap analysis shown as sticks and their corresponding binding pockets (HS1–4) on hUba1 labeled. Insets, magnified views of the four top-scoring probe clusters shown as sticks, with the corresponding hUba1-binding pockets shown as surface representations. B, left, S. pombe Uba1–Ubc4/Ub/ATP·Mg structure (PDB code 4II2) is shown as a surface representation with ATP shown as sticks in the same orientation as the HS1 inset in A. HS1 identified by FTMap analysis corresponds to the ATP-binding pocket of Uba1. Center, the S. pombe Uba1–Ubc15/Ub structure (PDB code 5KNL) is presented in the same orientation as HS2 in A with Uba1 shown as surface representation and Ubc15 shown as cartoon. The extended N terminus of Ubc15, which partially occupies HS2, is shown as sticks. Right, S. pombe Uba1–NSC624206 inhibitor complex structure (PDB code 5UM6) is presented in the same orientation as HS4 in A with hUba1 shown as a surface representation and NSC624206 shown as sticks.

References

    1. van der Veen A. G., and Ploegh H. L. (2012) Ubiquitin-like proteins. Annu. Rev. Biochem. 81, 323–357 10.1146/annurev-biochem-093010-153308 - DOI - PubMed
    1. Komander D., and Rape M. (2012) The ubiquitin code. Annu. Rev. Biochem. 81, 203–229 10.1146/annurev-biochem-060310-170328 - DOI - PubMed
    1. Popovic D., Vucic D., and Dikic I. (2014) Ubiquitination in disease pathogenesis and treatment. Nat. Med. 20, 1242–1253 10.1038/nm.3739 - DOI - PubMed
    1. Mattern M. R., Wu J., and Nicholson B. (2012) Ubiquitin-based anticancer therapy: carpet bombing with proteasome inhibitors vs. surgical strikes with E1, E2, E3, or DUB inhibitors. Biochim. Biophys. Acta 1823, 2014–2021 10.1016/j.bbamcr.2012.05.005 - DOI - PMC - PubMed
    1. Schulman B. A., and Harper J. W. (2009) Ubiquitin-like protein activation by E1 enzymes: the apex for downstream signalling pathways. Nat. Rev. Mol. Cell Biol. 10, 319–331 10.1038/nrm2673 - DOI - PMC - PubMed

Publication types

MeSH terms