

Co-inhibition of immunoproteasome subunits LMP2 and LMP7 is required to block autoimmunity
- PMID: 30279279
- PMCID: PMC6280796
- DOI: 10.15252/embr.201846512
Co-inhibition of immunoproteasome subunits LMP2 and LMP7 is required to block autoimmunity
Abstract
Cells of hematopoietic origin express high levels of the immunoproteasome, a cytokine-inducible proteasome variant comprising the proteolytic subunits LMP2 (β1i), MECL-1 (β2i), and LMP7 (β5i). Targeting the immunoproteasome in pre-clinical models of autoimmune diseases with the epoxyketone inhibitor ONX 0914 has proven to be effective. ONX 0914 was previously described as a selective LMP7 inhibitor. Here, we show that PRN1126, developed as an exclusively LMP7-specific inhibitor, has limited effects on IL-6 secretion, experimental colitis, and experimental autoimmune encephalomyelitis (EAE). We demonstrate that prolonged exposure of cells with ONX 0914 leads to inhibition of both LMP7 and LMP2. Co-inhibition of LMP7 and LMP2 with PRN1126 and LMP2 inhibitors LU-001i or ML604440 impairs MHC class I cell surface expression, IL-6 secretion, and differentiation of naïve T helper cells to T helper 17 cells, and strongly ameliorates disease in experimental colitis and EAE. Hence, co-inhibition of LMP2 and LMP7 appears to be synergistic and advantageous for the treatment of autoimmune diseases.
Keywords: autoimmune disease; immunoproteasome; immunoproteasome inhibitor design; proteasome.
© 2018 The Authors.
Figures
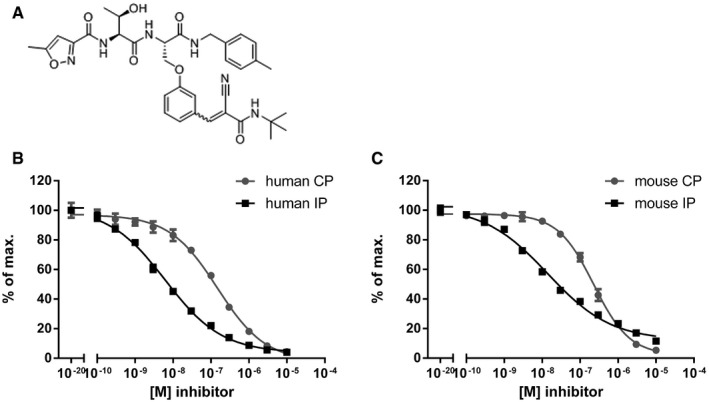
- A
Structure of PRN1126, a reversible covalent selective LMP7 inhibitor.
- B, C
Hydrolysis of fluorogenic substrates (Suc‐LLVY‐AMC) for the chymotrypsin‐like activity of human (B) or mouse (C) 20S constitutive proteasome (CP) or 20S immunoproteasome (IP) at various PRN1126 concentrations. Data are presented as the means ± s.d. from quadruplicate assays. The highest fluorescence value was set to 100%. The experiments were repeated twice with similar results.
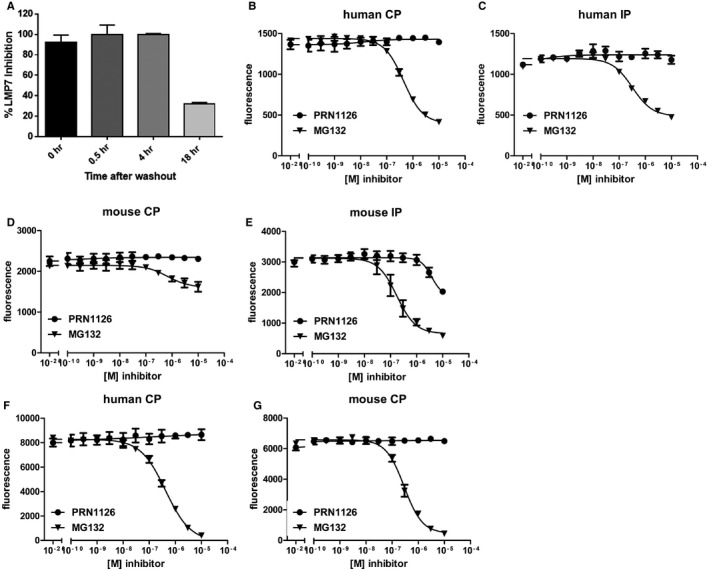
- A
PBMCs were treated with PRN1126 at 1 μM for 1 h, washed to remove compound, and incubated in media for the time indicated. LMP7 inhibition was determined by hydrolysis of fluorogenic substrate (Suc‐LLVY‐AMC). Data points represent the mean ± s.d. (n = 3).
- B–G
Hydrolysis of fluorogenic substrates Bz‐VGR‐AMC for trypsin‐like activity (B–E) or z‐LLE‐βNA for caspase‐like activity (F, G) of human (B, C, F) or mouse (D, E, G) 20S constitutive proteasome (B, D, F, G) or immunoproteasome (C, E) at various concentrations of PRN1126 and MG132. Data are presented as the means of fluorescence ± s.d. from quadruplicate assays. The experiments were repeated three times with similar results.
LCL721.174 cells expressing constitutive proteasomes (CP) or LCL721.145 cells expressing immunoproteasomes (IP) were treated with the indicated concentrations of the LMP7 inhibitor PRN1126. The chymotrypsin‐like activity in the cells was determined by the hydrolysis of the cell‐permeable fluorogenic proteasome substrate Meo‐Suc‐GLF‐AMC. Depicted is the mean ± s.d. % of maximal hydrolytic activity of triplicate cultures. The highest fluorescence value was set to 100%.
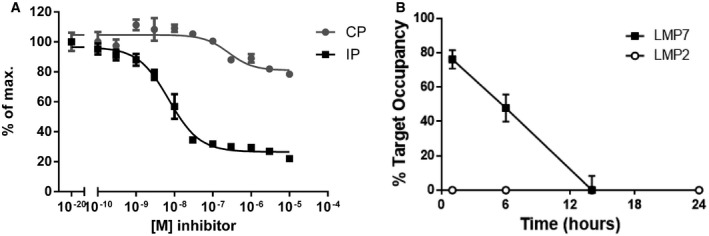
Mice were treated with a single dose of PRN1126 (40 mg/kg, s.c.) or vehicle. Spleens were harvested at the time points indicated, and the drug occupancy of LMP7 or LMP2 subunits was assessed in splenocytes with the ProCISE assay. Data points represent the means ± s.d. of three mice.
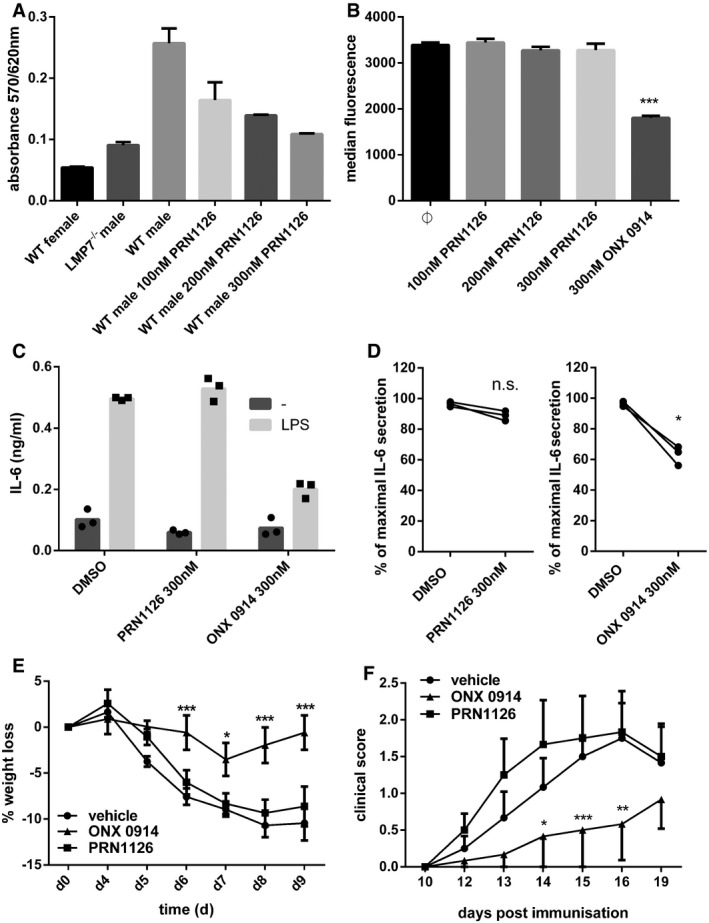
- A
Presentation of UTY246–254 on splenocytes after exposure to indicated concentrations of PRN1126. Data are presented as the mean absorbance ± s.d. of three replicate cultures. The experiment has been performed twice, yielding similar results.
- B
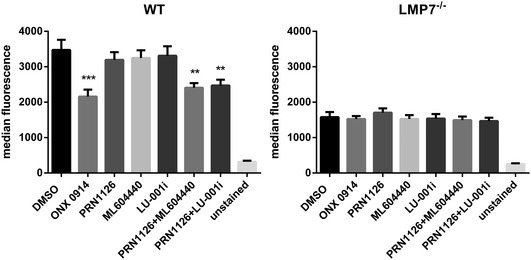
Flow cytometry analysis of H‐2Kb surface expression on splenocytes derived from C57BL/6 mice treated with the indicated concentrations of PRN1126 overnight. Pooled data from three independent experiments (n = 9) are shown as the means of median fluorescence intensity ± s.e.m. All data were statistically compared to the DMSO‐treated group. ***P < 0.001. One‐way ANOVA.
- C, D
Splenocytes from C57BL/6 mice (C) or human PBMCs (D) were exposed (continuous treatment) to 300 nM PRN1126, or vehicle (DMSO), or 300 nM ONX 0914 and stimulated with LPS overnight. IL‐6 concentrations in the supernatant were analyzed by ELISA. (C) IL‐6 concentrations are presented as mean and individual data points from triplicate wells. The experiment has been performed twice, yielding similar results. (D) Data are presented as single dots from three independent donors. The highest cytokine concentration was set to 100%. *P < 0.05. Unpaired Student's t‐test.
- E
Colitis was induced by oral administration of 3% DSS for 5 days. Mice were treated daily (s.c.) with either PRN1126 (40 mg/kg), or ONX 0914 (10 mg/kg), or vehicle. Data points represent mean ± s.e.m. of 15 mice pooled from three independent experiments. All data were statistically compared to the vehicle‐treated group. *P < 0.05, ***P < 0.001. Two‐way ANOVA.
- F
Mice were immunized with MOG35–55 peptide and were monitored daily for clinical symptoms of EAE. Mice were treated three times a week (s.c.) with either PRN1126 (40 mg/kg), or ONX 0914 (10 mg/kg), or vehicle. All data were statistically compared to the vehicle‐treated group. *P < 0.05, **P < 0.01, ***P < 0.001. Two‐way ANOVA. Shown are the means of the clinical scores ± s.e.m. (n = 6 per group). The experiments have been performed twice, yielding similar results.
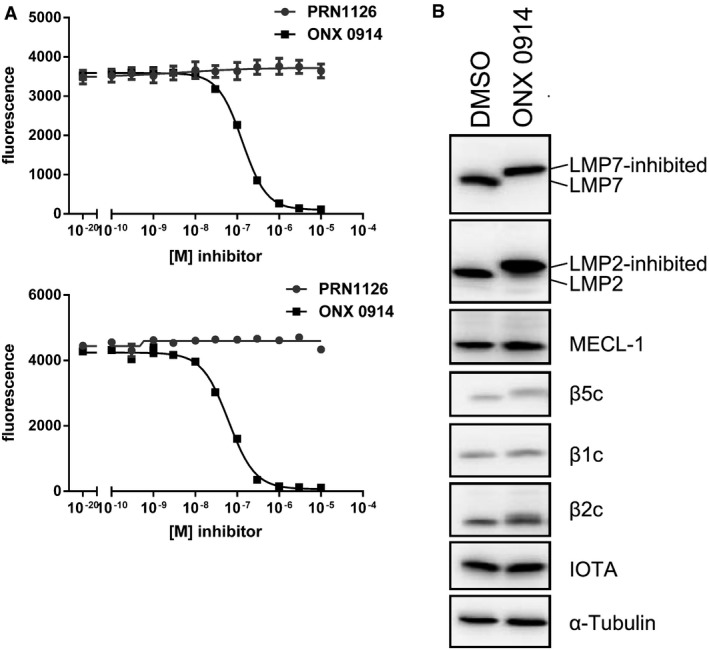
Hydrolysis of fluorogenic substrates (Ac‐PAL‐AMC) for LMP2 activity of human (upper panel) or mouse (lower panel) 20S immunoproteasome at various concentrations of PRN1126 or ONX 0914. Data are presented as the means of fluorescence ± s.d. from quadruplicate assays. The experiments were repeated three times with similar results.
Altered electrophoretic mobility of IP subunits by covalent modification with ONX 0914. Ficoll‐enriched lymphocytes from C57BL/6 mice were treated with DMSO or 300 nM ONX 0914 for 2 h in vitro. SDS–PAGE and immunoblotting against indicated proteins were performed. Shown are representative Western blots out of three independent experiments with similar outcome.
- A
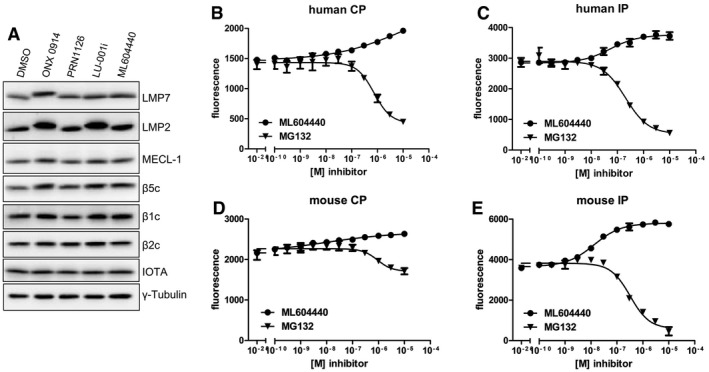
Ficoll‐enriched lymphocytes from C57BL/6 mice were treated with DMSO, 300 nM ONX 0914, 300 nM PRN1126, 300 nM LU‐001i, or 300 nM ML604440 for 2 h in vitro. SDS–PAGE and immunoblotting against indicated proteins were performed. Shown are representative Western blots out of two independent experiments with similar outcome.
- B–E
Hydrolysis of the fluorogenic substrate Bz‐VGR‐AMC for trypsin‐like activity of human (B, C) or mouse (D, E) 20S constitutive proteasome (B, D) or immunoproteasome (C, E) at various concentrations of ML604440 and MG132. Data are presented as the means of fluorescence ± s.d. from quadruplicate assays. The experiments were repeated three times with similar results.
- A, B
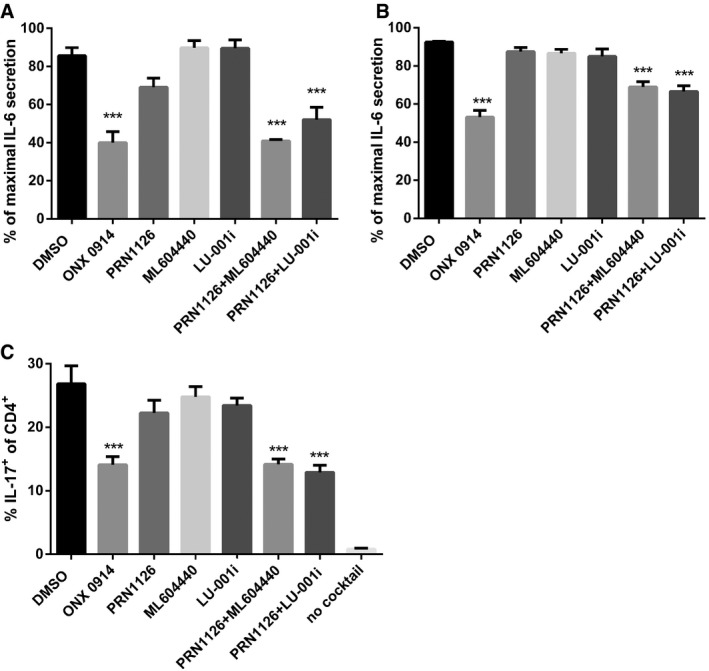
Splenocytes from C57BL/6 mice (A) or human PBMCs (B) were incubated (continuous treatment) with DMSO, ONX 0914 (300 nM), PRN1126 (300 nM), ML604440 (300 nM), LU‐001i (300 nM), PRN1126 + ML604440 (300 nM each), or PRN1126 + LU‐001i (300 nM each) and stimulated with LPS overnight. The IL‐6 concentration in the supernatant was analyzed by ELISA. The highest IL‐6 concentration from each experiment was set to 100%. (A) Data are presented as the mean ± s.e.m. of four independent experiments each measured in triplicates. (B) Data are presented as the mean ± s.e.m. of six different healthy donors. All data were statistically compared to the DMSO‐treated group. ***P < 0.001. One‐way ANOVA.
- C
The differentiation of CD4+ T cells isolated from the spleens of C57BL/6 mice that were exposed (continuous treatment) to DMSO, ONX 0914 (300 nM), PRN1126 (300 nM), ML604440 (300 nM), LU‐001i (300 nM), PRN1126 + ML604440 (300 nM each), or PRN1126 + LU‐001i (300 nM each) and that were stimulated with plate‐bound antibodies to CD3/CD28 in the presence of TGF‐β and IL‐6 and scavenging antibodies neutralizing IL‐4 and IFN‐γ was measured in 3‐day cultures. IL‐17 expression was detected by intracellular cytokine staining after a short restimulation with PMA/ionomycin. IL‐17 expression in activated T cells cultured in the absence of Th17‐polarizing conditions is shown as a comparison (no cocktail). Values reflect the percentage of CD4+ cells that are IL‐17A+. Data are presented as the means ± s.e.m. of three independent experiments each measured in triplicates. All data were statistically compared to the DMSO‐treated group. ***P < 0.001. One‐way ANOVA.
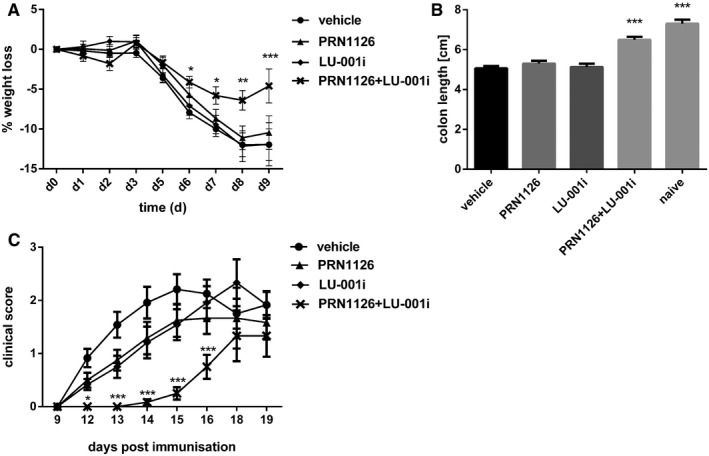
- A, B
Colitis was induced by oral administration of 3% DSS. Mice were treated daily (s.c.) with LU‐001i (15 mg/kg), PRN1126 (40 mg/kg), PRN1126 + LU‐001i (40 + 15 mg/kg), or vehicle starting from the begin of the experiment. Data points represent means ± s.e.m. of 15 mice pooled from three independent experiments. (A) The body weight of individual mice was monitored daily, and the percent weight loss (y‐axis) was plotted versus time (x‐axis). All data were statistically compared to the vehicle‐treated group. *P < 0.05, **P < 0.01, ***P < 0.001. Two‐way ANOVA. (B) On day 9 after initiation of DSS treatment, colon lengths were measured (n = 15). Naïve mice (n = 5) were used as healthy controls. All data were statistically compared to the vehicle‐treated group. ***P < 0.001. One‐way ANOVA.
- C
Mice were immunized with MOG35–55 peptide and were monitored daily for clinical symptoms of EAE. Mice were treated intermittently with three times a week (s.c.) schedule with LU‐001i (15 mg/kg), PRN1126 (40 mg/kg), PRN1126 + LU‐001i (40 + 15 mg/kg), or vehicle starting from the beginning of the experiment. Data points represent the means of the clinical scores ± s.e.m. of 12 mice pooled from two independent experiments. All data were statistically compared to the vehicle‐treated group. *P < 0.05, ***P < 0.001. Two‐way ANOVA.
References
-
- Huber EM, Basler M, Schwab R, Heinemeyer W, Kirk CJ, Groettrup M, Groll M (2012) Immuno‐ and constitutive proteasome crystal structures reveal differences in substrate and inhibitor specificity. Cell 148: 727–738 - PubMed
-
- Muchamuel T, Basler M, Aujay MA, Suzuki E, Kalim KW, Lauer C, Sylvain C, Ring ER, Shields J, Jiang J et al (2009) A selective inhibitor of the immunoproteasome subunit LMP7 blocks cytokine production and attenuates progression of experimental arthritis. Nat Med 15: 781–787 - PubMed
-
- Mundt S, Engelhardt B, Kirk CJ, Groettrup M, Basler M (2016) Inhibition and deficiency of the immunoproteasome subunit LMP7 attenuates LCMV‐induced meningitis. Eur J Immunol 46: 104–113 - PubMed
Publication types
MeSH terms
Substances
LinkOut - more resources
Full Text Sources
Other Literature Sources
Molecular Biology Databases
Research Materials
Miscellaneous
