Differences in Static and Kinetic Perimetry Results are Eliminated in Retinal Disease when Psychophysical Procedures are Equated
- PMID: 30280007
- PMCID: PMC6166892
- DOI: 10.1167/tvst.7.5.22
Differences in Static and Kinetic Perimetry Results are Eliminated in Retinal Disease when Psychophysical Procedures are Equated
Abstract
Purpose: We tested the hypothesis that clinical statokinetic dissociation (SKD, defined as the difference in sensitivity to static and kinetic stimuli) at the scotoma border in retinal disease is due to individual criterion bias and that SKD can be eliminated by equating the psychophysical procedures for testing static and kinetic stimulus detection.
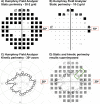
Methods: Six subjects with glaucoma and six with retinitis pigmentosa (RP) were tested. Clinical procedures (standard automated perimetry [SAP] and manual kinetic perimetry [MKP]) were used to determine clinical SKD and the region of interest for laboratory-based testing. Two-way Method of Limits (MoL) was used to establish the isocontrast region at the scotoma border in glaucoma and RP subjects. Method of Constant Stimuli (MoCS) and a two-interval forced choice (2IFC) procedure then were used to present static or kinetic (inward or outward) stimuli at different eccentricities within the isocontrast region. The results were fitted with psychometric functions to determine threshold eccentricities.
Results: Clinical SKD was found in glaucoma and RP subjects, with variable magnitude among subjects, but significantly exceeding expected typical measurement variability. The resultant psychometric functions when using MoCS and 2IFC showed equal sensitivity to static and kinetic targets, thus eliminating SKD.
Conclusions: Clinical SKD found using clinical techniques is due to methodologic differences and criterion bias, and is eliminated by using an equated and more objective psychophysical task, similar to normal subjects.
Translational relevance: Eliminating SKD using a psychophysical approach minimizing criterion bias suggests that it is not useful to distinguish between normal and diseased fields.
Keywords: Goldmann perimetry; glaucoma; retinitis pigmentosa; standard automated perimetry; statokinetic dissociation.
Figures


Similar articles
-
Physiologic statokinetic dissociation is eliminated by equating static and kinetic perimetry testing procedures.J Vis. 2016 Nov 1;16(14):5. doi: 10.1167/16.14.5. J Vis. 2016. PMID: 27829104
-
Quantification of stato-kinetic dissociation by semi-automated perimetry.Vision Res. 2006 Jan;46(1-2):117-28. doi: 10.1016/j.visres.2005.08.026. Epub 2005 Nov 2. Vision Res. 2006. PMID: 16260022
-
Temporal and spatial response properties of optic neuritis patients manifesting statokinetic dissociation.Appl Opt. 1991 Jun 1;30(16):2136-42. doi: 10.1364/AO.30.002136. Appl Opt. 1991. PMID: 20700188
-
What are the options of psychophysical approaches in glaucoma?Surv Ophthalmol. 2007 Nov;52 Suppl 2:S127-33. doi: 10.1016/j.survophthal.2007.08.007. Surv Ophthalmol. 2007. PMID: 17998037 Review.
-
Selective perimetry in glaucoma diagnosis.Curr Opin Ophthalmol. 2007 Mar;18(2):115-21. doi: 10.1097/ICU.0b013e3280555096. Curr Opin Ophthalmol. 2007. PMID: 17301612 Review.
Cited by
-
Functional characteristics of glaucoma related arcuate defects seen on OCT en face visualisation of the retinal nerve fibre layer.Ophthalmic Physiol Opt. 2021 Mar;41(2):437-446. doi: 10.1111/opo.12780. Epub 2021 Jan 25. Ophthalmic Physiol Opt. 2021. PMID: 33492742 Free PMC article.
-
Validation of a novel functional test for assessing metamorphopsia using epiretinal membranes as a model.Sci Rep. 2020 Sep 10;10(1):14938. doi: 10.1038/s41598-020-71627-1. Sci Rep. 2020. PMID: 32913214 Free PMC article.
-
Optimising the Structure-Function Relationship at the Locus of Deficit in Retinal Disease.Front Neurosci. 2019 Apr 9;13:306. doi: 10.3389/fnins.2019.00306. eCollection 2019. Front Neurosci. 2019. PMID: 31024235 Free PMC article.
-
National Consensus on the Assessment of Visual Function for Driving in Switzerland.Klin Monbl Augenheilkd. 2025 Apr;242(4):507-514. doi: 10.1055/a-2479-9305. Epub 2025 Jan 21. Klin Monbl Augenheilkd. 2025. PMID: 39837537 Free PMC article.
References
-
- Jampel HD, Singh K, Lin SC, et al. Assessment of visual function in glaucoma: a report by the American Academy of Ophthalmology. Ophthalmology. 2011;118:986–1002. - PubMed
-
- Riddoch G. Dissociation of visual perceptions due to occipital injuries, with especial reference to appreciation of movement. Brain. 1917;40:15–57.
-
- Schiller J, Paetzold J, Vonthein R, et al. Quantification of stato-kinetic dissociation by semi-automated perimetry. Vision Res. 2006;46:117–128. - PubMed
LinkOut - more resources
Full Text Sources
Molecular Biology Databases
Miscellaneous

